

Farm share of U.S. food dollar increased in 2019 after 7 years of decline
- by Quinton Baker
- 3/31/2021
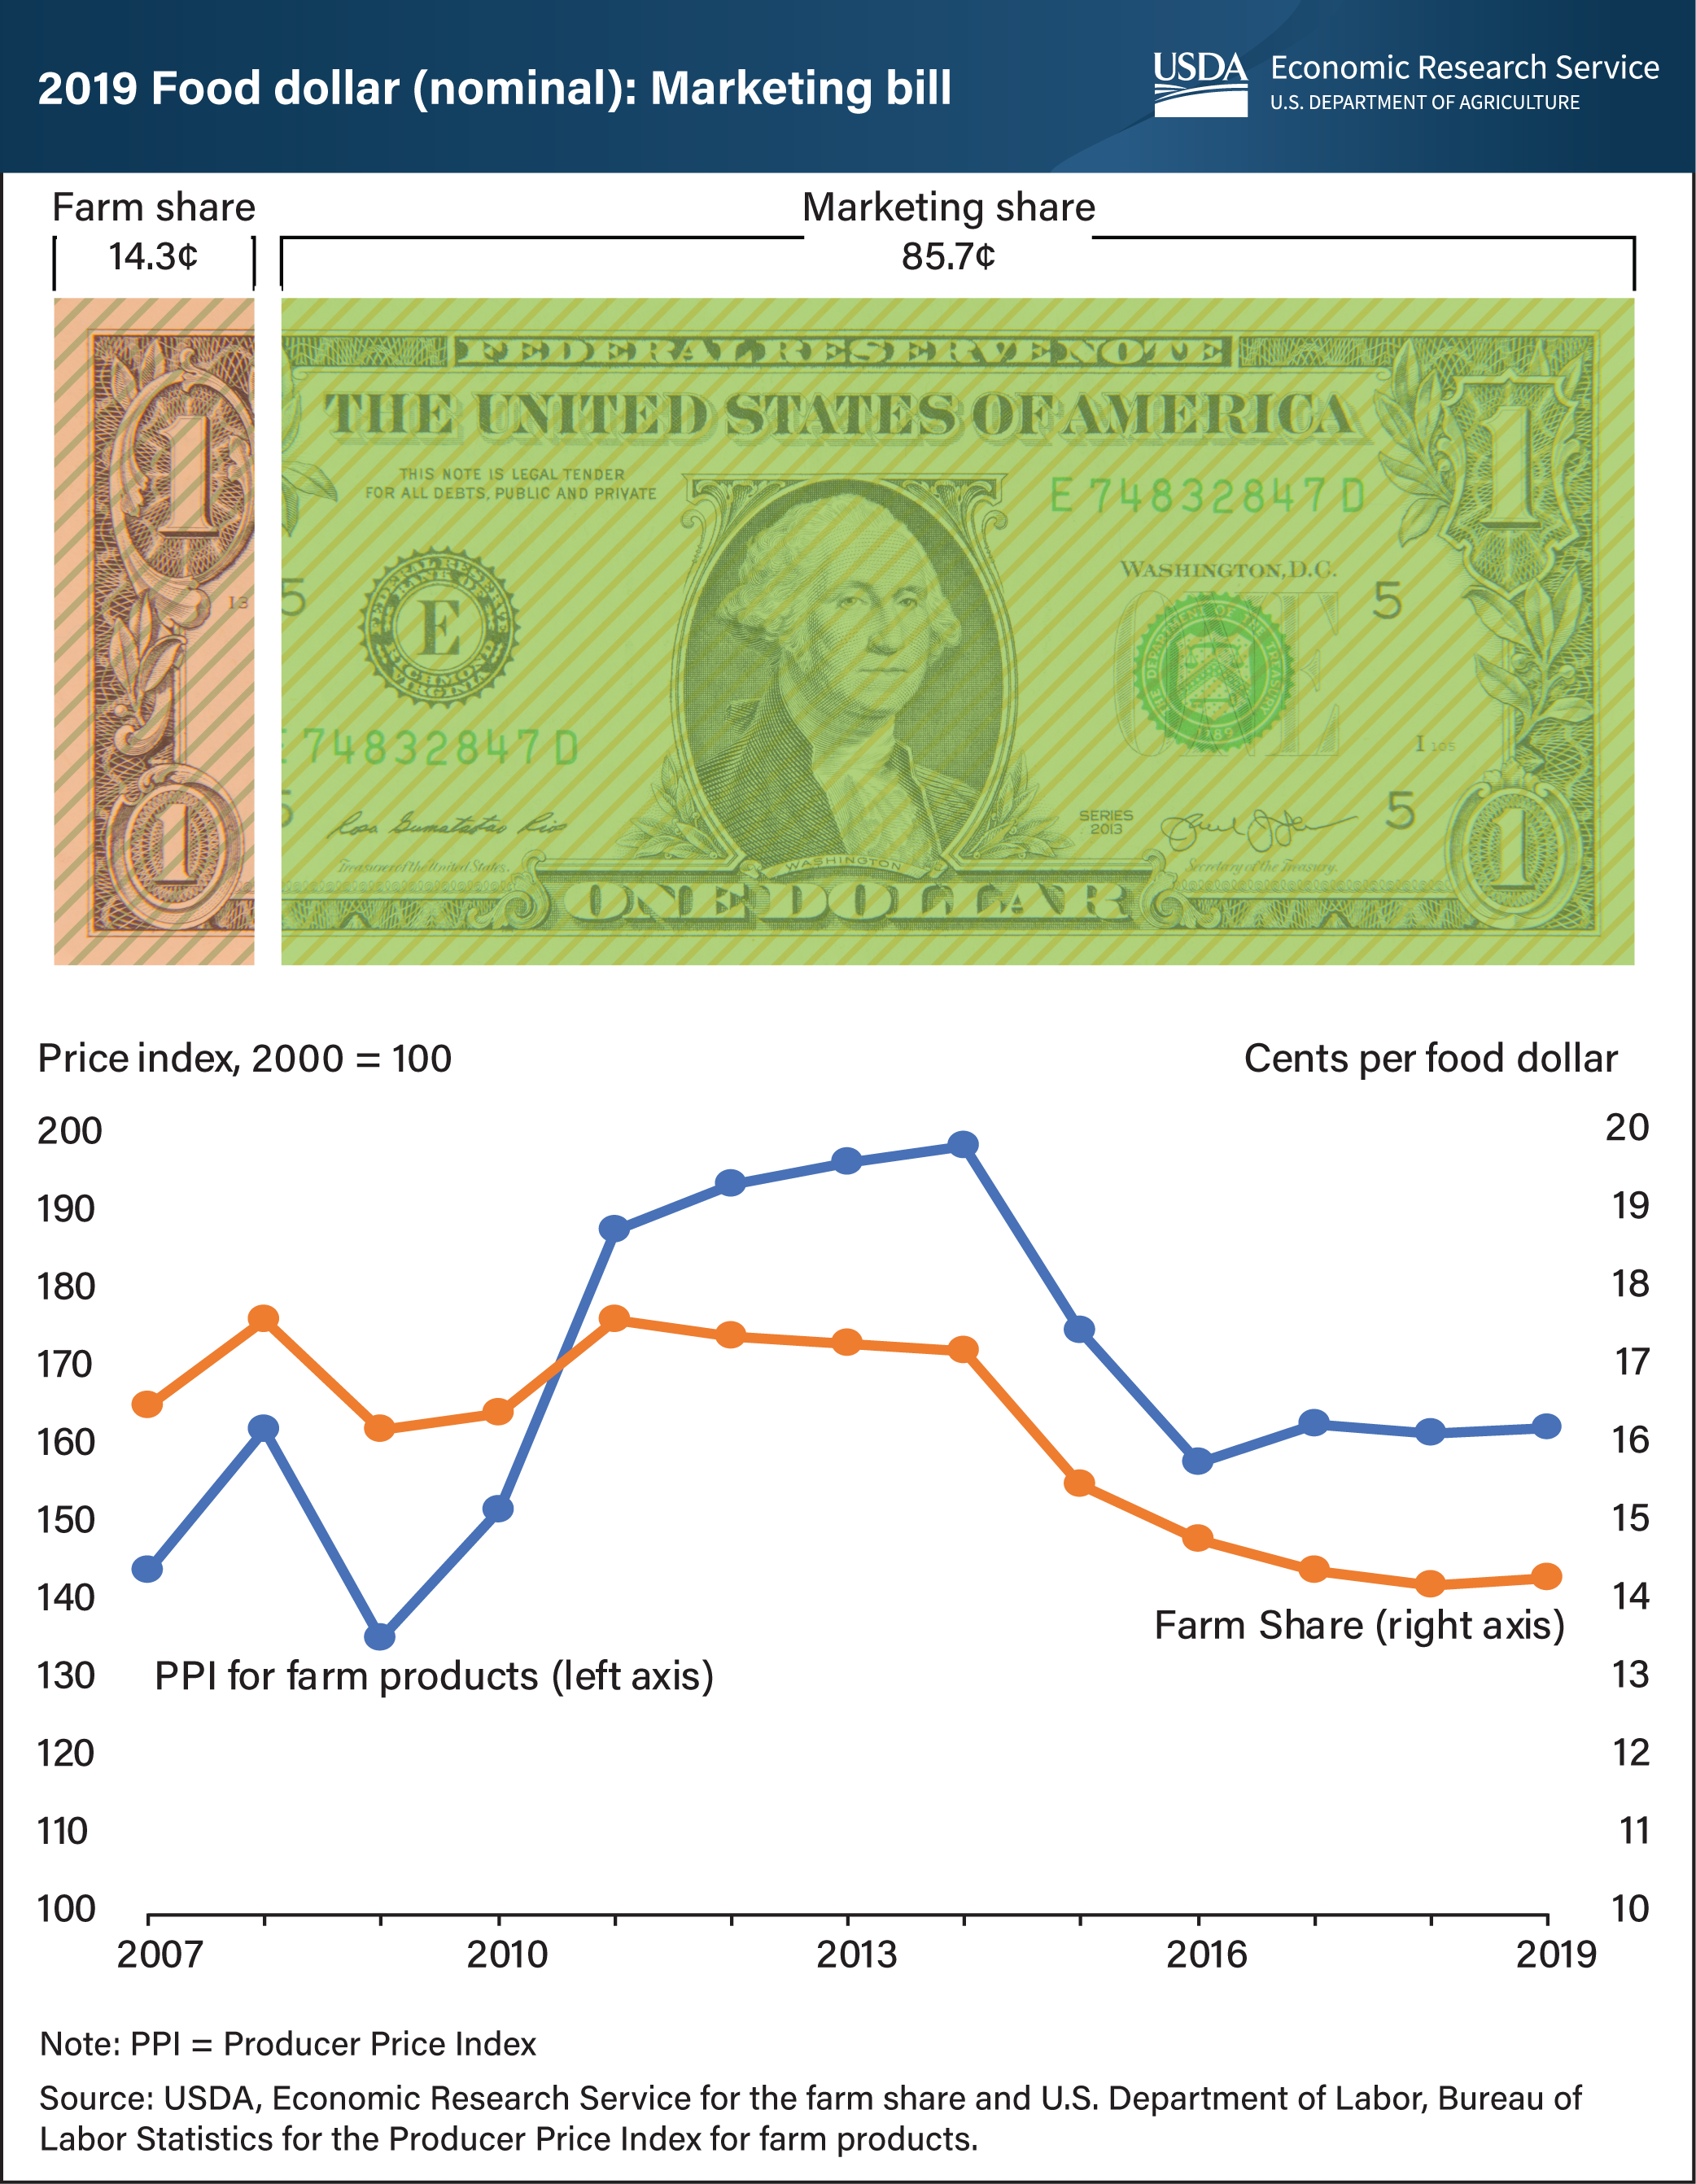
On average, U.S. farmers received 14.3 cents for farm commodity sales from each dollar spent on domestically produced food in 2019, up from a newly revised estimate of 14.2 cents in 2018. Known as the farm share, this amount increased slightly after 7 consecutive years of decline. Average prices received by U.S. farmers (as measured by the Producer Price Index for farm products) have been relatively stable for the last three years, following sharp declines in 2015 and 2016. The USDA, Economic Research Service (ERS) uses input-output analysis to calculate the farm and marketing shares from a typical food dollar, including food purchased at grocery stores and at eating-out establishments. The marketing share covers the costs of getting domestically produced food from farms to points of purchase, including costs related to packaging, transporting, processing, and selling to consumers at grocery stores and eating-out places. The farm and marketing shares of the food dollar in 2019 reflect conditions before the COVID-19 pandemic. Beginning in March 2020, the ERS monthly Food Expenditure Series reported sharp declines in the share of eating-out food dollars. Farmers receive a smaller share from eating-out dollars because of the added costs for preparing and serving meals at restaurants, cafeterias and other food-service establishments. The data for this chart can be found in ERS’s Food Dollar Series data product, updated March 17, 2021.