
Food at home’s share of total food spending hit a high of 66 percent in April 2020
- by Wilson Sinclair and Eliana Zeballos
- 12/23/2020
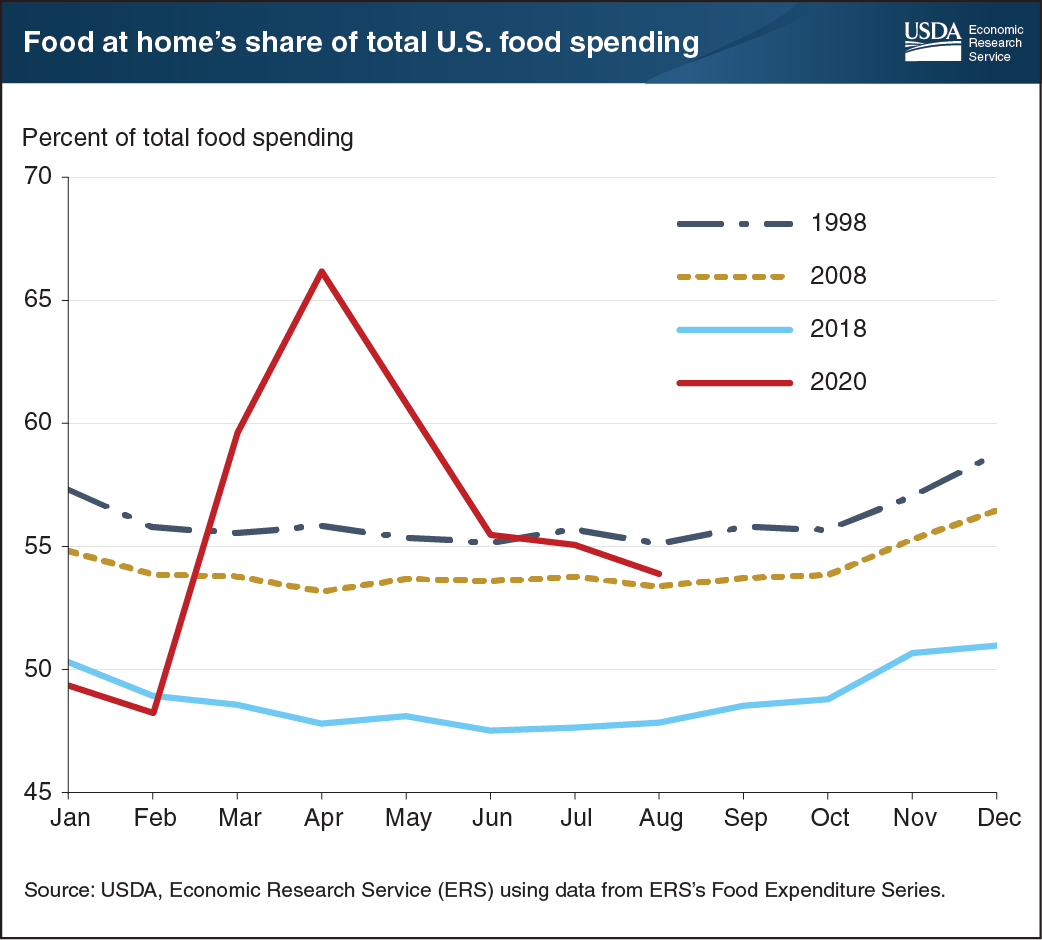
The share of U.S. food expenditures occurring at grocery stores, supercenters, and other food-at-home retailers typically displays a consistent seasonal pattern. U.S. consumers devote relatively more money to food-at-home spending in the winter months—a time of Thanksgiving and holiday gatherings. The summer months see the highest share of spending at food-away-from-home places such as restaurants, cafeterias, and other eating-out places. While seasonal patterns have stayed constant until 2020, the share of total food spending dedicated to food at home has not. In 1998, food at home’s share was above 55 percent of total food spending throughout the year. Ten years later, 2008 saw the share of food spending devoted to food at home decrease a few percentage points despite the Great Recession of 2007-2009. In 2018, food at home’s share was below 50 percent in all but the winter months. The COVID-19 pandemic has upended past seasonal trends and expanded food at home’s share of total food spending. Food at home in August 2020 accounted for 54 percent of total food spending, after peaking at 66 percent in April 2020. The data for this chart come from the Economic Research Service’s Food Expenditure Series data product, updated October 16, 2020.
This Chart of Note was originally published on Wednesday, October 28, 2020.