
U.S. milk output per cow rose steadily from 2000-20, while the total number of milk cows fluctuated
- by Eric Njuki
- 3/22/2022
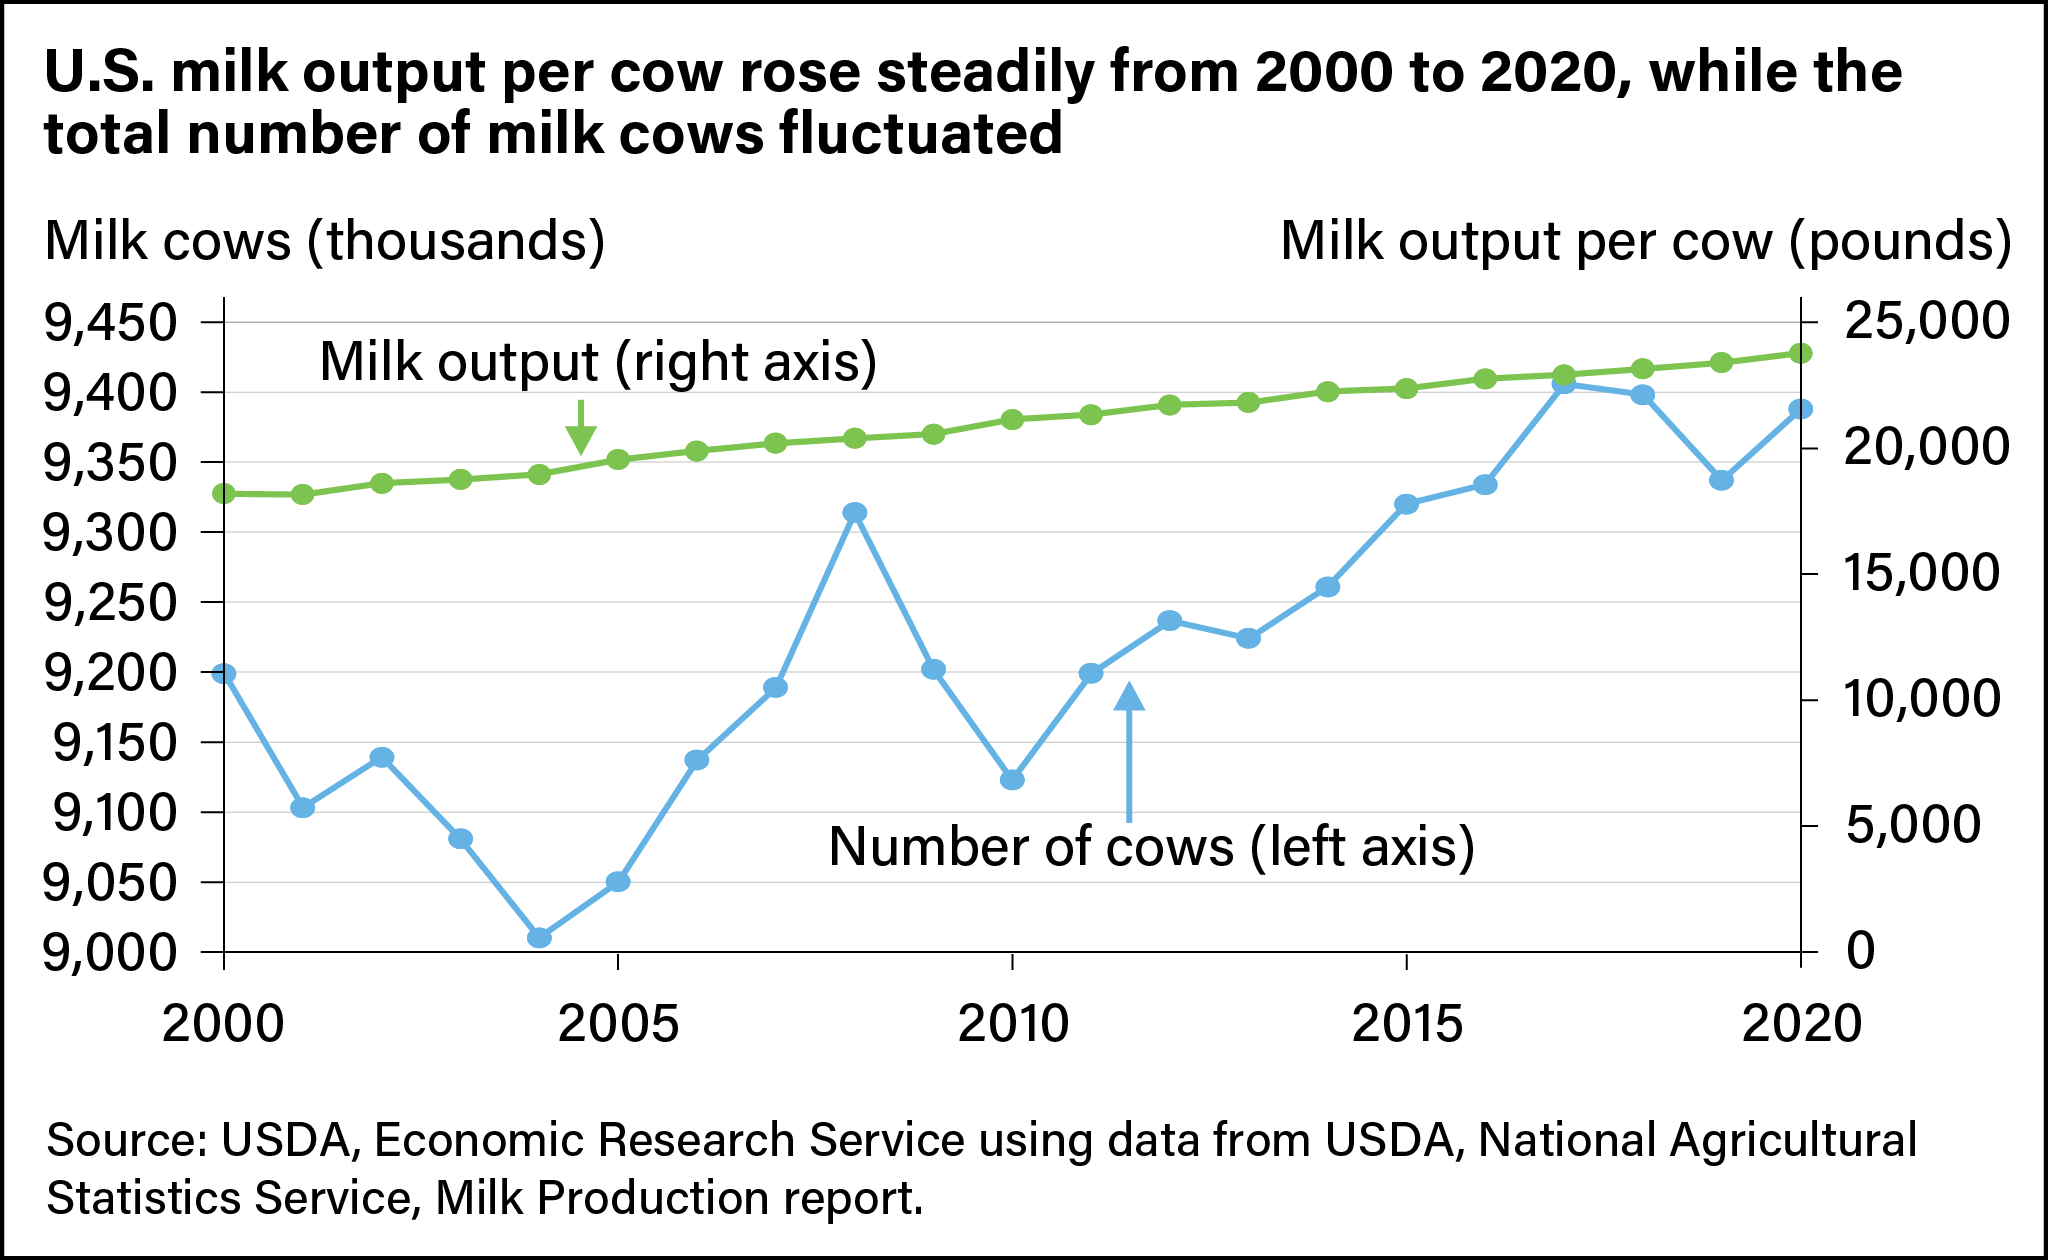
Line chart indicating number of U.S. milk cows (in the thousands) and milk output (in pounds) from 2000 to 2020.
We’d welcome your feedback!
Would you be willing to answer a few quick questions about your experience?