

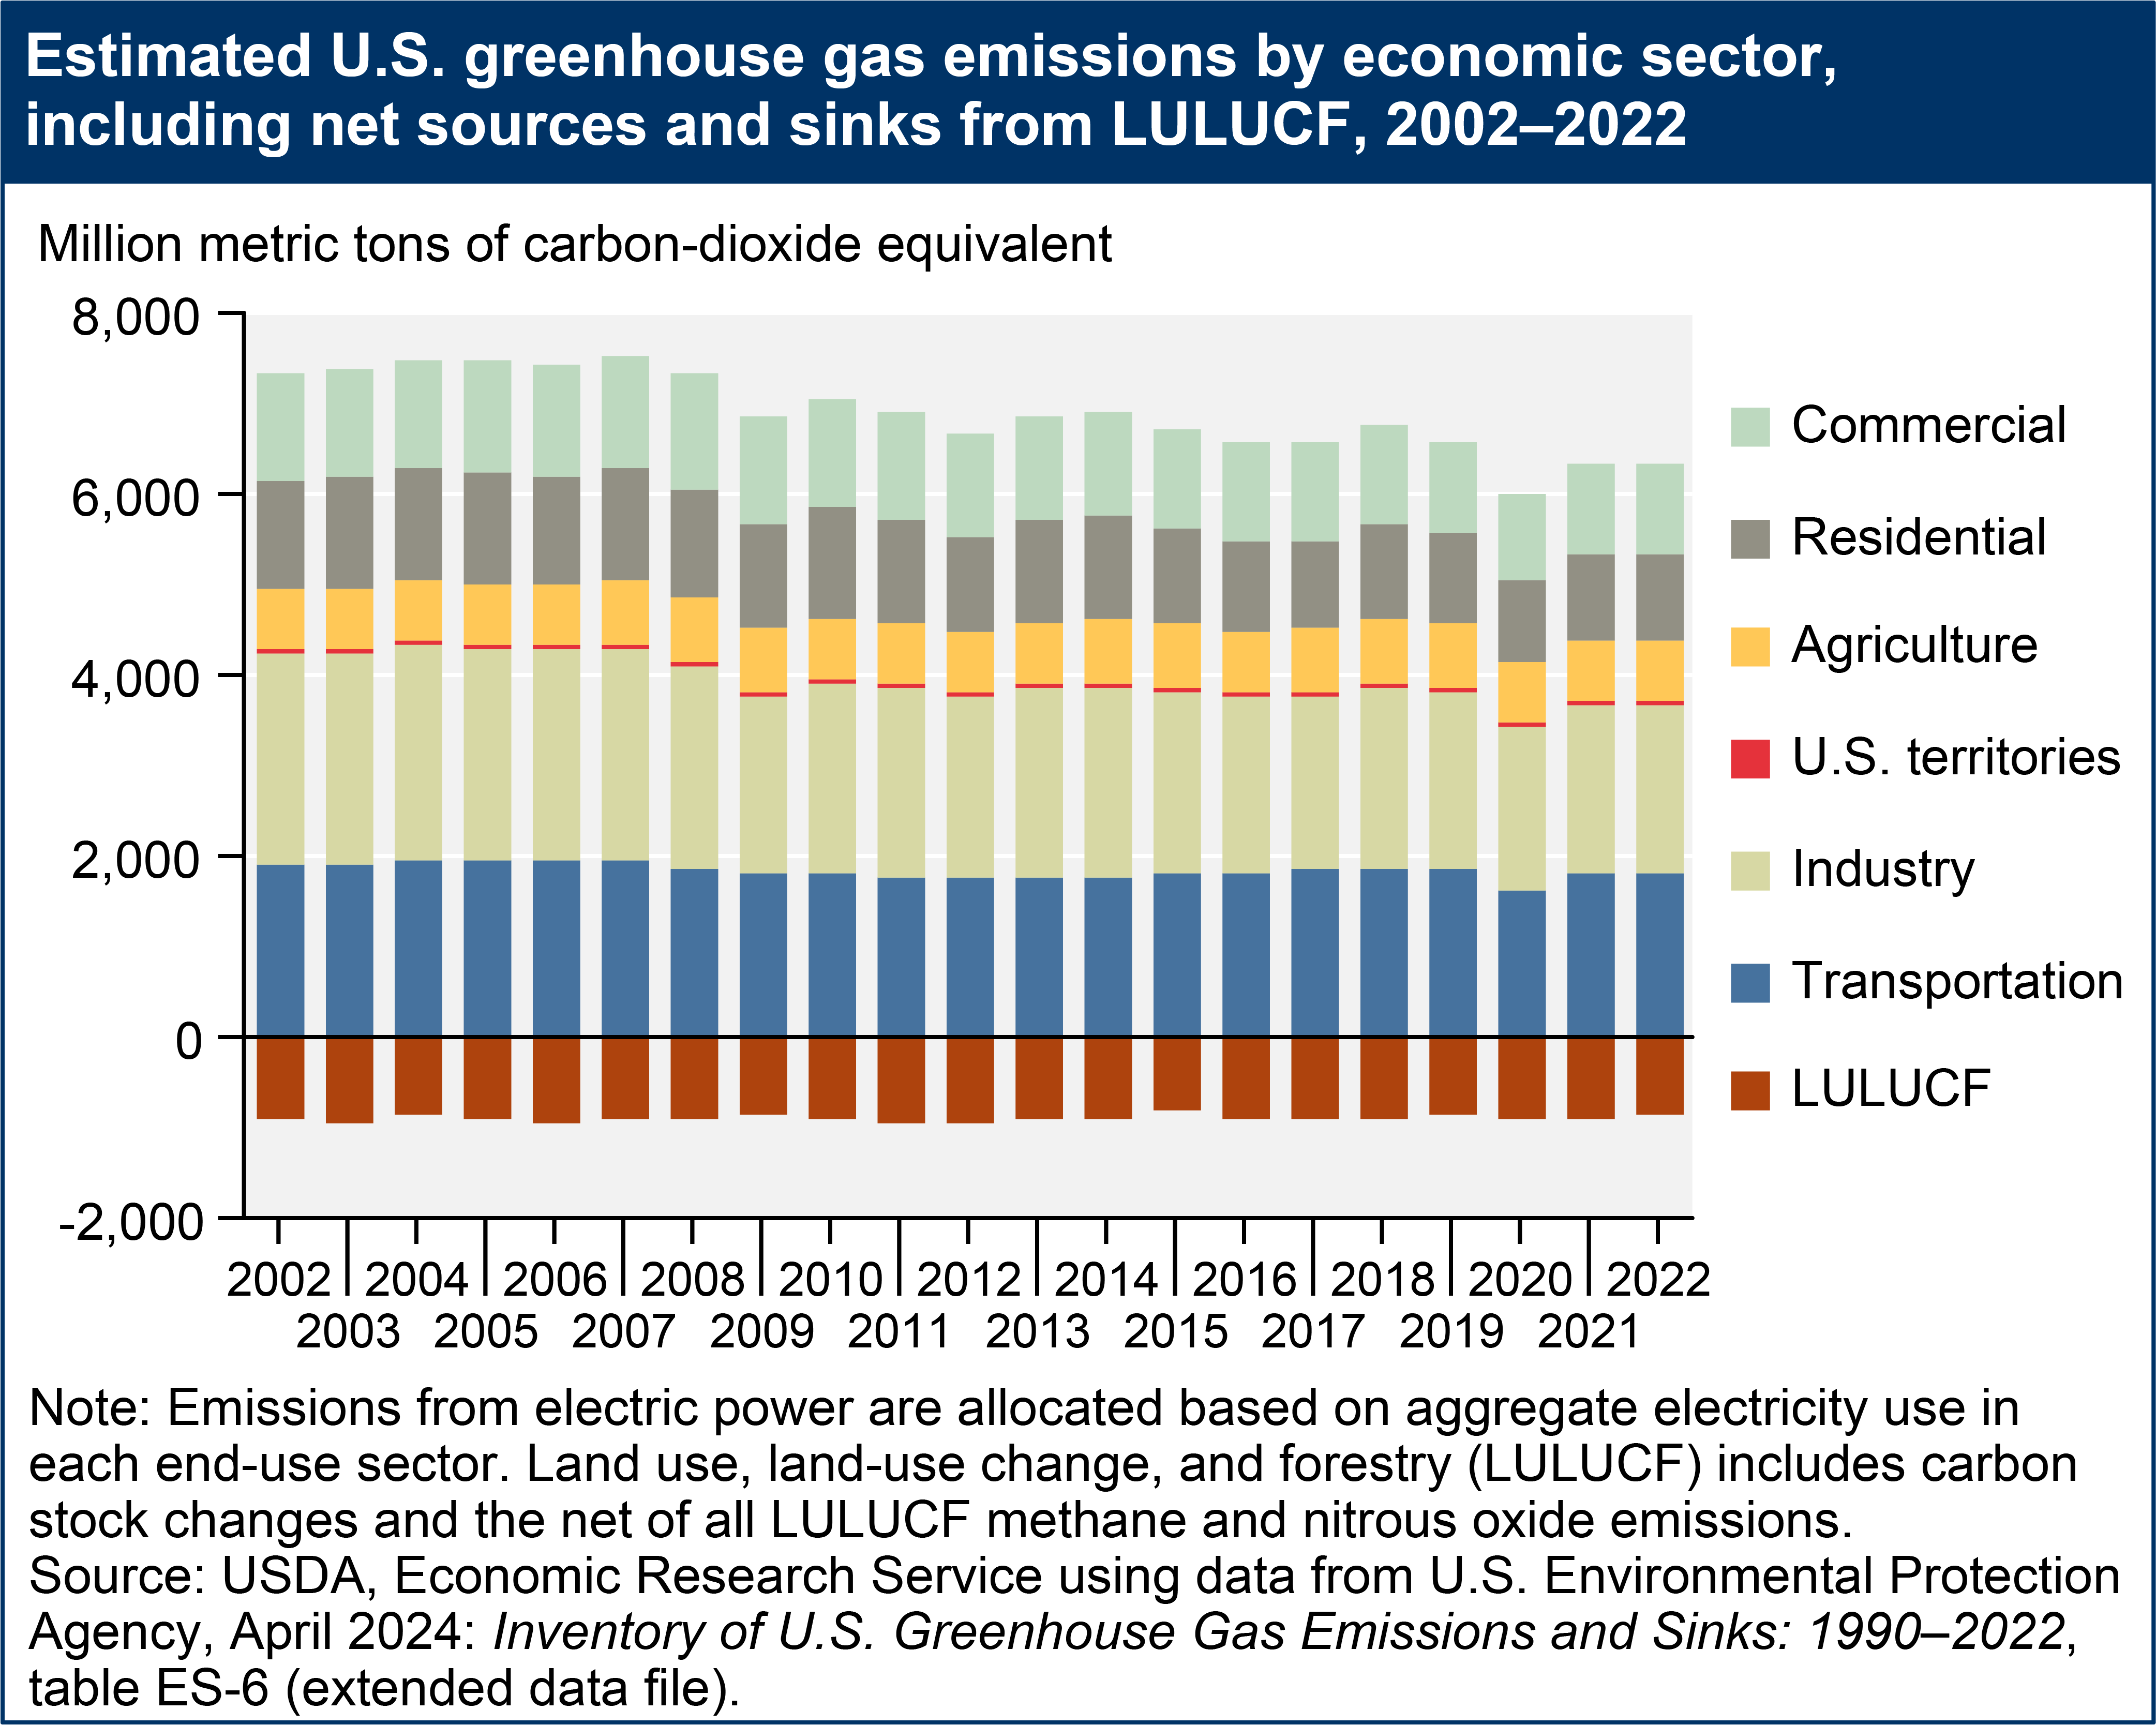
Estimated U.S. greenhouse gas emissions by economic sector, including net sources and sinks from LULUCF, 2002–2022
- by Ron Sands and Kate Binzen Fuller
- 10/17/2024
Download chart image | Chart data
Estimated U.S. greenhouse gas emissions by economic sector, including net sources and sinks from LULUCF, 2002–2022