



Top regions for U.S. agricultural exports remain East Asia and North America
- by James Kaufman
- 6/30/2026
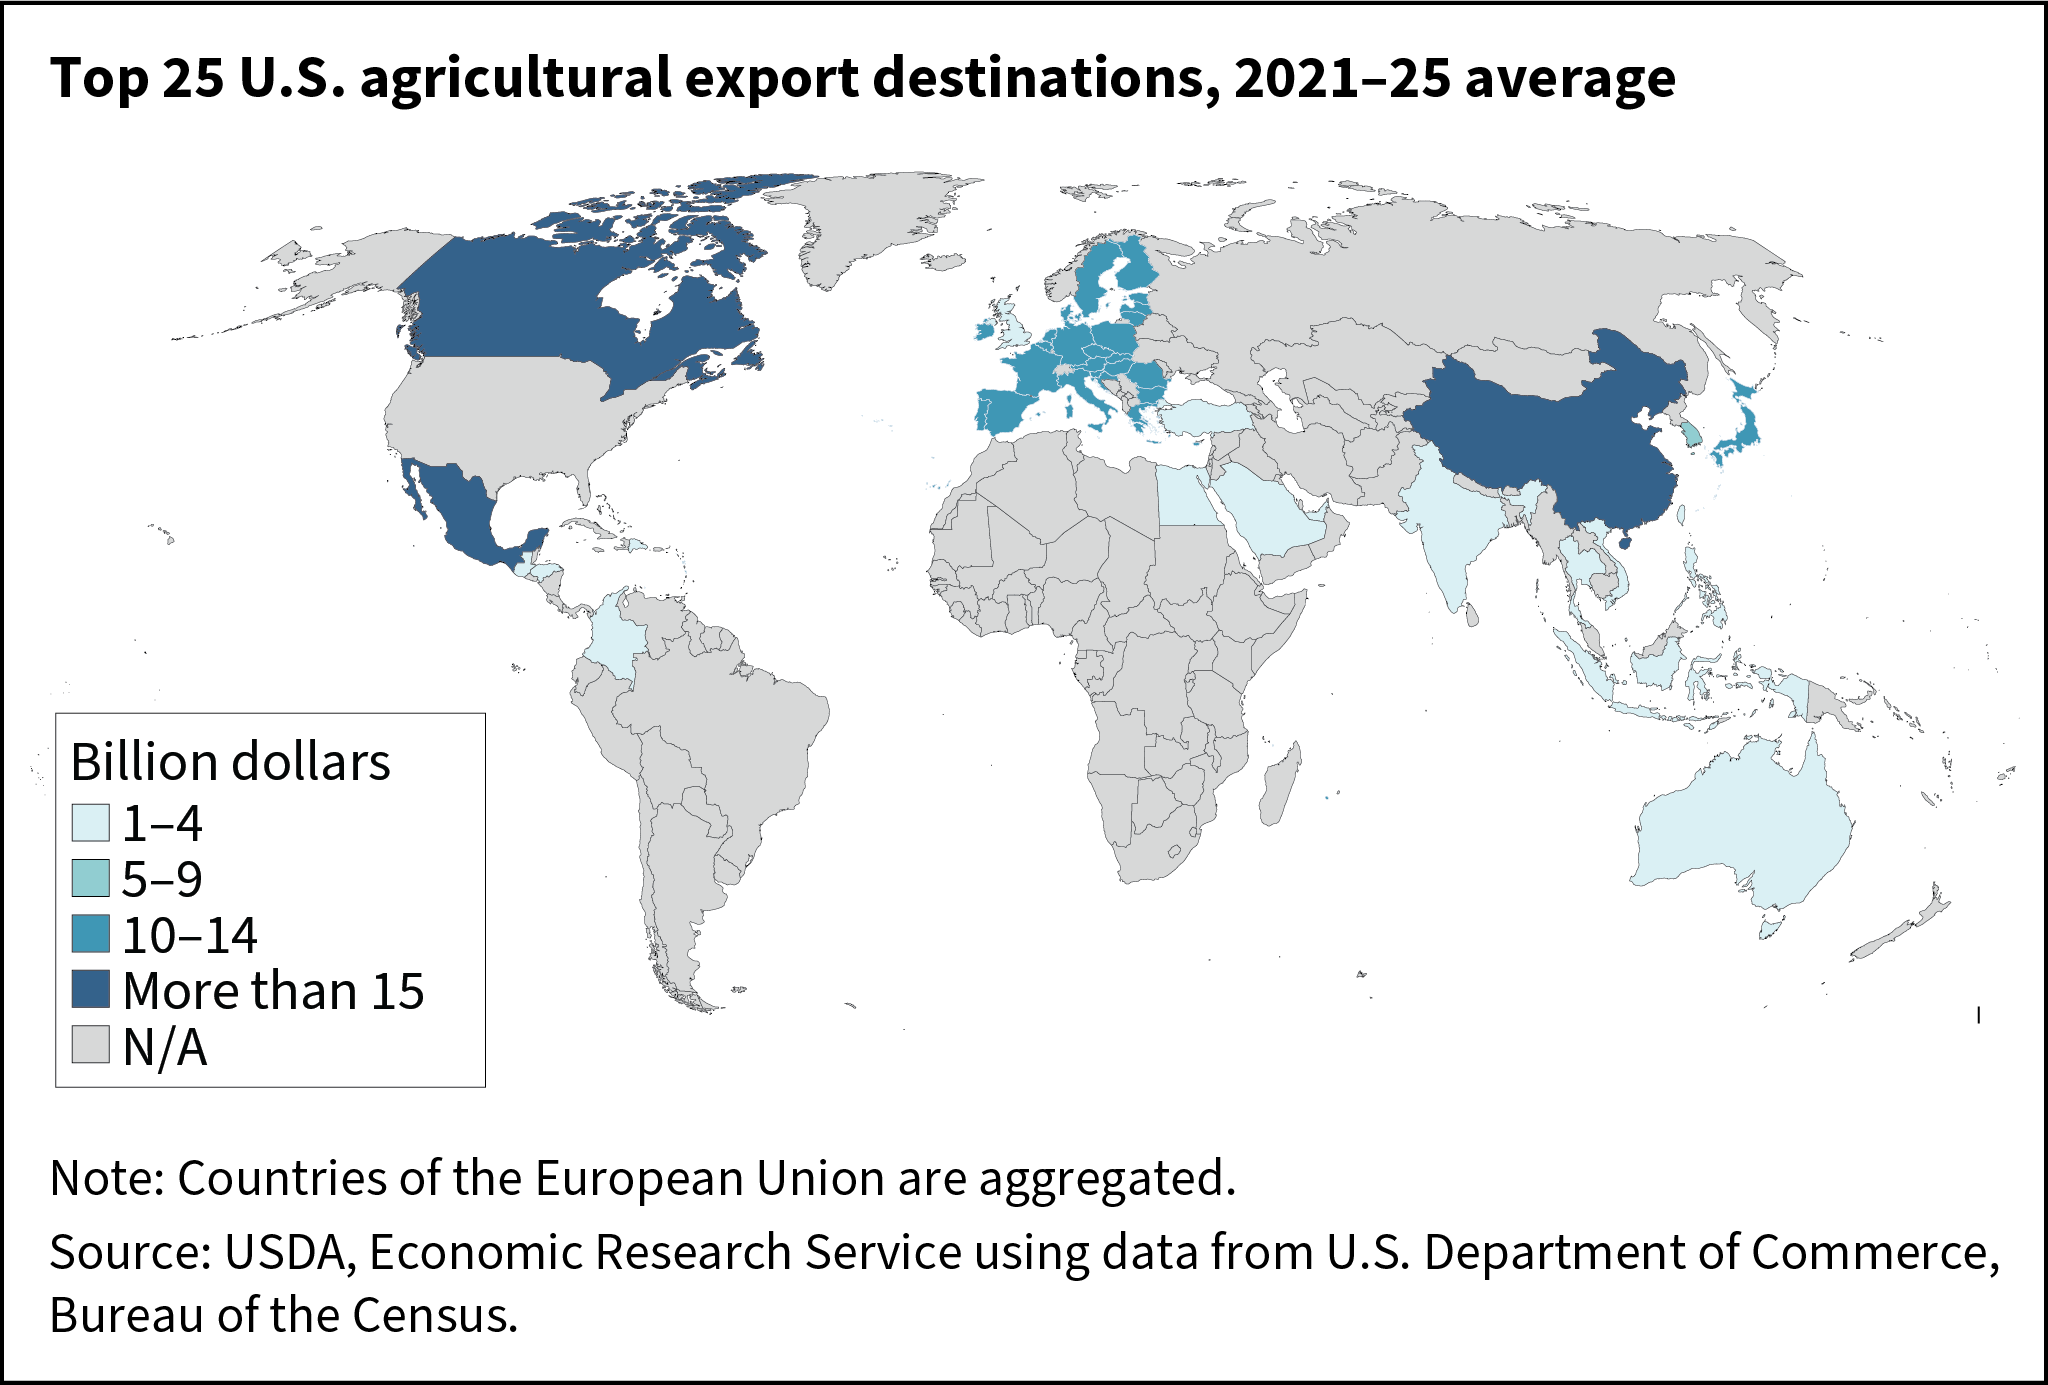
Between 2021–25, 62 percent of U.S. agricultural exports went to markets in North America and East Asia. The share of U.S. agricultural exports to Canada and Mexico has been growing to account for 32 percent of total exports in 2021–25. East Asia (led by China, Japan, and South Korea) was the second largest market, with a collective 30 percent share. The top three commodity groups exported to East Asia included oilseeds, grains, and meats. The third largest regional destination is Southeast Asia (led by the Philippines, Vietnam, and Indonesia), followed closely by the European Union.
We’d welcome your feedback!
Would you be willing to answer a few quick questions about your experience?