



The top 5 U.S. agricultural trading partners accounted for 56 percent of U.S. agricultural exports in 2025
- by James Kaufman
- 6/30/2026
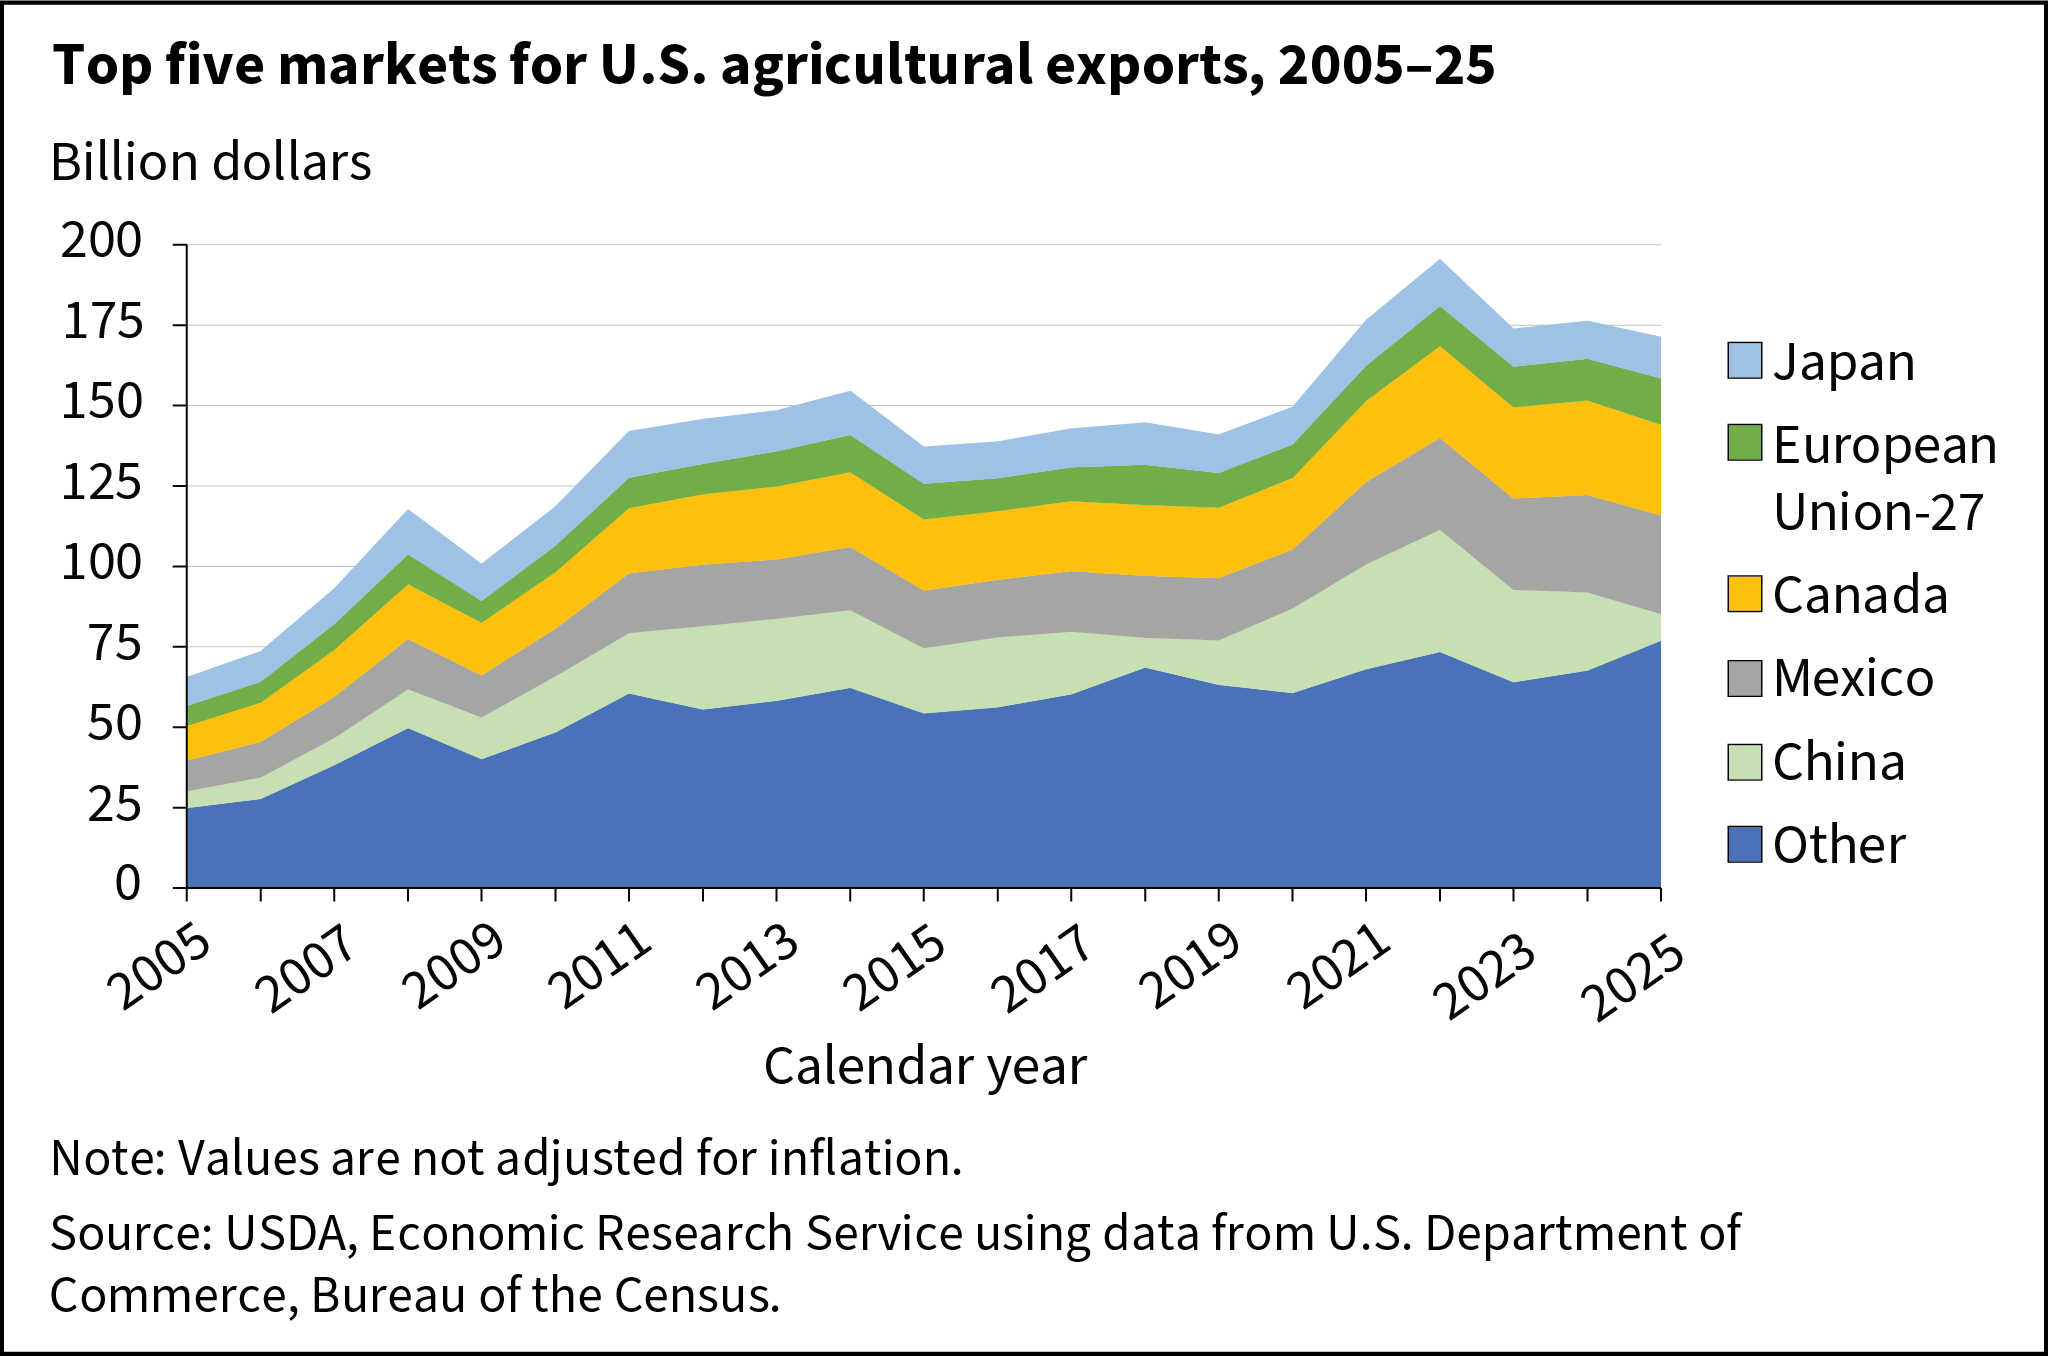
The United States exported $171 billion in agricultural goods in 2025, with 56 percent going to the top 5 markets (Mexico, Canada, the European Union, Japan and South Korea)—a decline from 62 percent in 2024. U.S. agricultural exports to Mexico, the largest U.S. agricultural trading partner, grew 1 percent in 2025. Top exports to Mexico included corn, dairy products, pork and pork products, soybeans, and poultry meat and products. Exports to Canada, the second largest export market, fell 4 percent to $28.2 billion. Top U.S. exports to Canada included bakery goods, fresh vegetables, fresh fruits, ethanol, and food preparations. In 2025, China fell from the list of the top 5 export markets to sixth place, with exports falling 66 percent from 2024 to $8.4 billion. This reduction was associated with reciprocal tariffs and lowered demand for U.S. soybeans. U.S. agricultural exports to the European Union reached a record $14.5 billion in 2025, a 13-percent increase from the previous year, led by strong corn and tree nut sales.
We’d welcome your feedback!
Would you be willing to answer a few quick questions about your experience?