



U.S. agricultural export values of bulk products fall in 2025
- by James Kaufman
- 6/30/2026
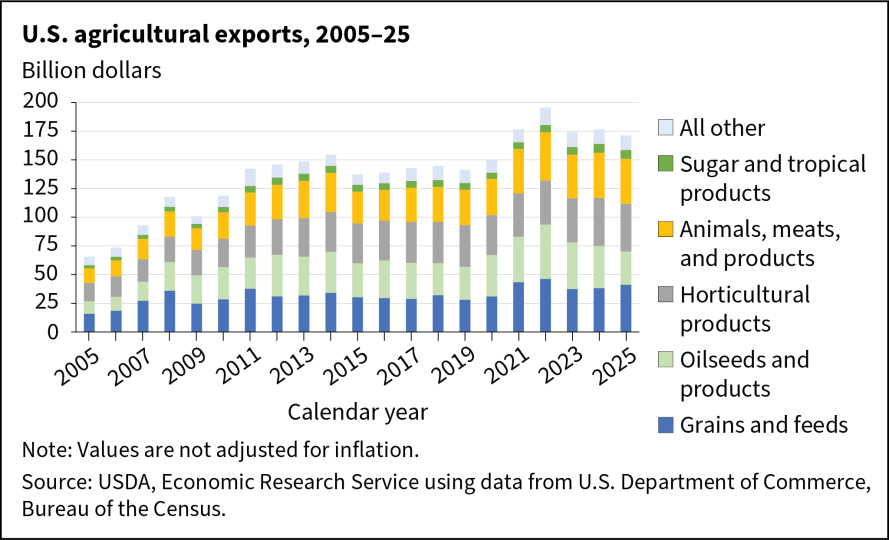
U.S. agricultural export values, not adjusted for inflation, peaked in 2022 and declined to 171 billion in 2025. This decline was due to falling global commodity prices, a strong dollar, and shifting demand for some commodities (such as corn and soybeans). Four categories typically make up about 90 percent of exports: grains and feeds, oilseeds and products, livestock and animal products, and horticultural products. Within these categories, the top 10 U.S. agricultural exports in 2025 were corn, soybeans, tree nuts, dairy products, beef and beef products, vegetables, fruits, poultry meat and products, pork and pork products, and wheat. While exports of soybeans fell in 2025, corn, tree nuts and dairy products exports grew relative to the previous year.
We’d welcome your feedback!
Would you be willing to answer a few quick questions about your experience?