
Note: Updates to this page are discontinued. The material—last updated on January 21, 2022—remains on the site for reference.
Note: The terms "Nonmetropolitan" (nonmetro) and "rural" are used interchangeably, as are "metropolitan" (metro) and "urban." Not all fully-vaccinated people have an associated address in the source data; therefore, the vaccination rate calculated by county metropolitan status is lower than the national rate. Cumulative COVID-19 related deaths are per 100,000 population. Counties classified here as having "large" minority populations are those with a specified minority population that is 25 percent or more of the total county population. Analysis is for the population indicating one (not Hispanic/Latino) race alone or Hispanic/Latino ethnicity and does not include Asian or Native Hawaiian/Other Pacific Islander. People who are Hispanic may be of any race.
Overview of COVID-19 Vaccinations in the United States
The public rollout of COVID-19 vaccines began in the United States in mid-December 2020. During the early phases of vaccination, States largely restricted vaccination eligibility to frontline healthcare workers, adults 65 and older, individuals with high-risk medical conditions, and essential workers. Several States began opening eligibility to all adults in late March and early April 2021. By the time the initial phases of vaccination ended in mid-April 2021, about 25 percent of the U.S. population was fully vaccinated. After all U.S. adults became eligible for vaccination on April 19, 2021, trends in vaccination rates began to diverge depending on county characteristics like metropolitan status, age, and racial/ethnic composition. This divergence may have left residents in counties with lower vaccination rates more vulnerable to the Delta variant of coronavirus, which emerged in July 2021. By January 10, 2022, 62 percent of Americans were fully vaccinated.
Vaccination Rates are Lower in Rural America
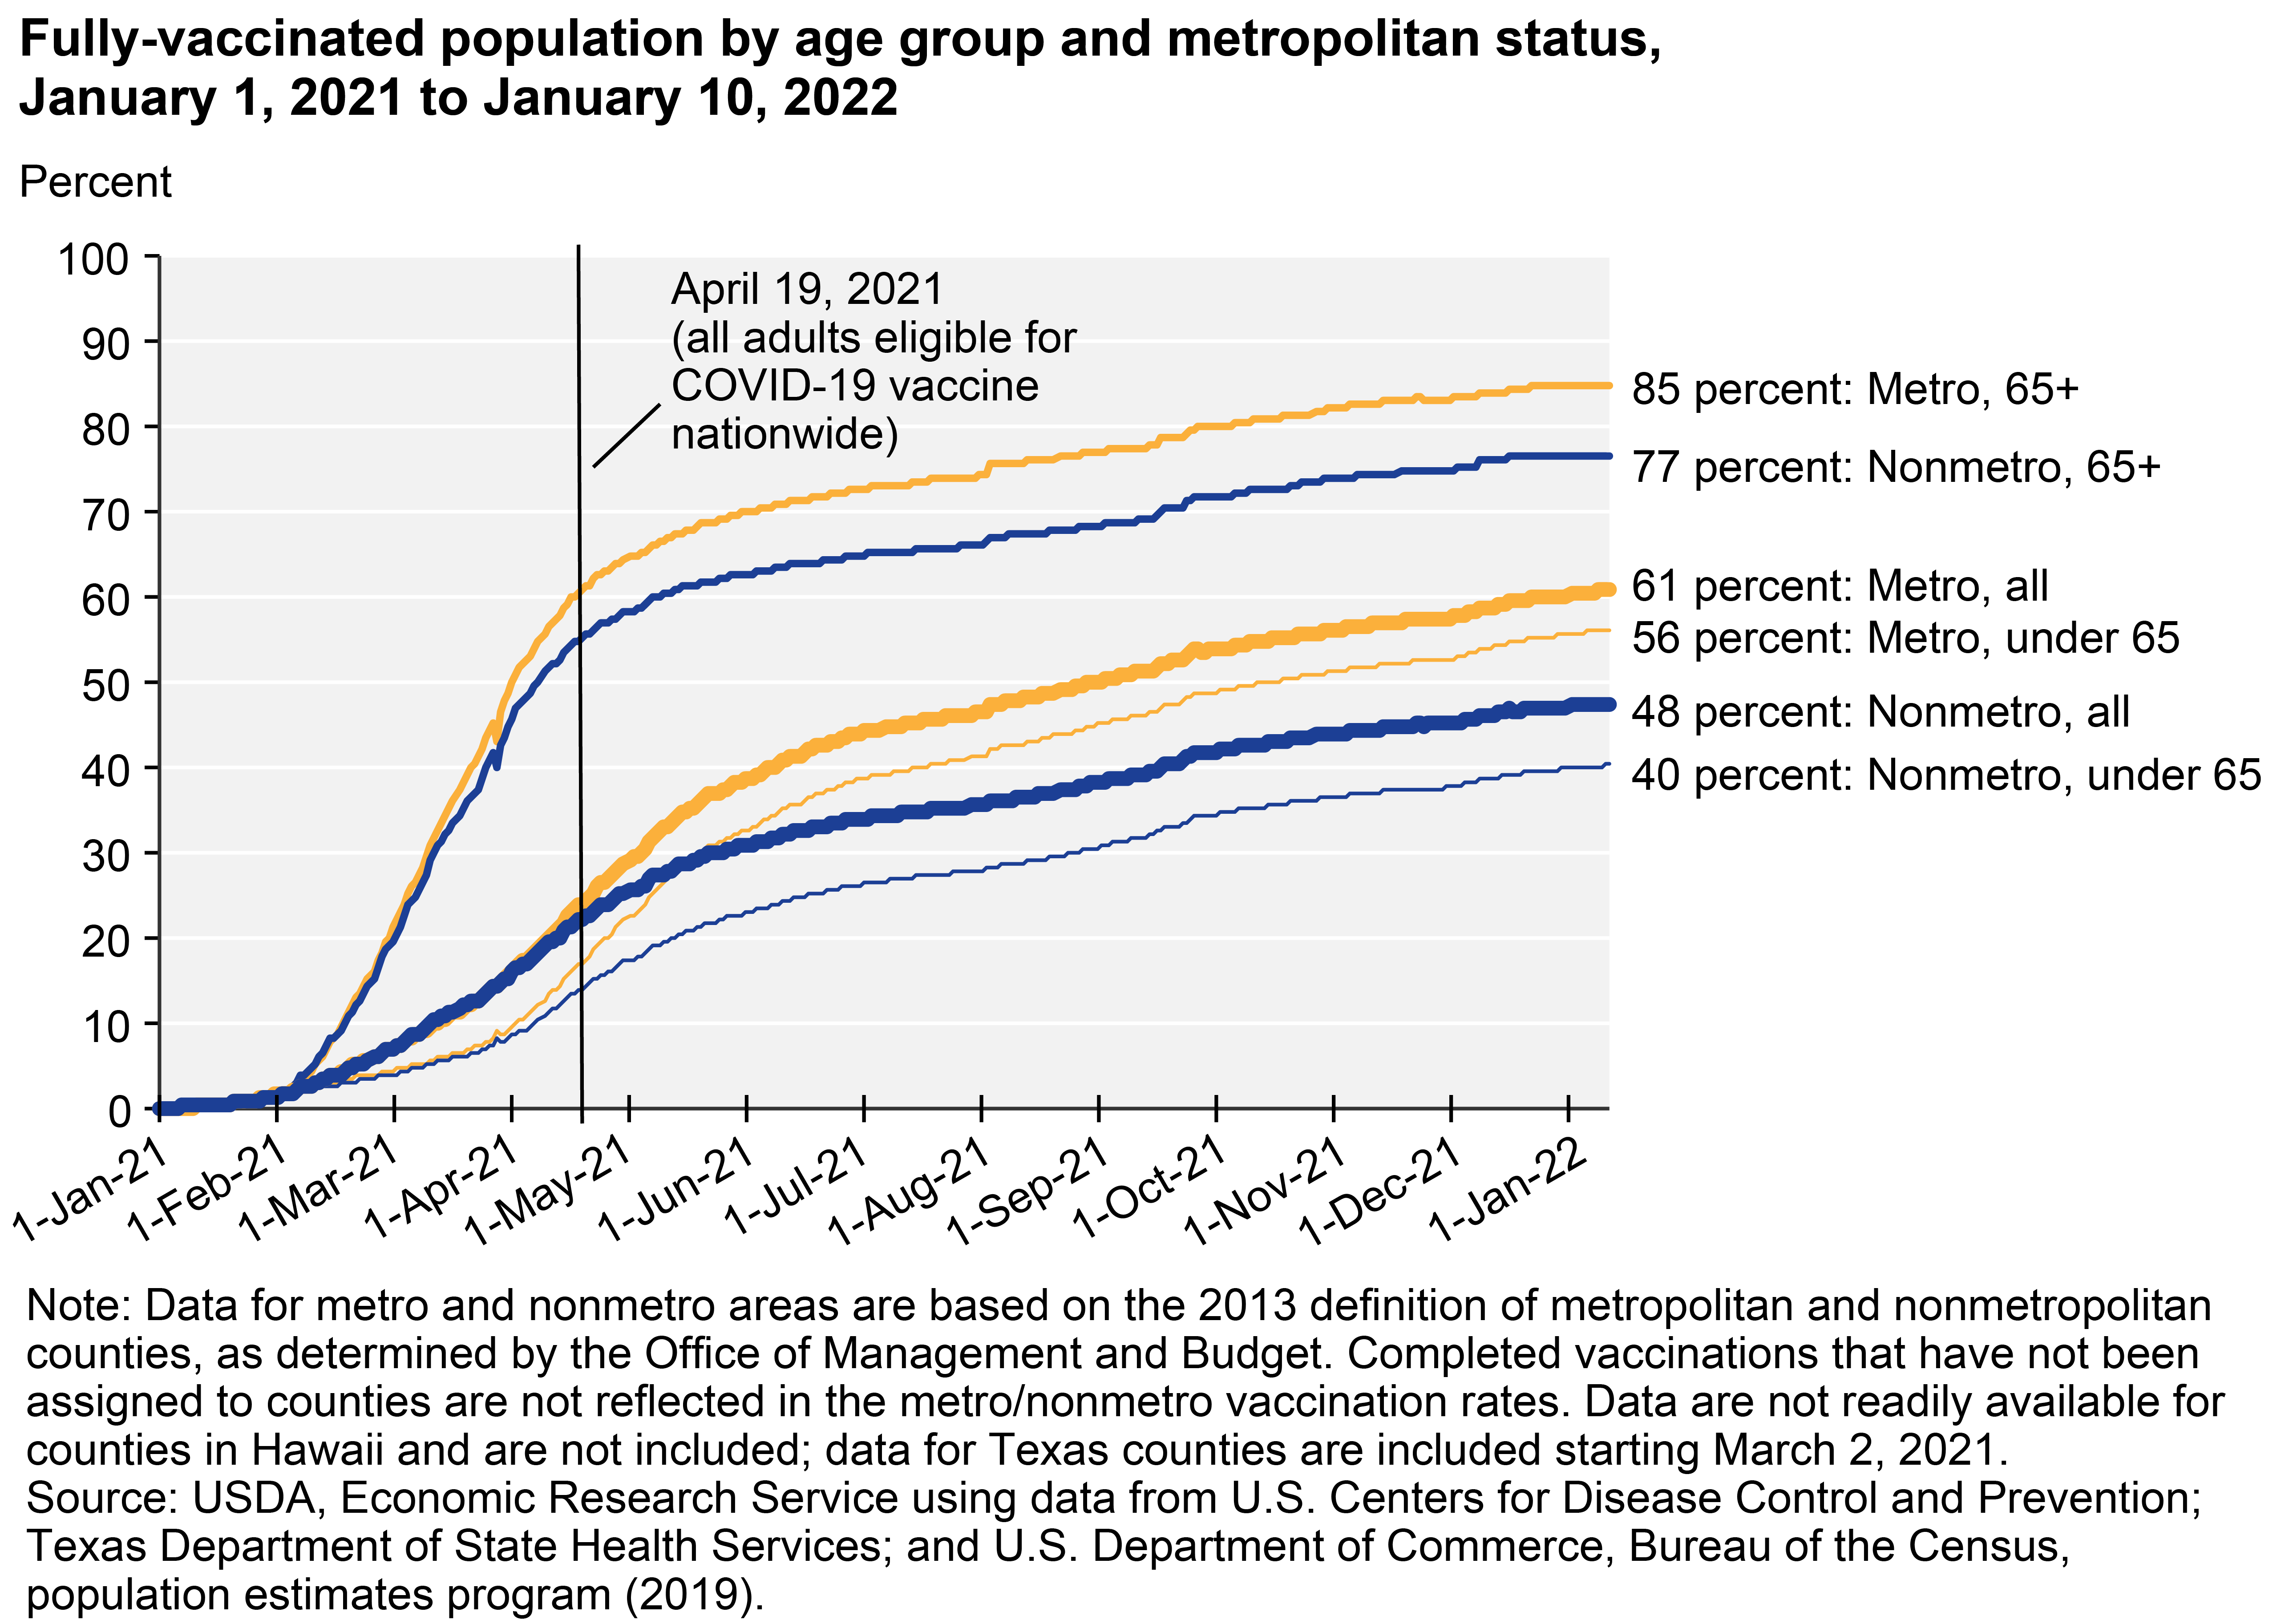
Data from the U.S. Centers for Disease Control and Prevention (CDC) and State health departments show that on January 10, 2022, the vaccination rate in nonmetropolitan (nonmetro) counties was lower than in metropolitan (metro) counties—48 percent in nonmetro areas versus 61 percent in metro. During the early phases of vaccination when vaccines were limited to those at high risk of exposure or severe symptoms, overall vaccination rates increased at roughly the same rate in metro and nonmetro areas. However, differences between metro and nonmetro vaccination rates by age group were already beginning to show. Once all adults became eligible for vaccination, the overall vaccination rate increased faster in metro counties than in nonmetro counties. The pace of vaccination slowed in both metro and nonmetro counties during the early summer months of 2021 as the rate of new COVID-19 cases slowed. From July to late September 2021, vaccinations increased at a steady pace as the Delta variant created a new surge in cases.
Download chart image | Chart data
Adults 65 and Older are More Likely to be Vaccinated
On January 10, 2022, vaccination rates for adults 65 and older were 85 percent in metro counties and 77 percent in nonmetro counties, while rates for people under 65 were 56 percent in metro counties and 40 percent in nonmetro counties. The vaccination rate for adults 65 and older increased rapidly from February through mid-April 2021, then slowed when all adults became eligible for vaccination. Subsequently, the gap between metro and nonmetro vaccination rates increased more rapidly, especially for people under age 65. Between April 19, 2021—when all adults became eligible for the COVID-19 vaccine—and January 10, 2022, vaccination rates for adults under 65 in nonmetro areas increased from 14 percent to 40 percent, while vaccination rates for their counterparts in metro areas increased from 17 percent to 56 percent. With lower vaccination rates in both older and younger populations and a higher proportion of residents 65 and older, residents of nonmetro counties could be more vulnerable during new surges in COVID-19.
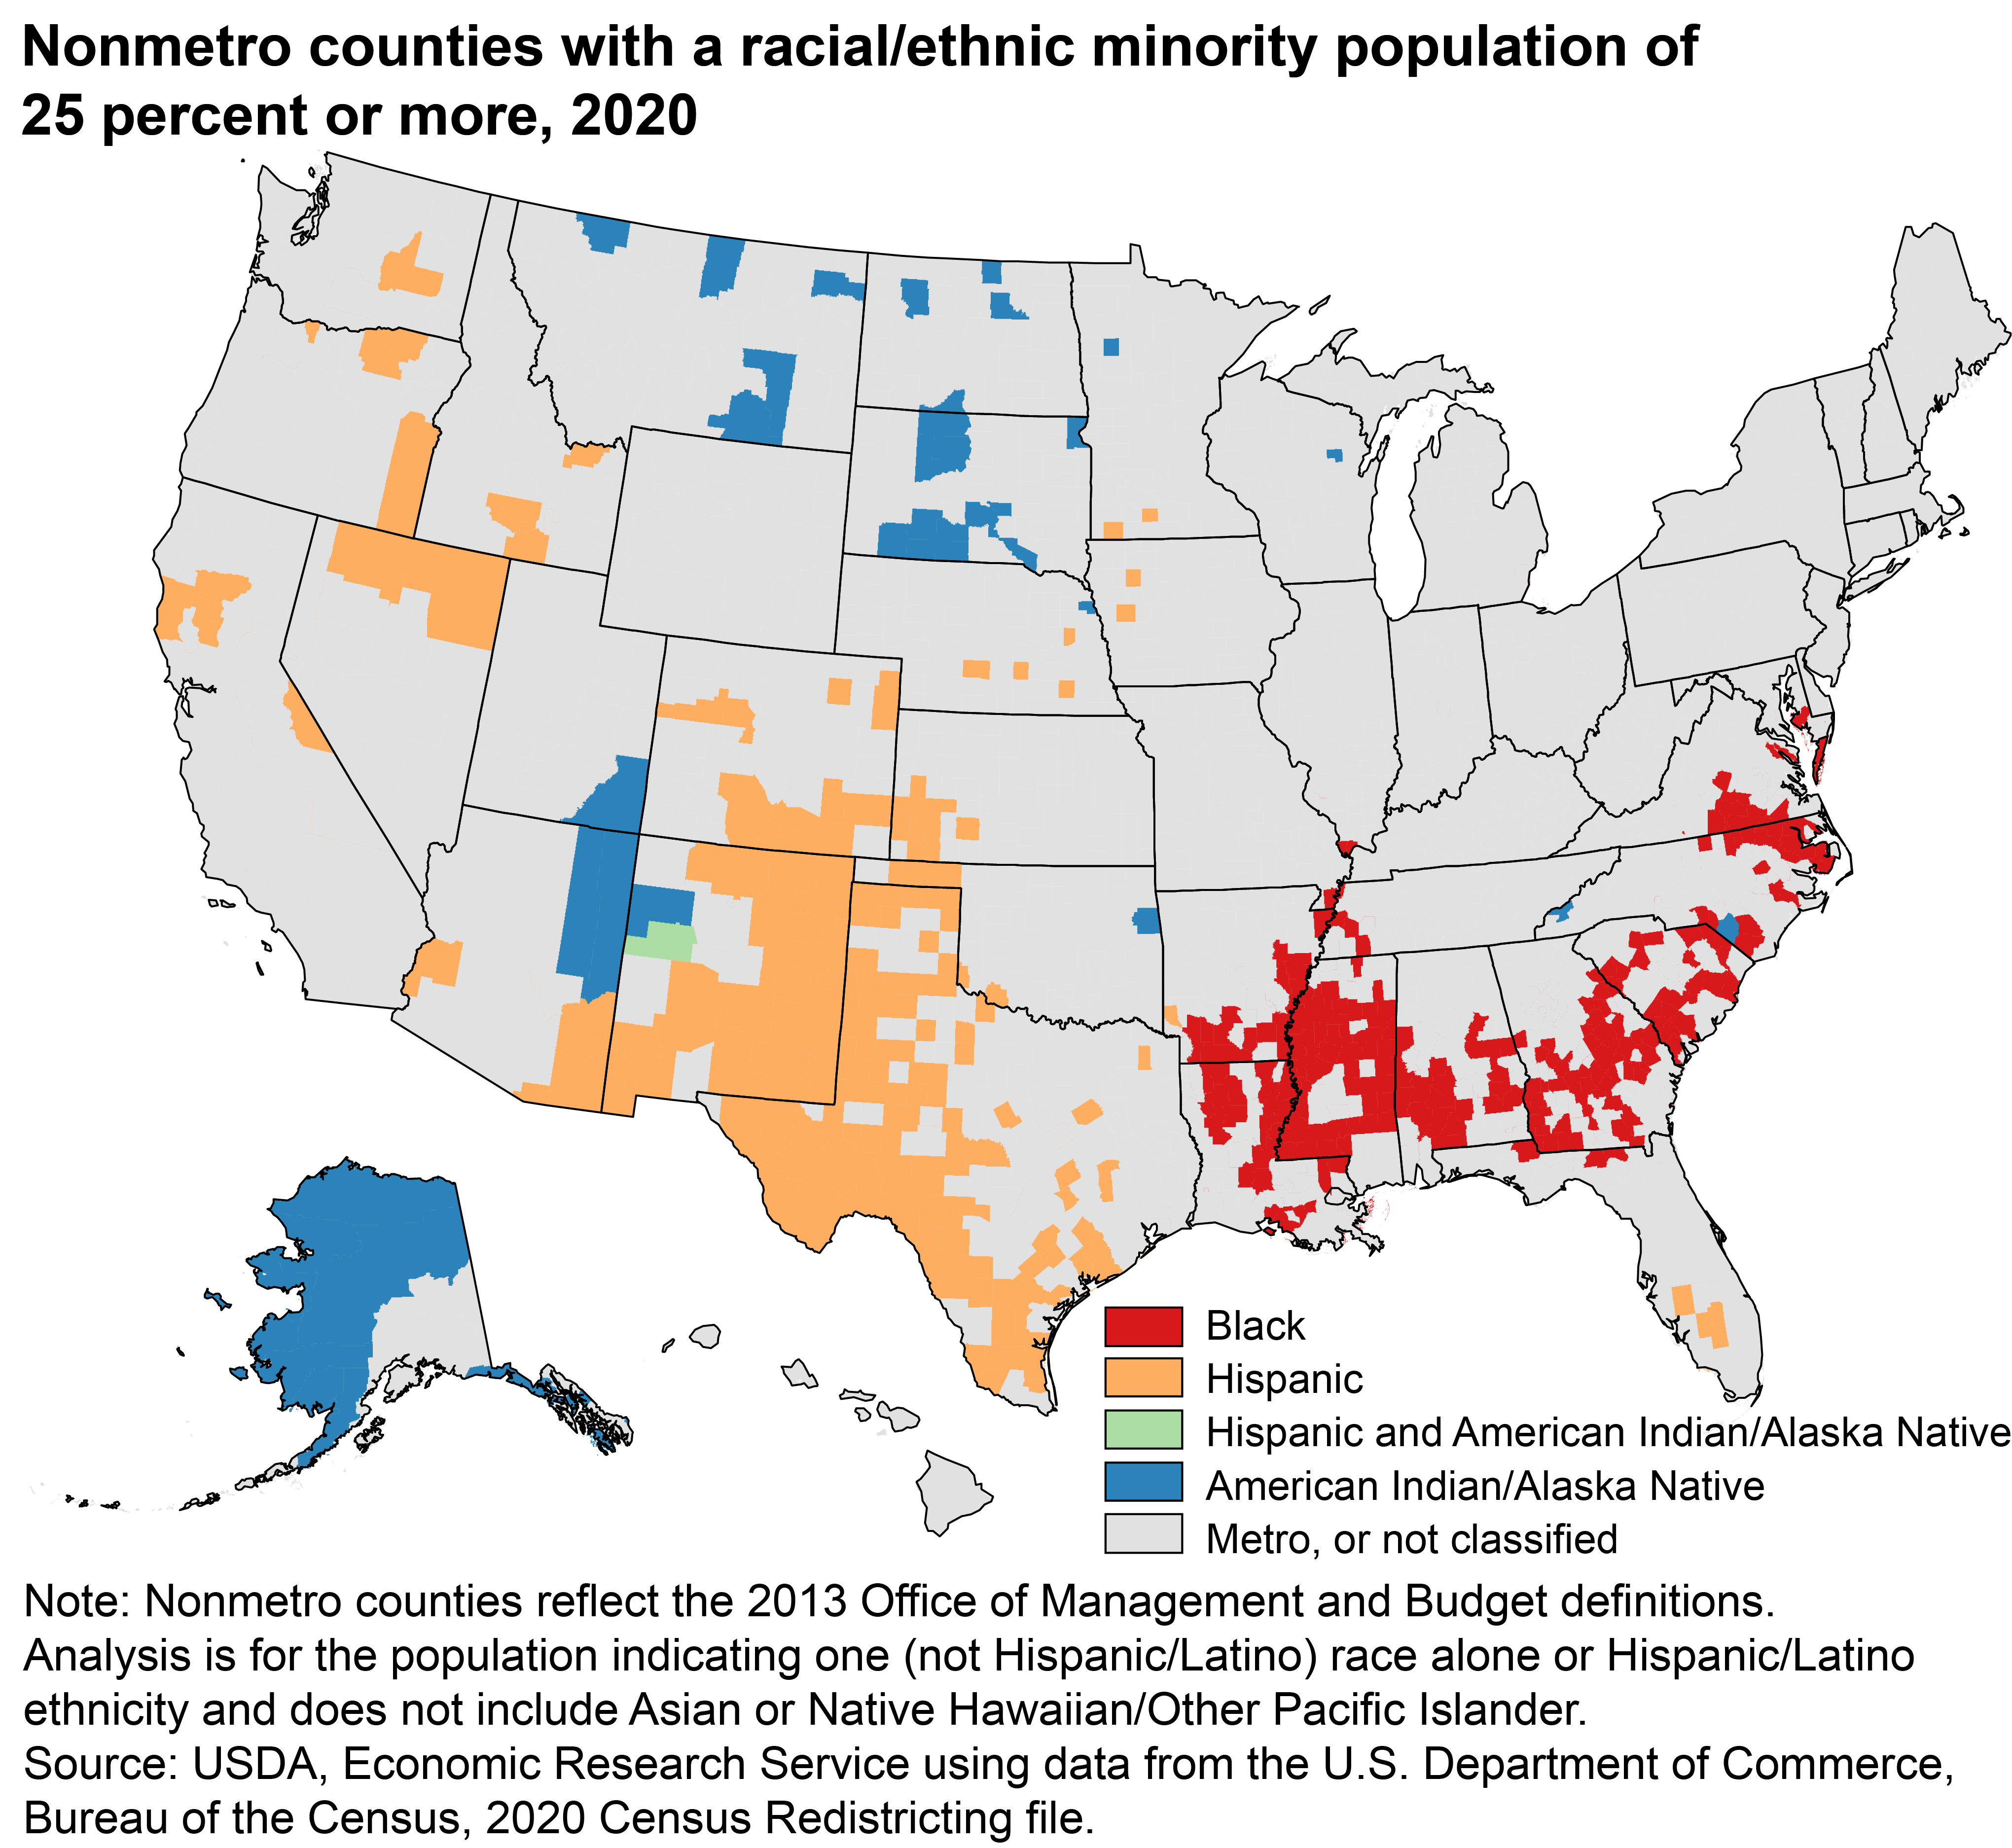
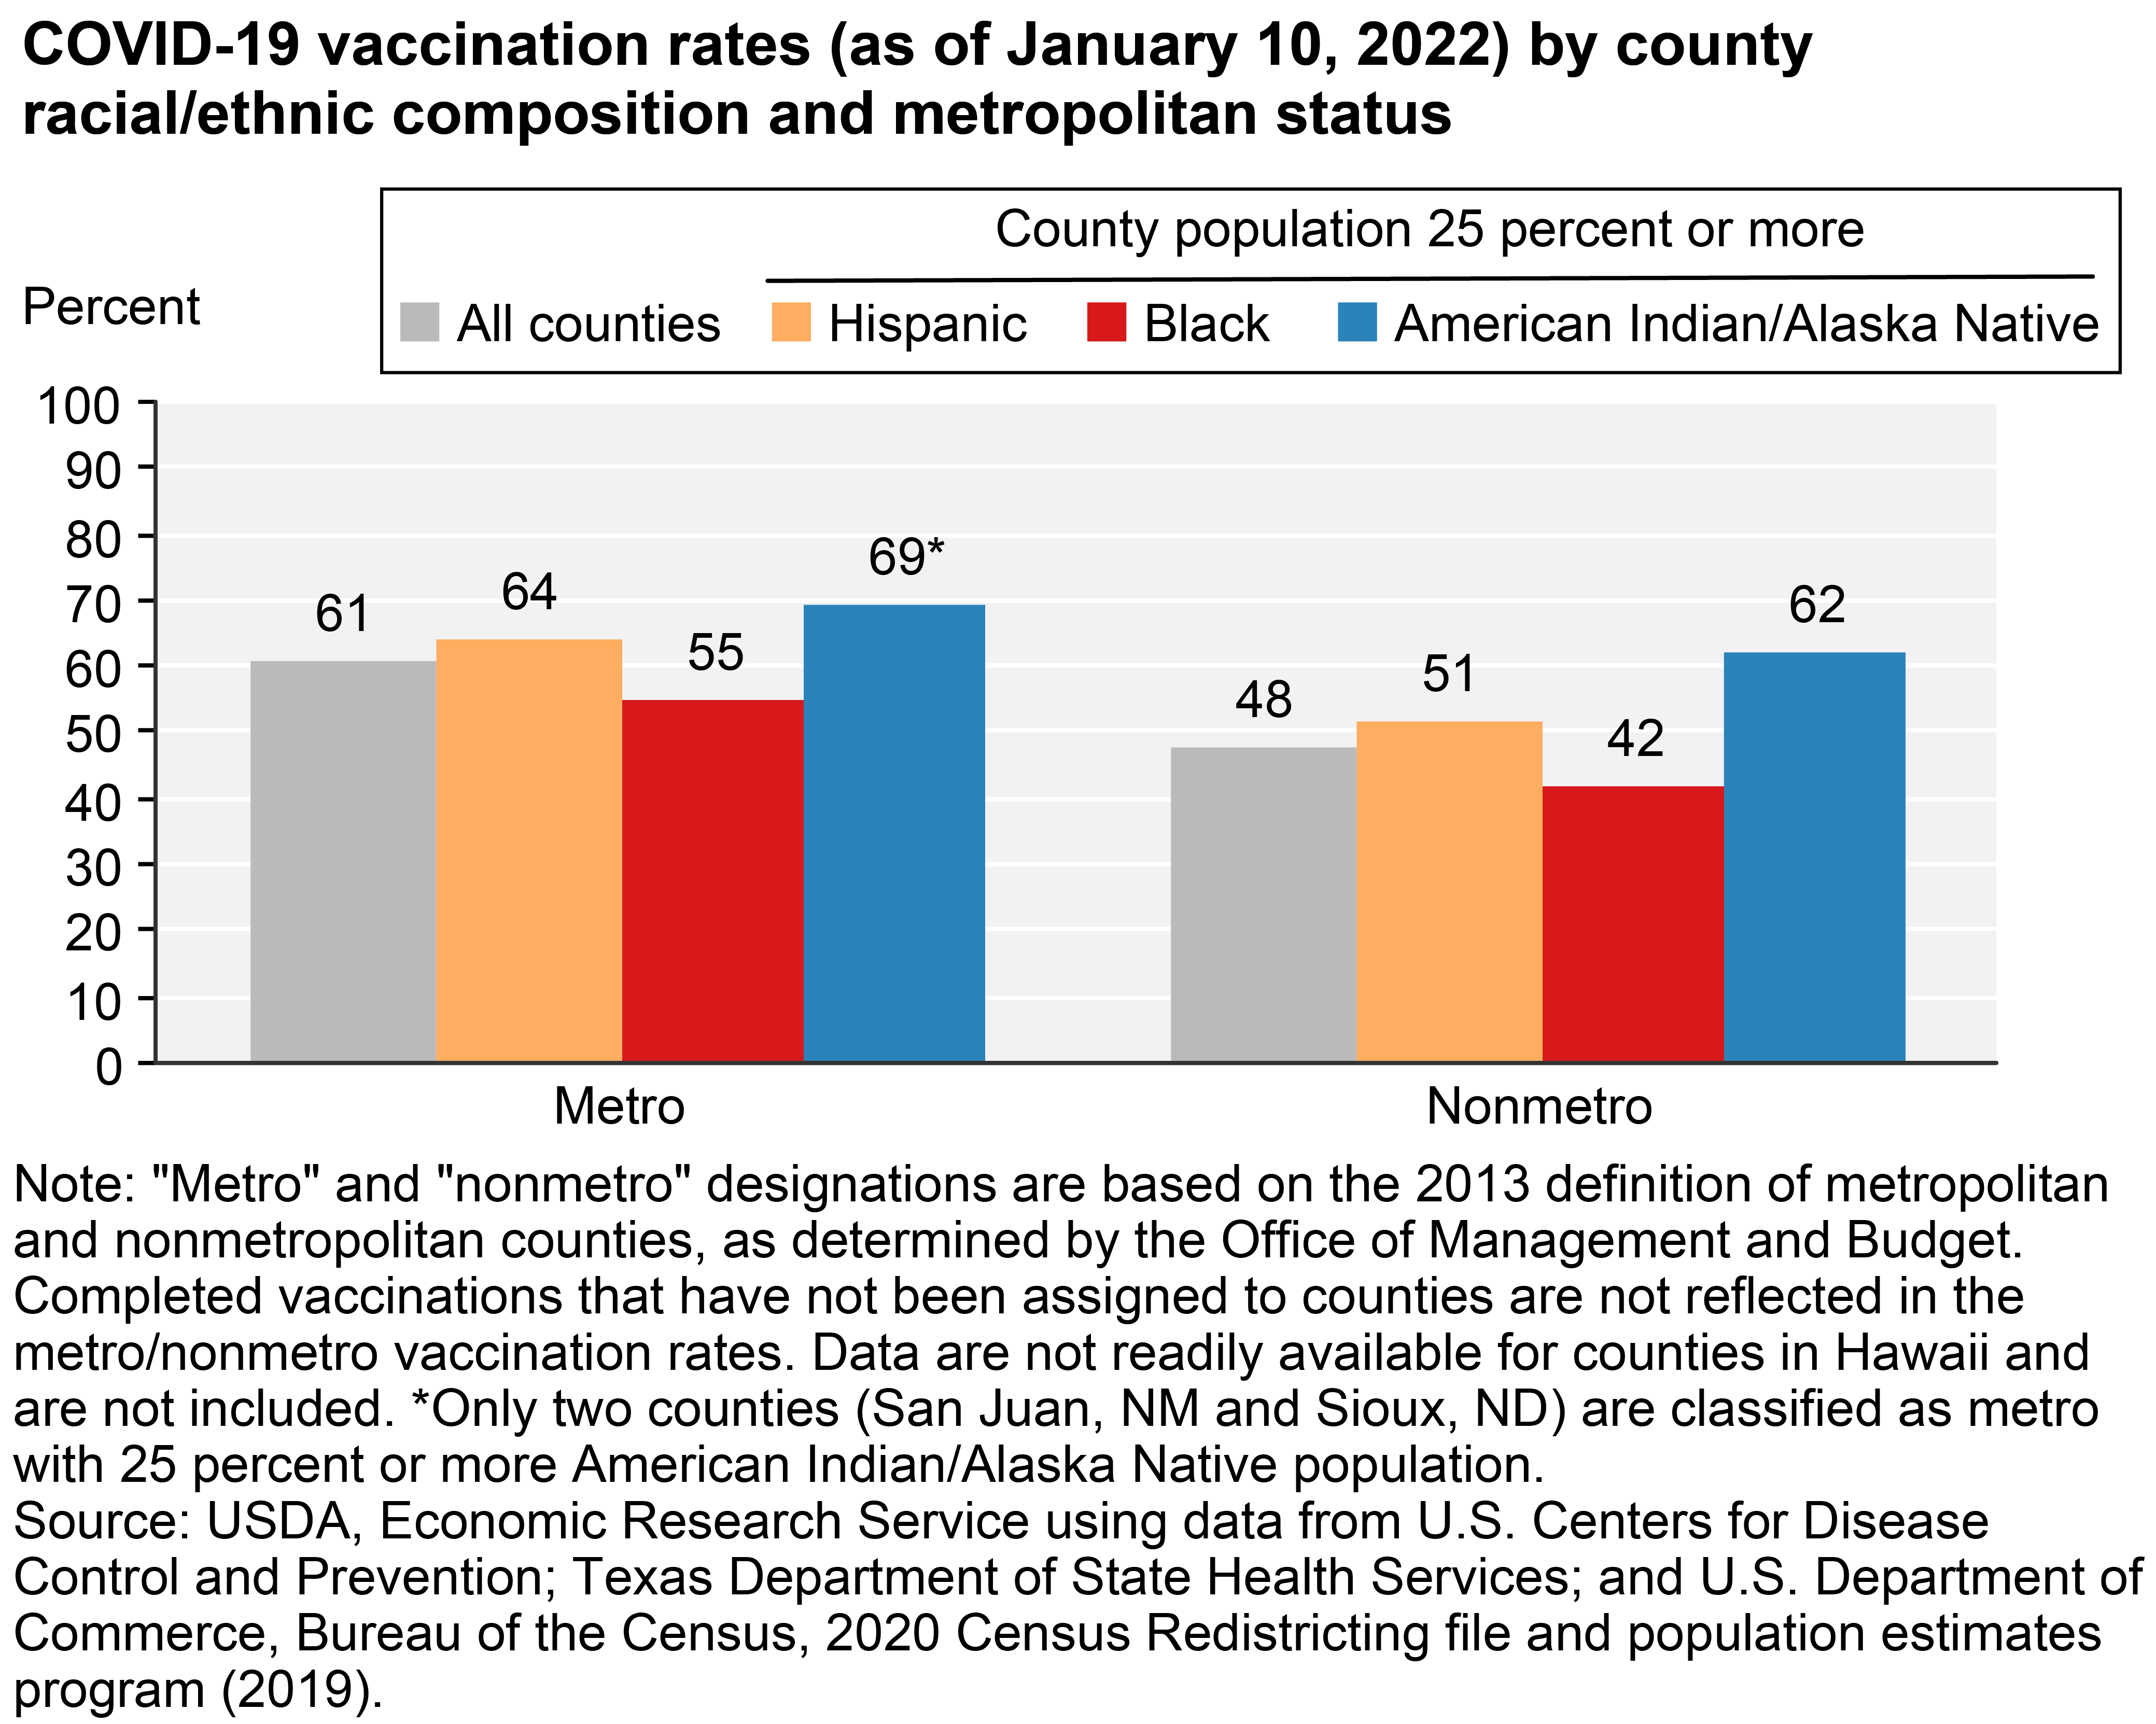
Nonmetro Counties with Large Black Populations are Located in Regions with Lower Vaccination Rates; Counties with Large American Indian/Alaska Native Populations Tend to Have Higher Vaccination Rates
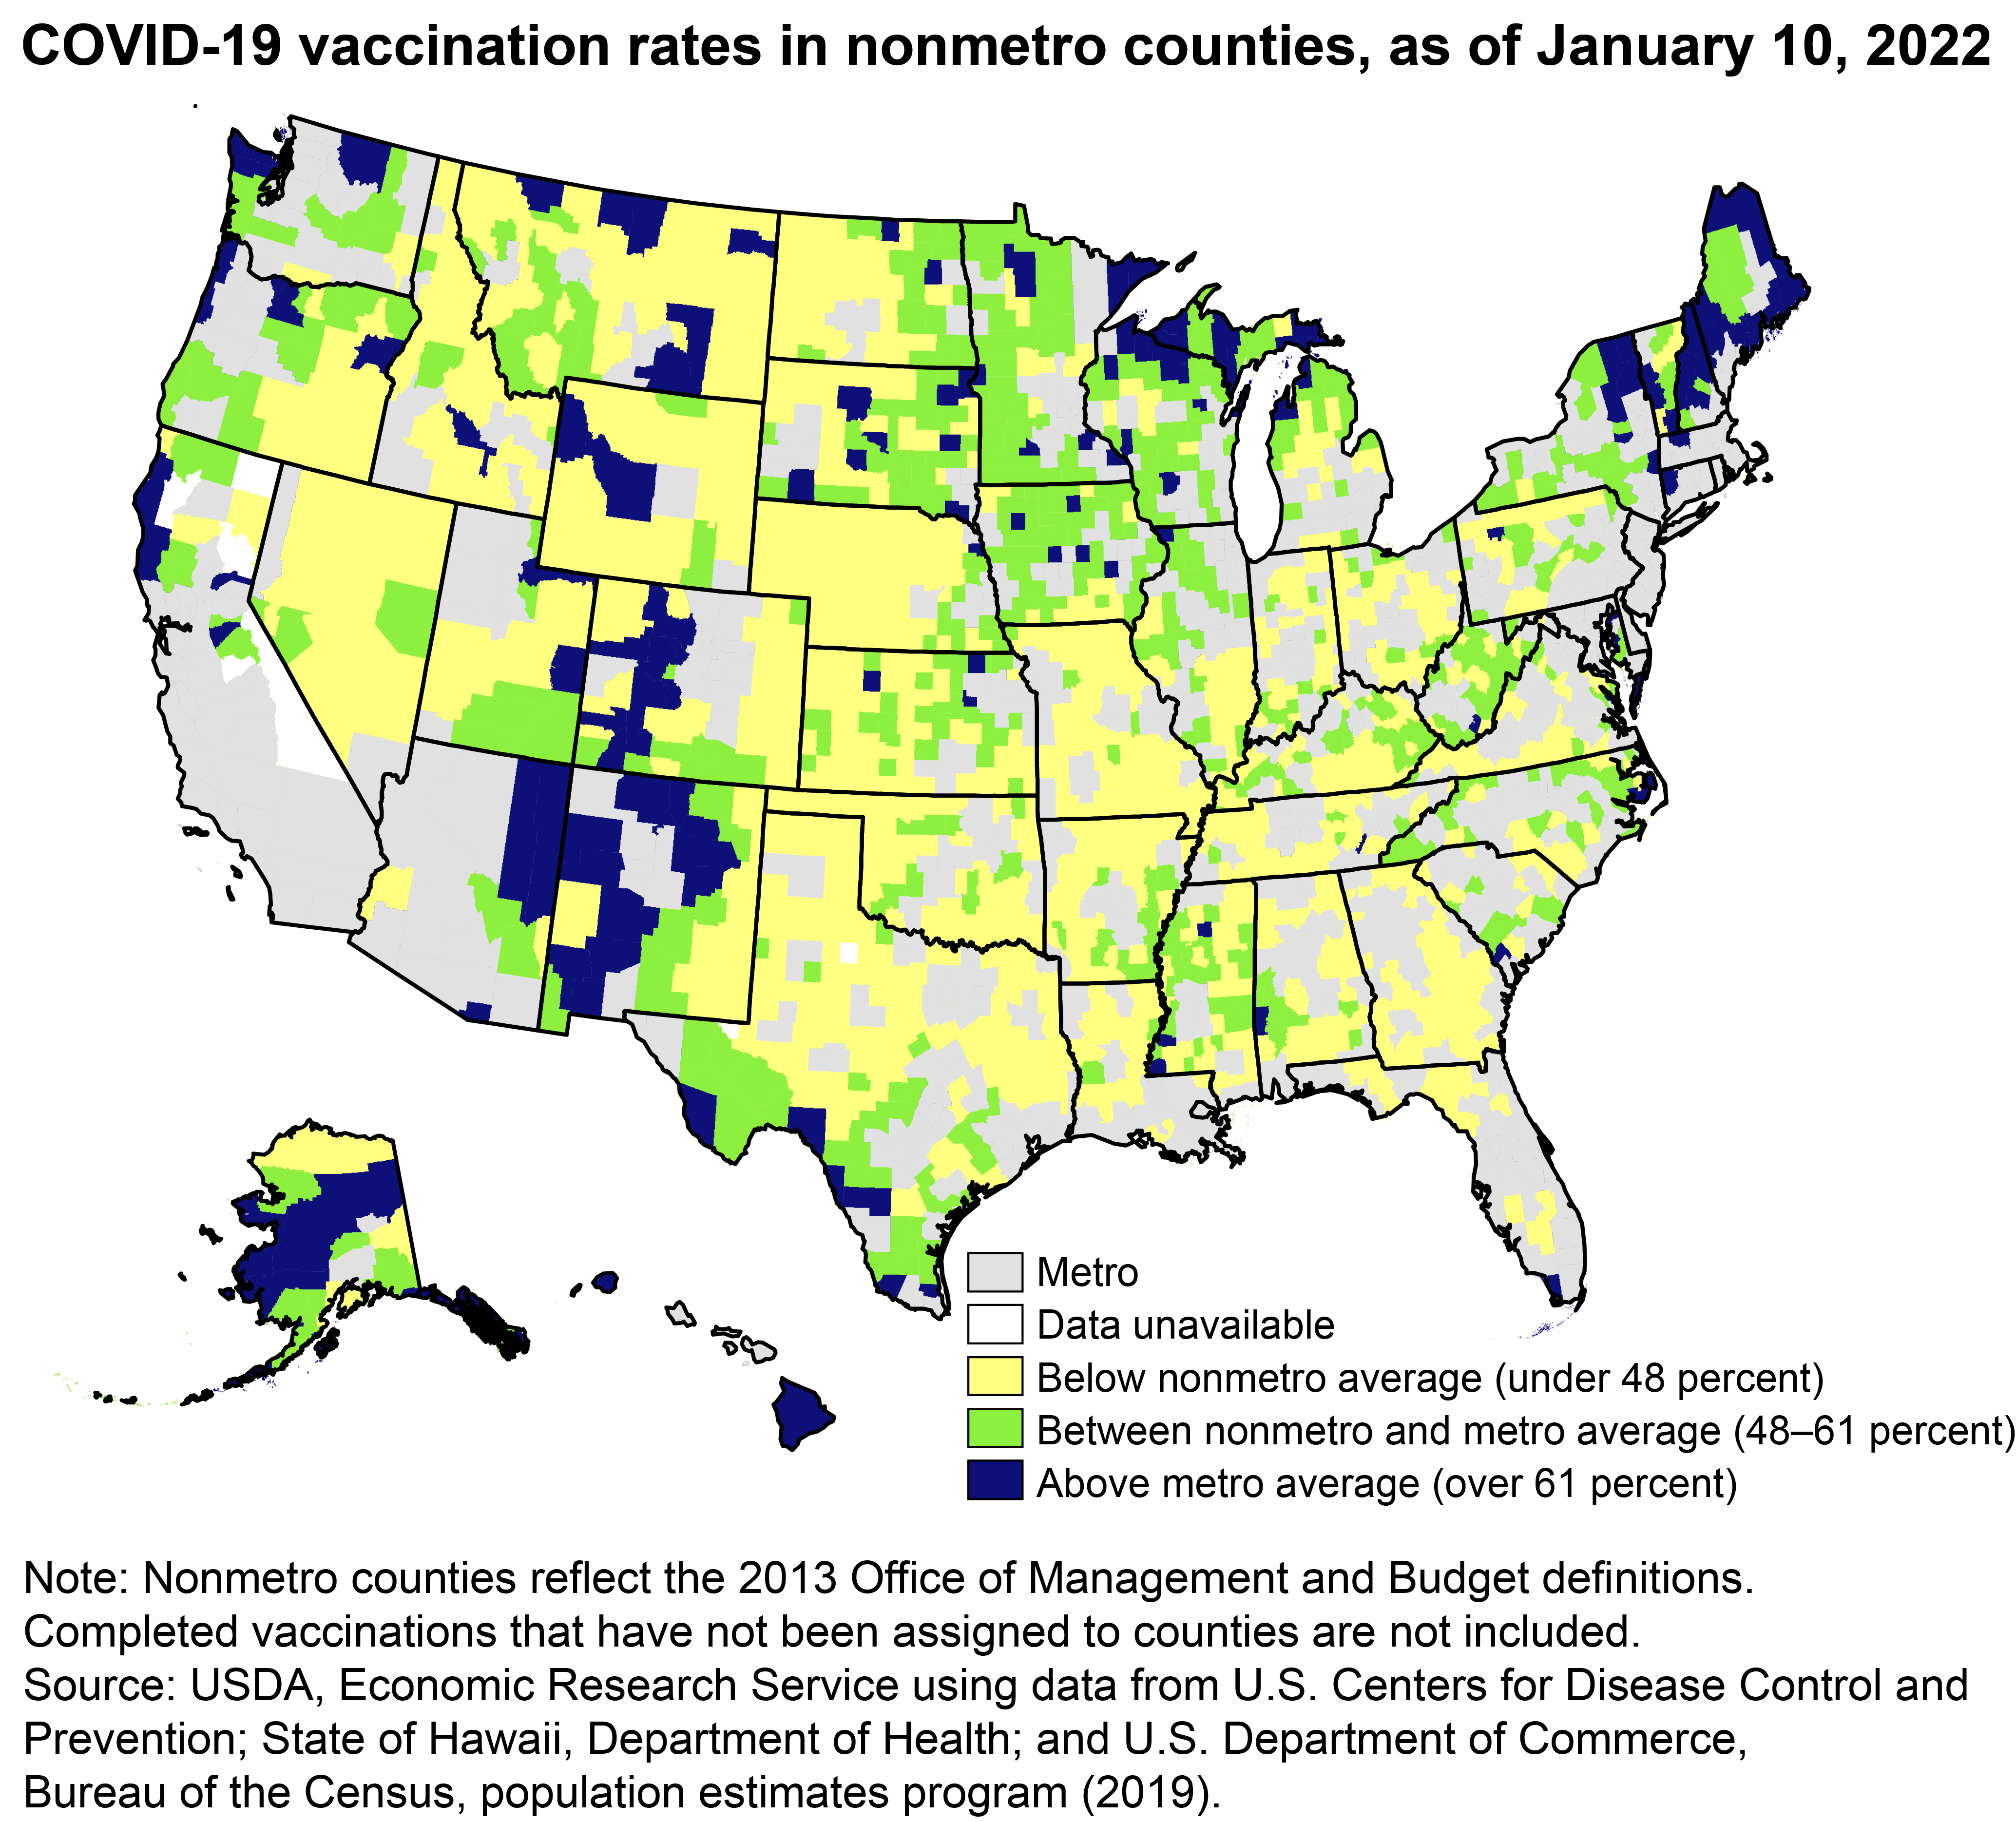
While nonmetro counties have a lower overall vaccination rate than metro counties, there are substantial regional variations. Many nonmetro counties in the Northeast, the northern Midwest, and the West have vaccination rates above the national nonmetro rate of 48 percent and the national metro rate of 61 percent. Meanwhile, a large proportion of counties in the South and the southern Midwest have vaccination rates below the national nonmetro rate, and nearly all are below the national metro rate.
Cumulative COVID-19 Mortality Rates by County Racial/Ethnic Composition Reflect Annual Natural-Cause Mortality Rates Before the Pandemic
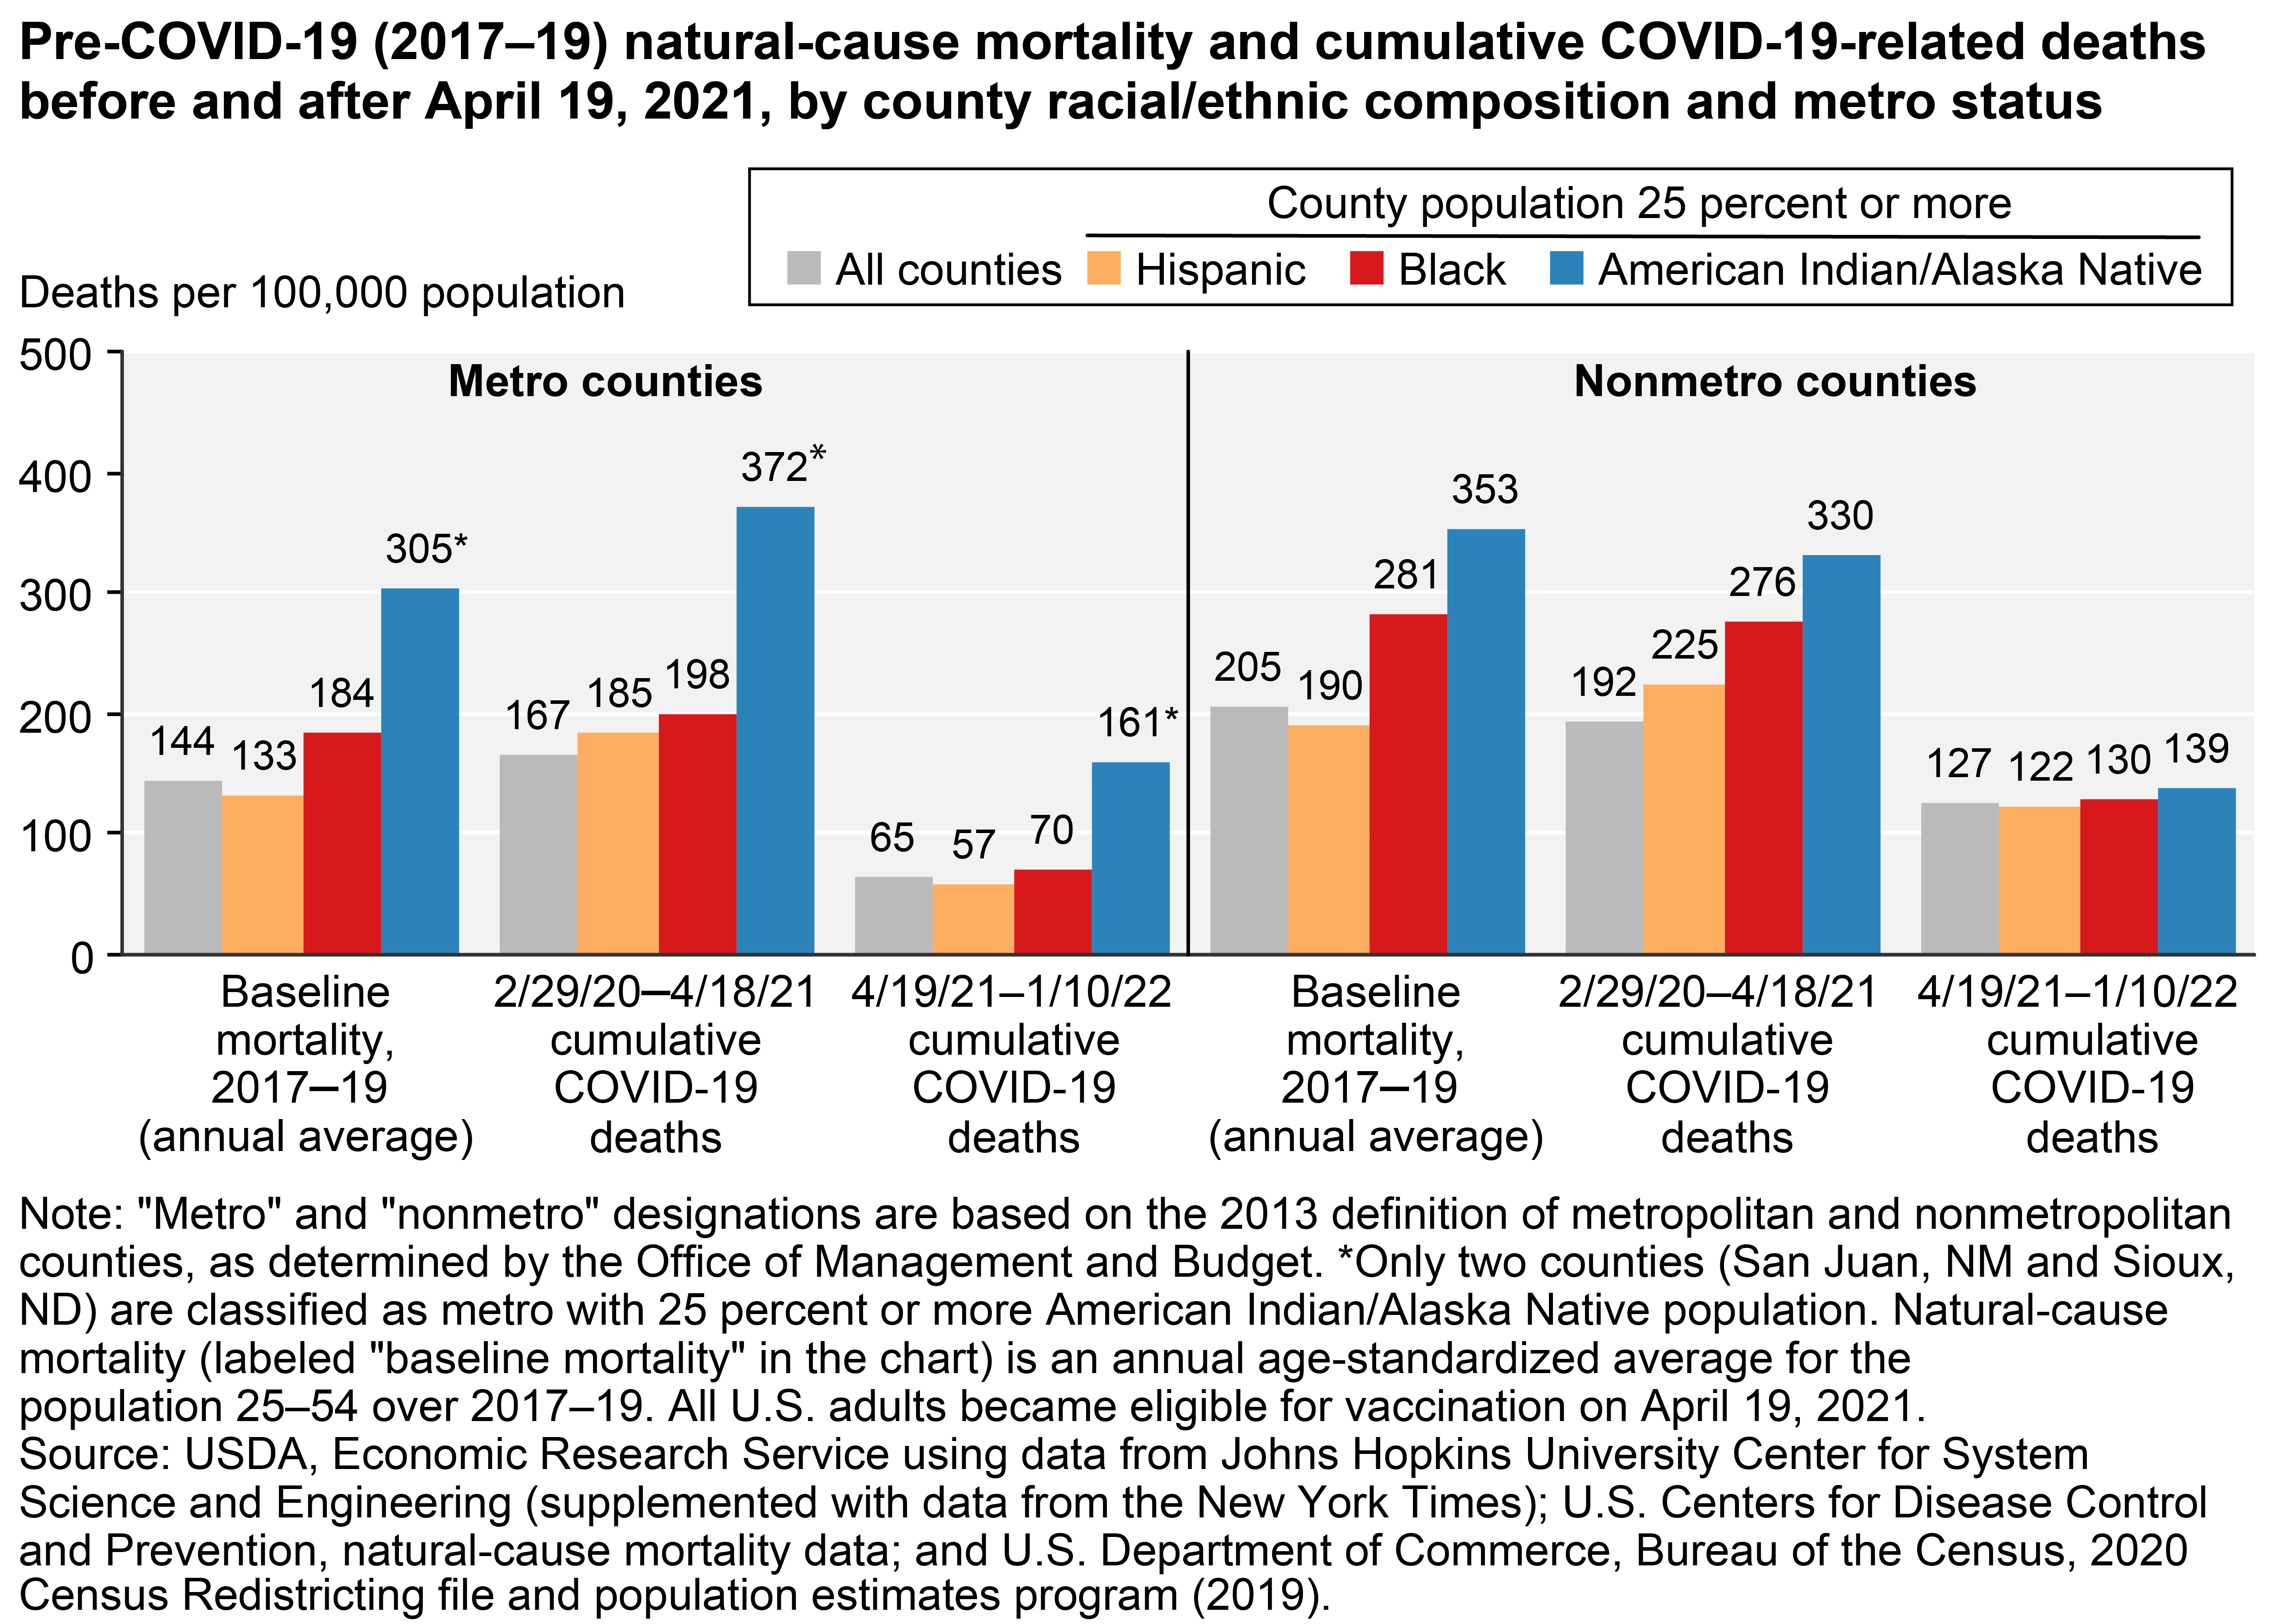
Before the vaccine was widely available, COVID-19 mortality rates largely followed the same patterns as midlife natural-cause mortality rates before the pandemic, i.e., COVID-19 mortality rates tended to be higher in nonmetro counties than in metro counties and were highest in counties with large American Indian/Alaska Native populations followed by counties with large Black populations. High midlife natural-cause mortality rates (i.e., overall mortality less deaths due to external causes, such as all types of accidents, including unexpected drug overdoses, suicide, and homicide) suggest that a population may be burdened by underlying health issues and related behaviors, such as obesity and substance abuse. Underlying health conditions may make COVID-19 infections more lethal, and many people with these conditions were prioritized for vaccination in early 2021.
Download chart image | Chart data
From April 19, 2021 to January 10, 2022, differences in cumulative COVID-19 mortality rates between all nonmetro counties and nonmetro counties with large Black, Hispanic, or American Indian/Alaska Native populations nearly disappeared and no longer strongly reflected midlife natural-cause mortality rates before COVID-19. However, at 127 deaths per 100,000 population, the nonmetro COVID-19 mortality rate was nearly twice the rate of metro counties at 65 deaths per 100,000 population. Vaccination rates in all metro counties, metro counties with large Black populations, and metro counties with large Hispanic populations were all 13 percent higher than in their nonmetro counterparts by January 10, 2022. The time since April 19, 2021 was also characterized by the spread of two different variants of the Coronavirus: the Delta variant, which had a larger impact on nonmetro counties and counties in the South in the late summer and early autumn of 2021, and the Omicron variant, which first impacted the Northeast in November 2021 and rapidly diffused throughout the United States through January 10, 2022. Differences in vaccination rates between county types as well as differences in the timing, location, and severity of new waves of COVID-19 may help explain why cumulative COVID-19 mortality rates by county type from April 19, 2021 to January 10, 2022 reflected little of the pre-COVID-19 natural-cause mortality rates.
Download chart image | Chart data