Note: Updates to this page are discontinued. The material—last updated on July 12, 2021—remains on the site for reference.
Recent county-level evidence on the prevalence of COVID-19 and local unemployment and employment rates, while no means a complete picture, provides indication of the spread of the virus and ensuing economic recession across the United States (see the note on data sources). The analysis of COVID-19 prevalence presented below focuses on cumulative COVID-19 case rates and not on recent or active cases.
Spread of the Pandemic to Rural America
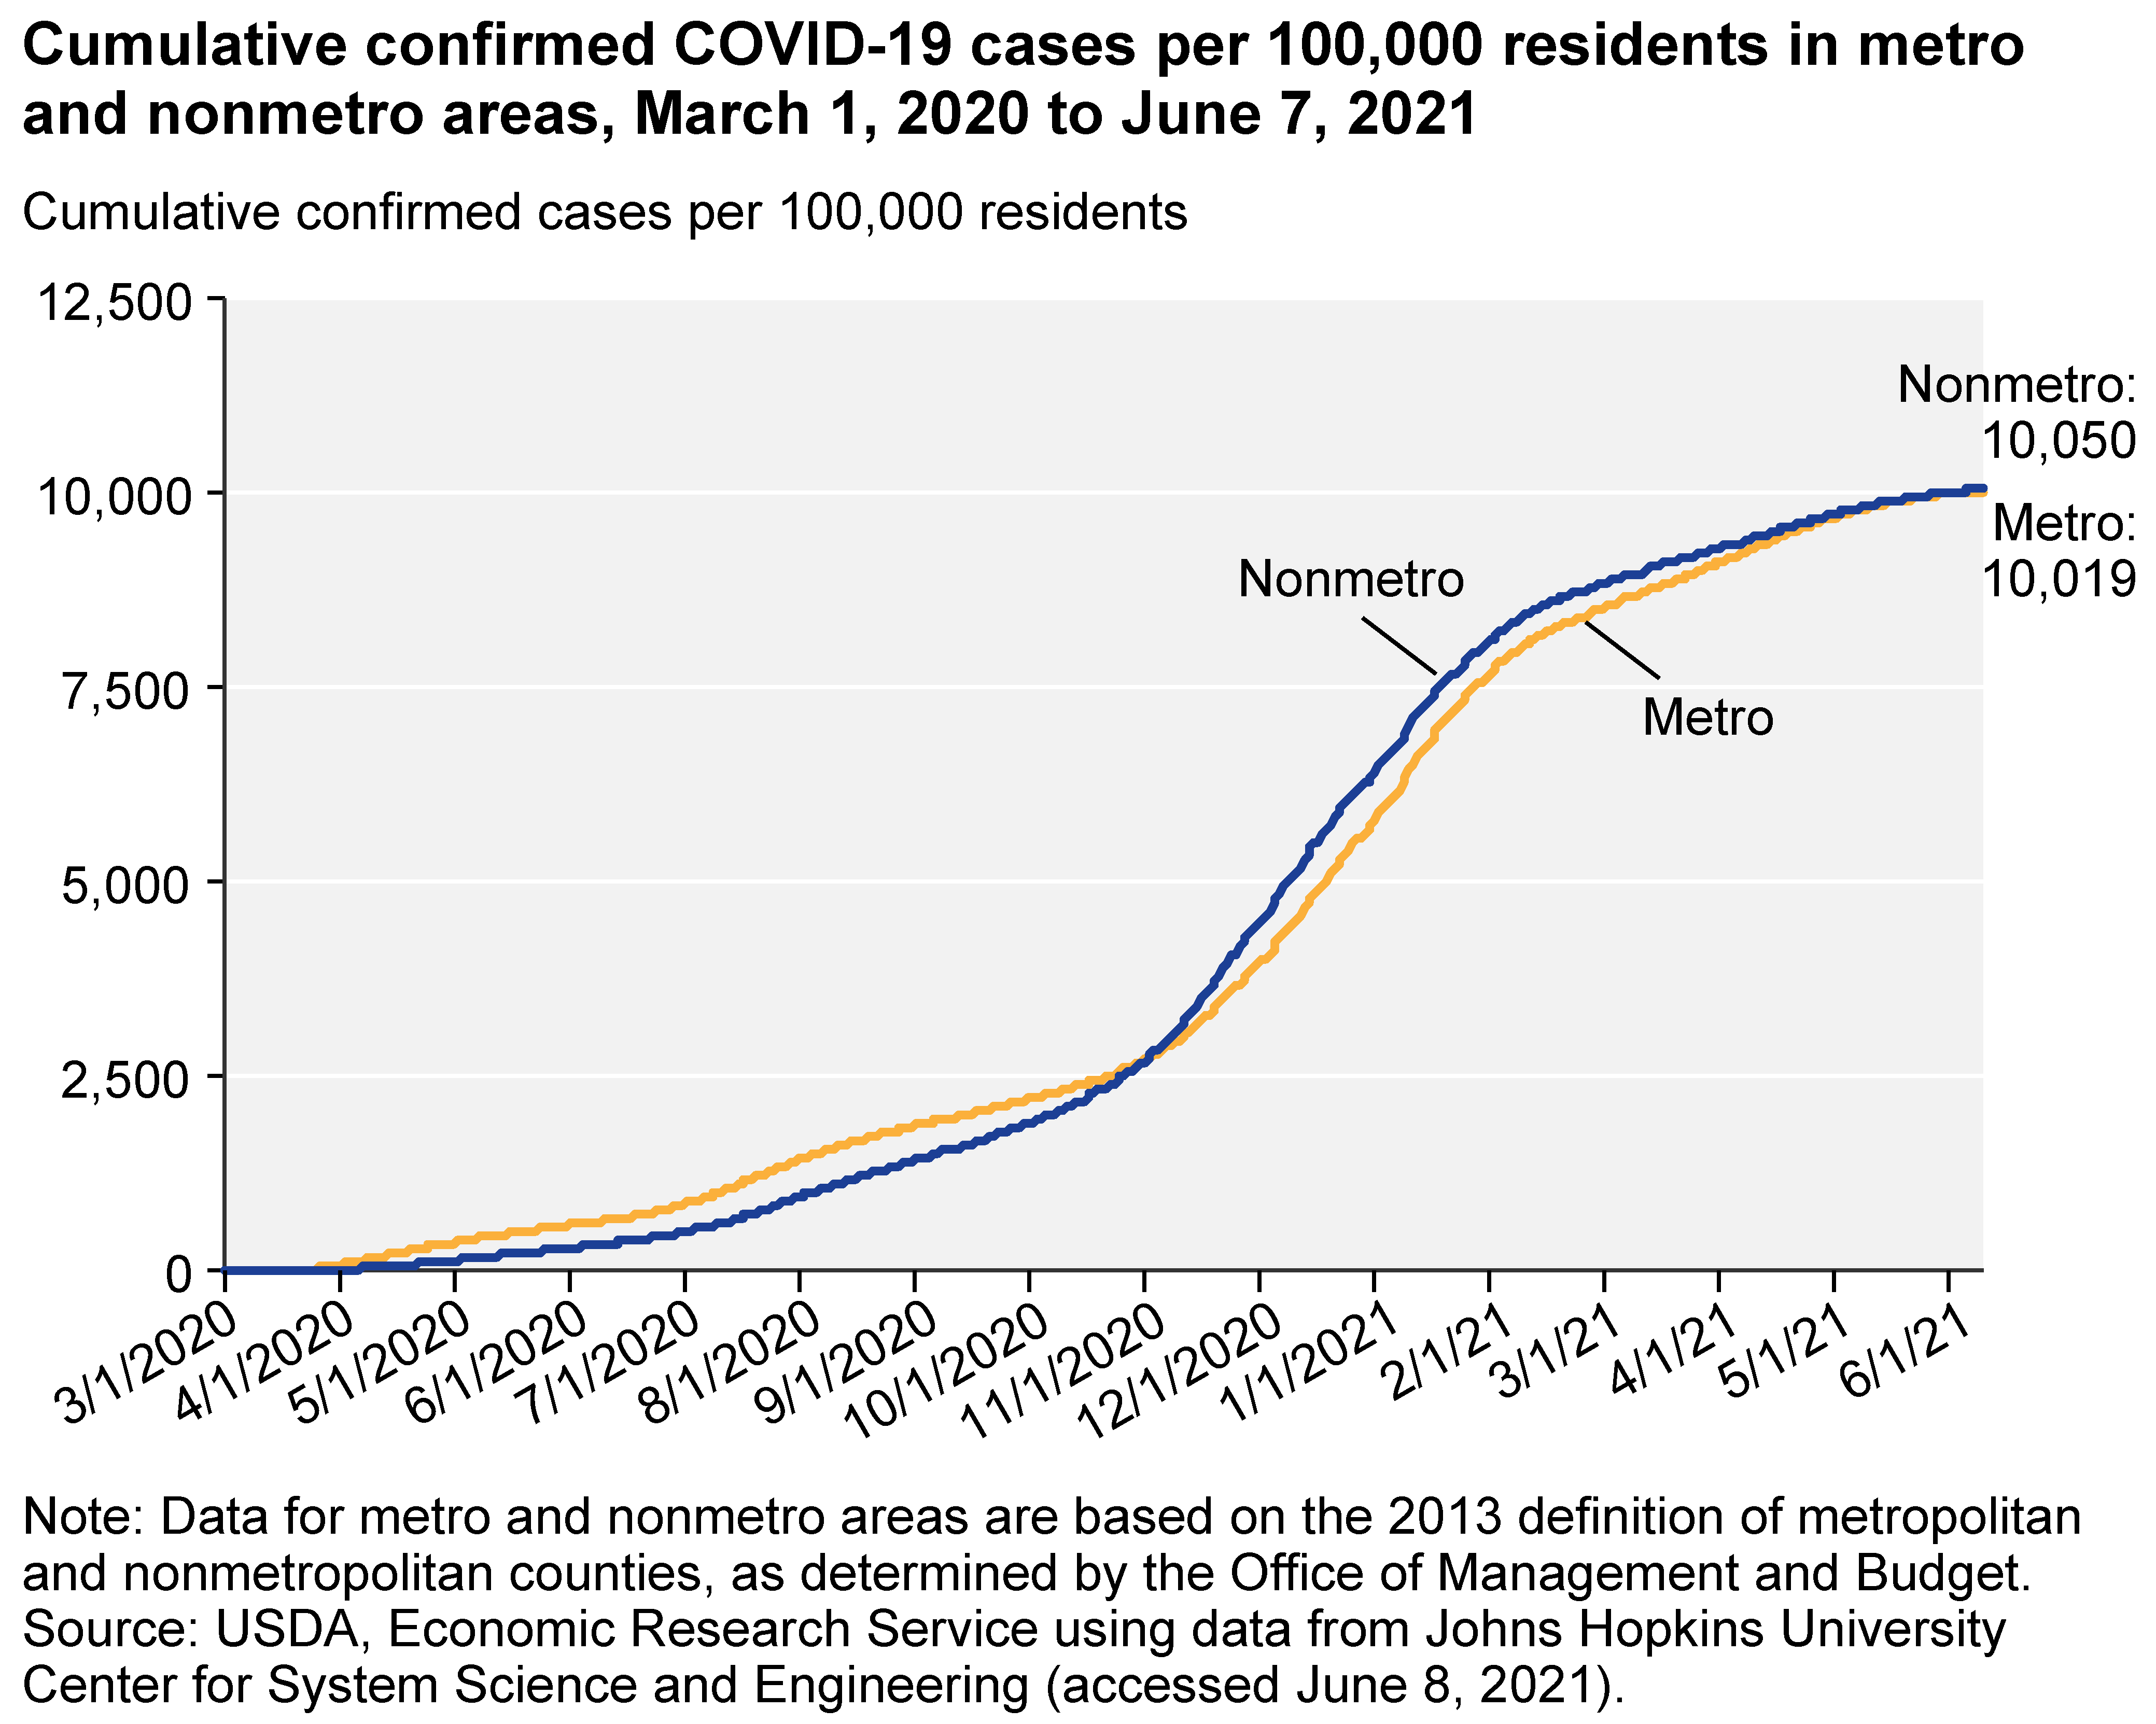
COVID-19 has spread to nearly every nation in the world, and to every State and inhabited county in the United States. The virus initially spread most rapidly to large metro areas, and most confirmed cases have been in metro areas with populations of at least 1 million. This is consistent with most of the U.S. population living in large metro areas. In per capita terms, the prevalence of cumulative COVID-19 cases was greater in metro than in nonmetro areas until late October 2020. Since then, the prevalence of cumulative COVID-19 cases has been greater in nonmetro areas, although beginning in April 2021, the prevalence of cumulative COVID-19 cases has been very similar in metro and nonmetro areas. The rate of increase of cumulative COVID-19 cases peaked in early January 2021 and has since declined in both metro and nonmetro areas.
Download chart image | Chart data
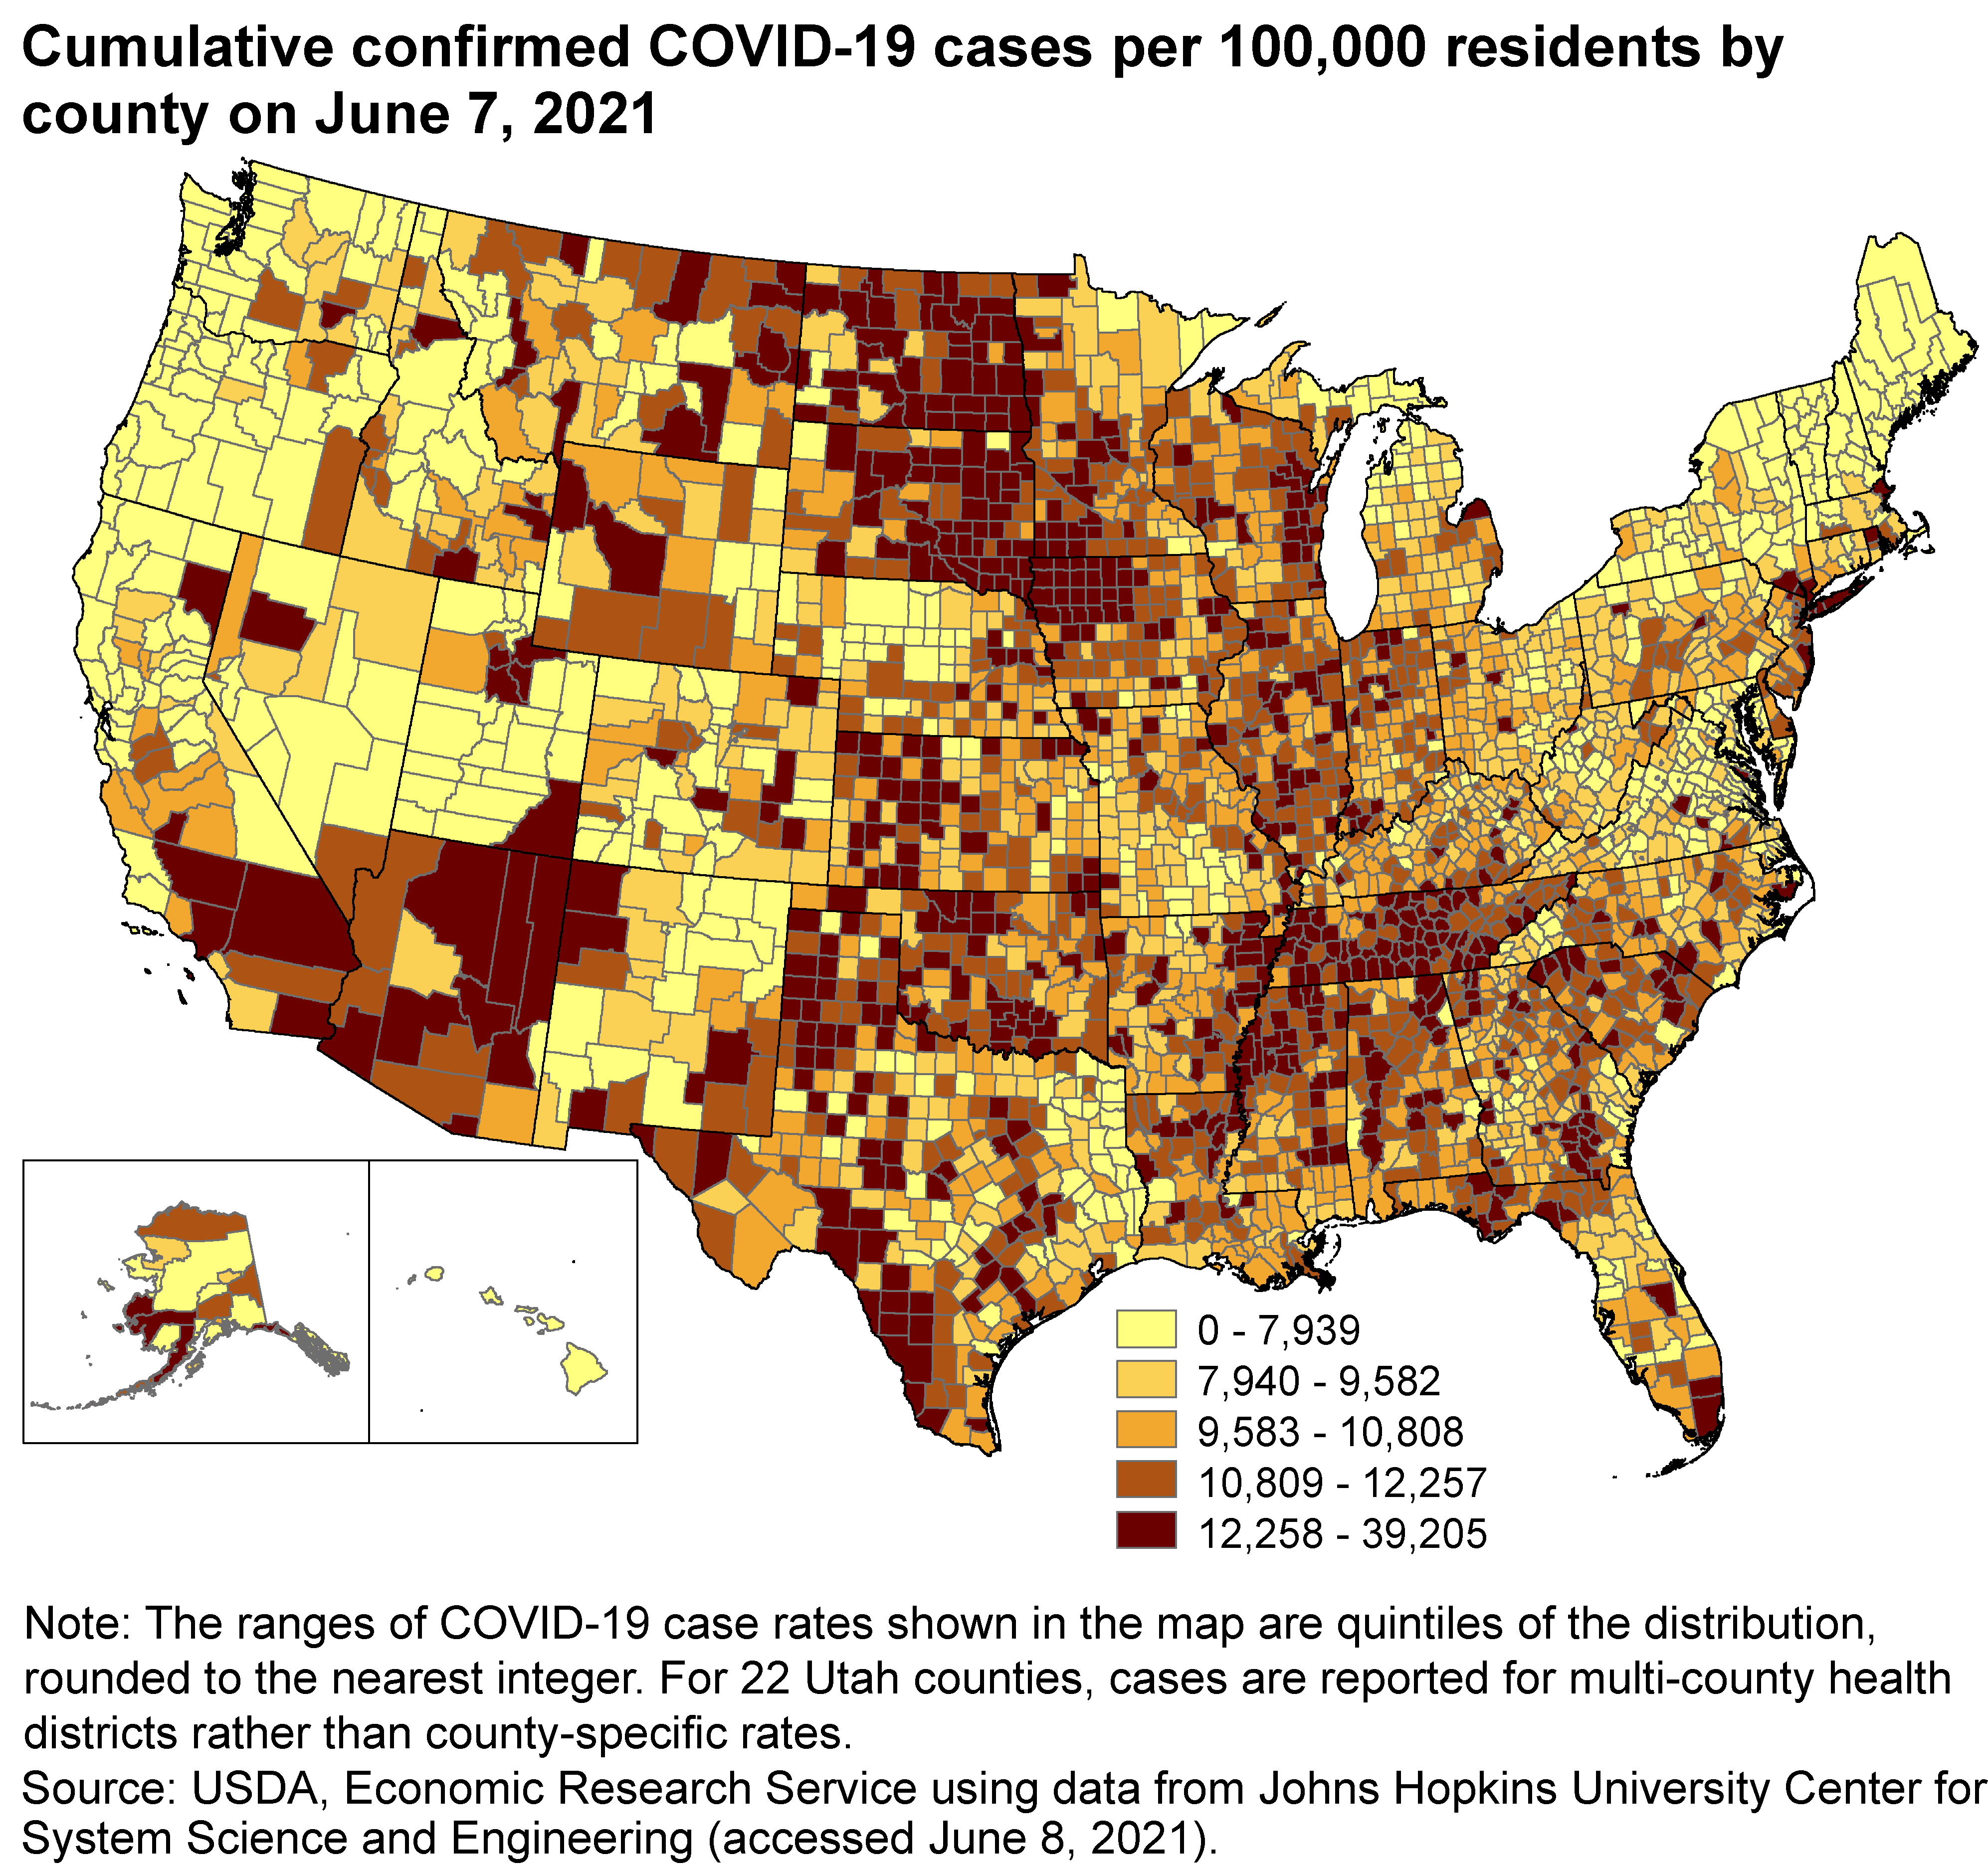
By June 7, 2021, the regions with the highest prevalence of cumulative COVID-19 cases included much of the Midwest and South regions and parts of the Mountain region of the western United States. (The names of regions referenced in this paragraph are based on the Census Regions and Divisions of the United States.) Less affected areas include most of the Northeast and Pacific regions—though many exceptions are evident in these regions.
Higher COVID-19 case rates have been observed in certain minority populations, including Hispanics/Latinos and American Indian/Alaska Natives, according to data published by the Centers for Disease Control and Prevention (CDC).
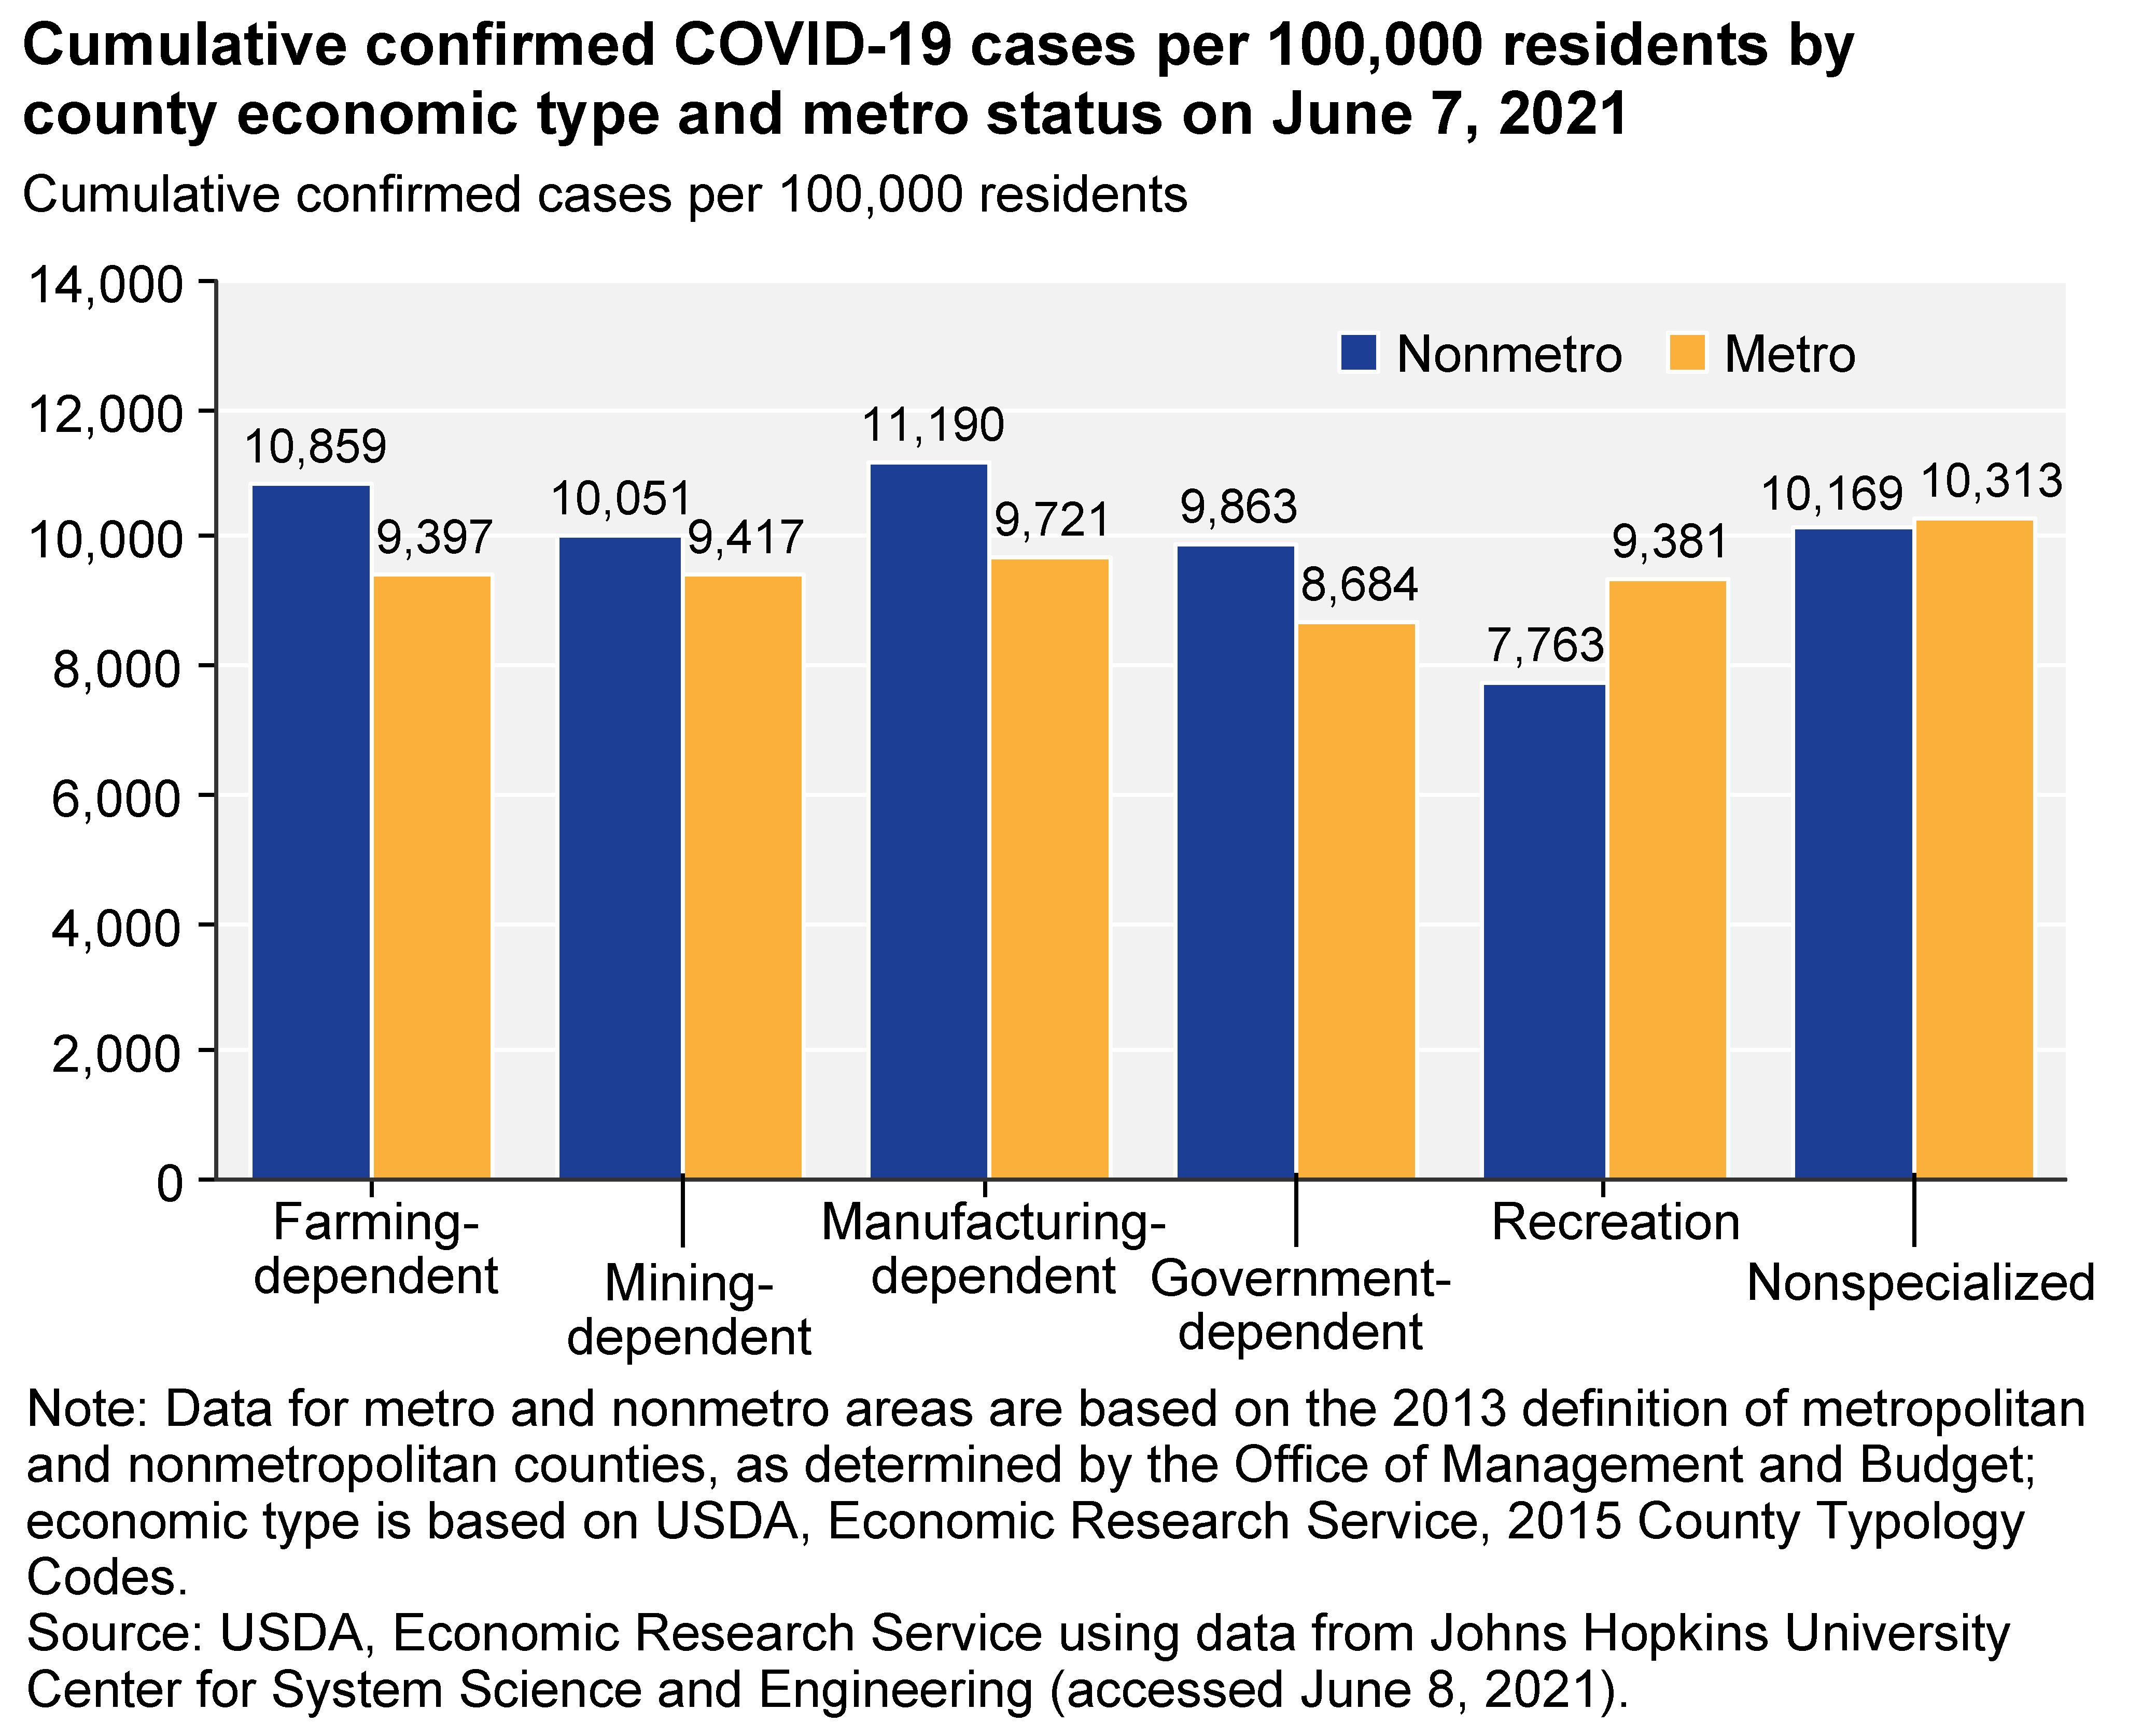
Higher COVID-19 prevalence is also associated with some industries, particularly in nonmetro counties. The Economic Research Service (ERS) classifies counties by economic type, based primarily on the dependence of employment and earnings on specific types of industries. Among nonmetro counties, the highest cumulative COVID-19 case rates are found in manufacturing-dependent and farming-dependent counties. The higher prevalence of COVID-19 in nonmetro manufacturing-dependent counties is due partly to higher cumulative COVID-19 case rates in meatpacking-dependent counties (those in which 20 percent or more of employment is in the meatpacking industry), almost all of which are manufacturing-dependent counties. However, even excluding meatpacking-dependent counties, COVID-19 case rates are highest in nonmetro manufacturing-dependent counties. Nonmetro recreation counties have the lowest COVID-19 case rates.
Download chart image | Chart data
Unemployment and Employment During the Pandemic
After the pandemic started, U.S. unemployment surged to levels not seen since the Great Depression in the 1930s. In March 2020, the unemployment rate began to rise. Monthly unemployment estimates reported by the Bureau of Labor Statistics (BLS) refer to the week that includes the 12th day of each calendar month. By the week including April 12, 2020, U.S. unemployment peaked at a seasonally adjusted rate of 14.7 percent. This surge resulted from government restrictions on non-essential economic activity, social distancing requirements, temporary closures of some facilities due to infection concerns, effects of illness on availability of some essential workers, and voluntary decisions by consumers to limit travel and other activities.
The unemployment rate began to decline after April as the Coronavirus Aid, Relief, and Economic Security (CARES) Act, other new Federal laws, and the Federal Reserve made trillions of dollars in funds available as part of efforts to address the recession. Additionally, States relaxed restrictions put in place to control the pandemic. All these resulted in consumers starting to increase spending again. By the week of May 12, 2021, the national unemployment rate had fallen to 5.8 percent.
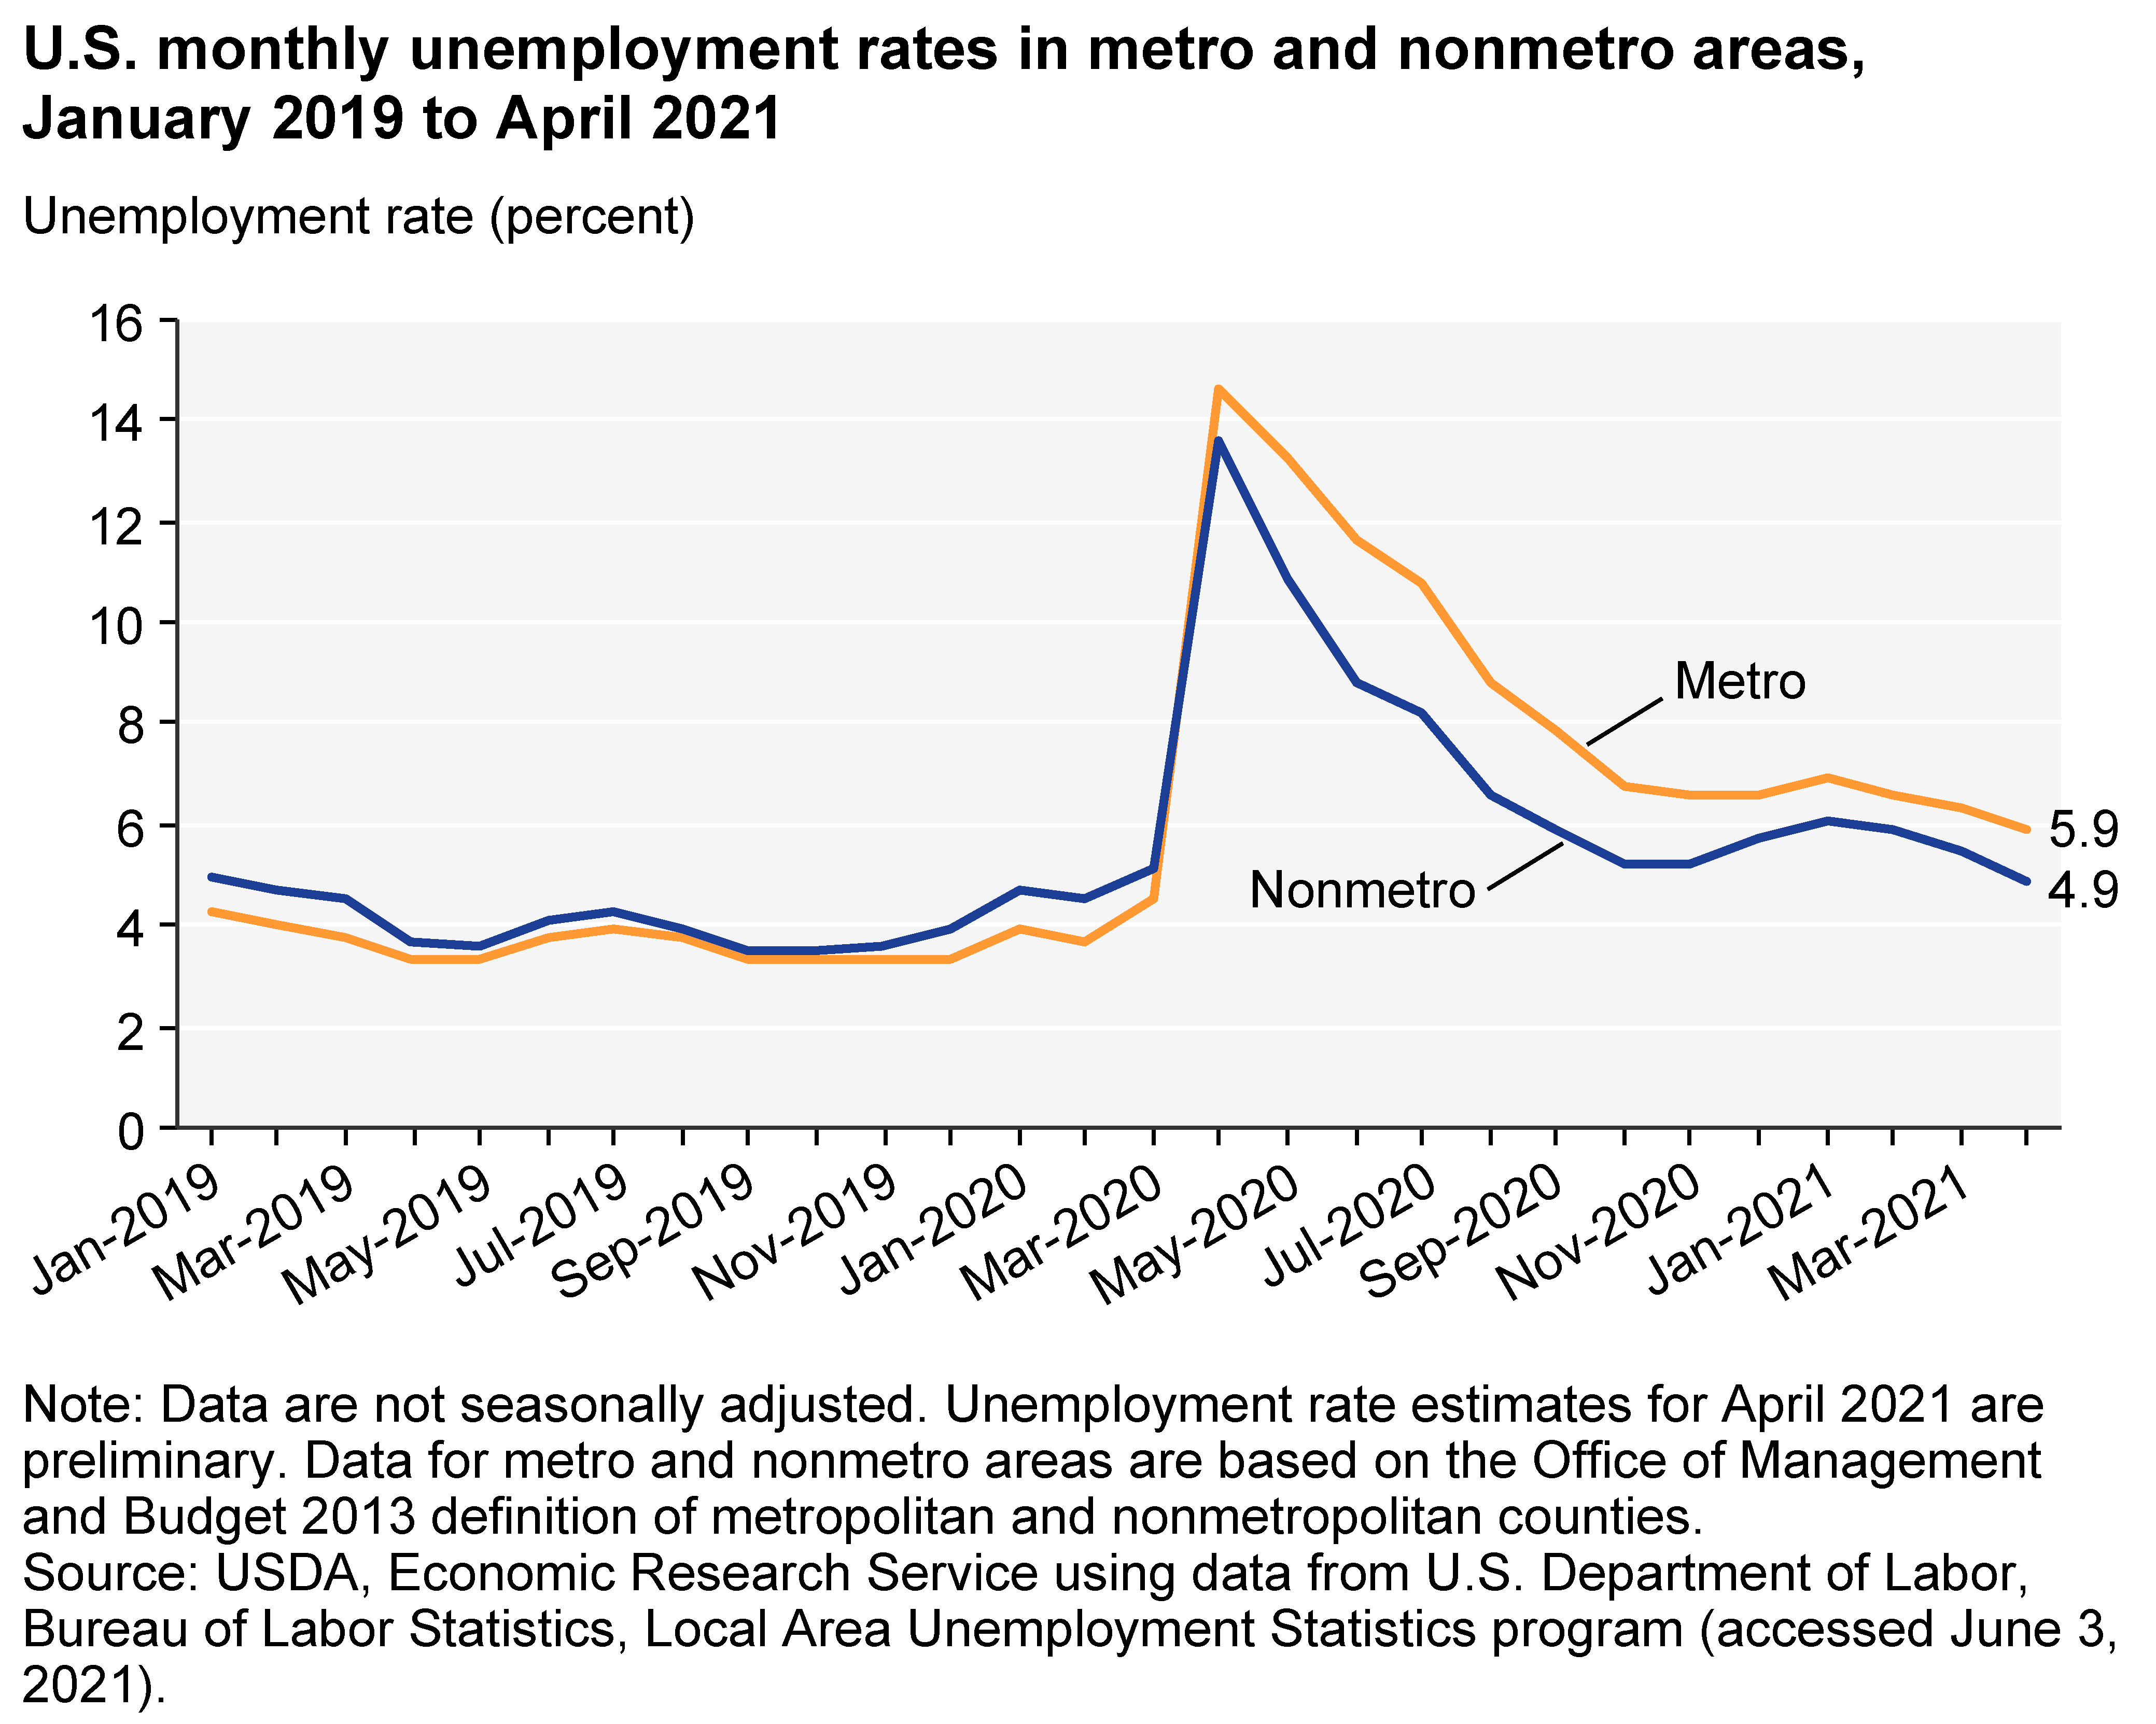
Based on BLS estimates of county-level employment and unemployment, the unemployment rate rose rapidly in both metro and nonmetro areas in March and April 2020. After April 2020, the unemployment rate declined in both metro and nonmetro areas. By April 2021, the unemployment rate had fallen to 5.9 percent in metro areas and 4.9 percent in nonmetro areas.
Note: The BLS county-level estimates of employment and unemployment are not seasonally adjusted.
Download chart image | Chart data
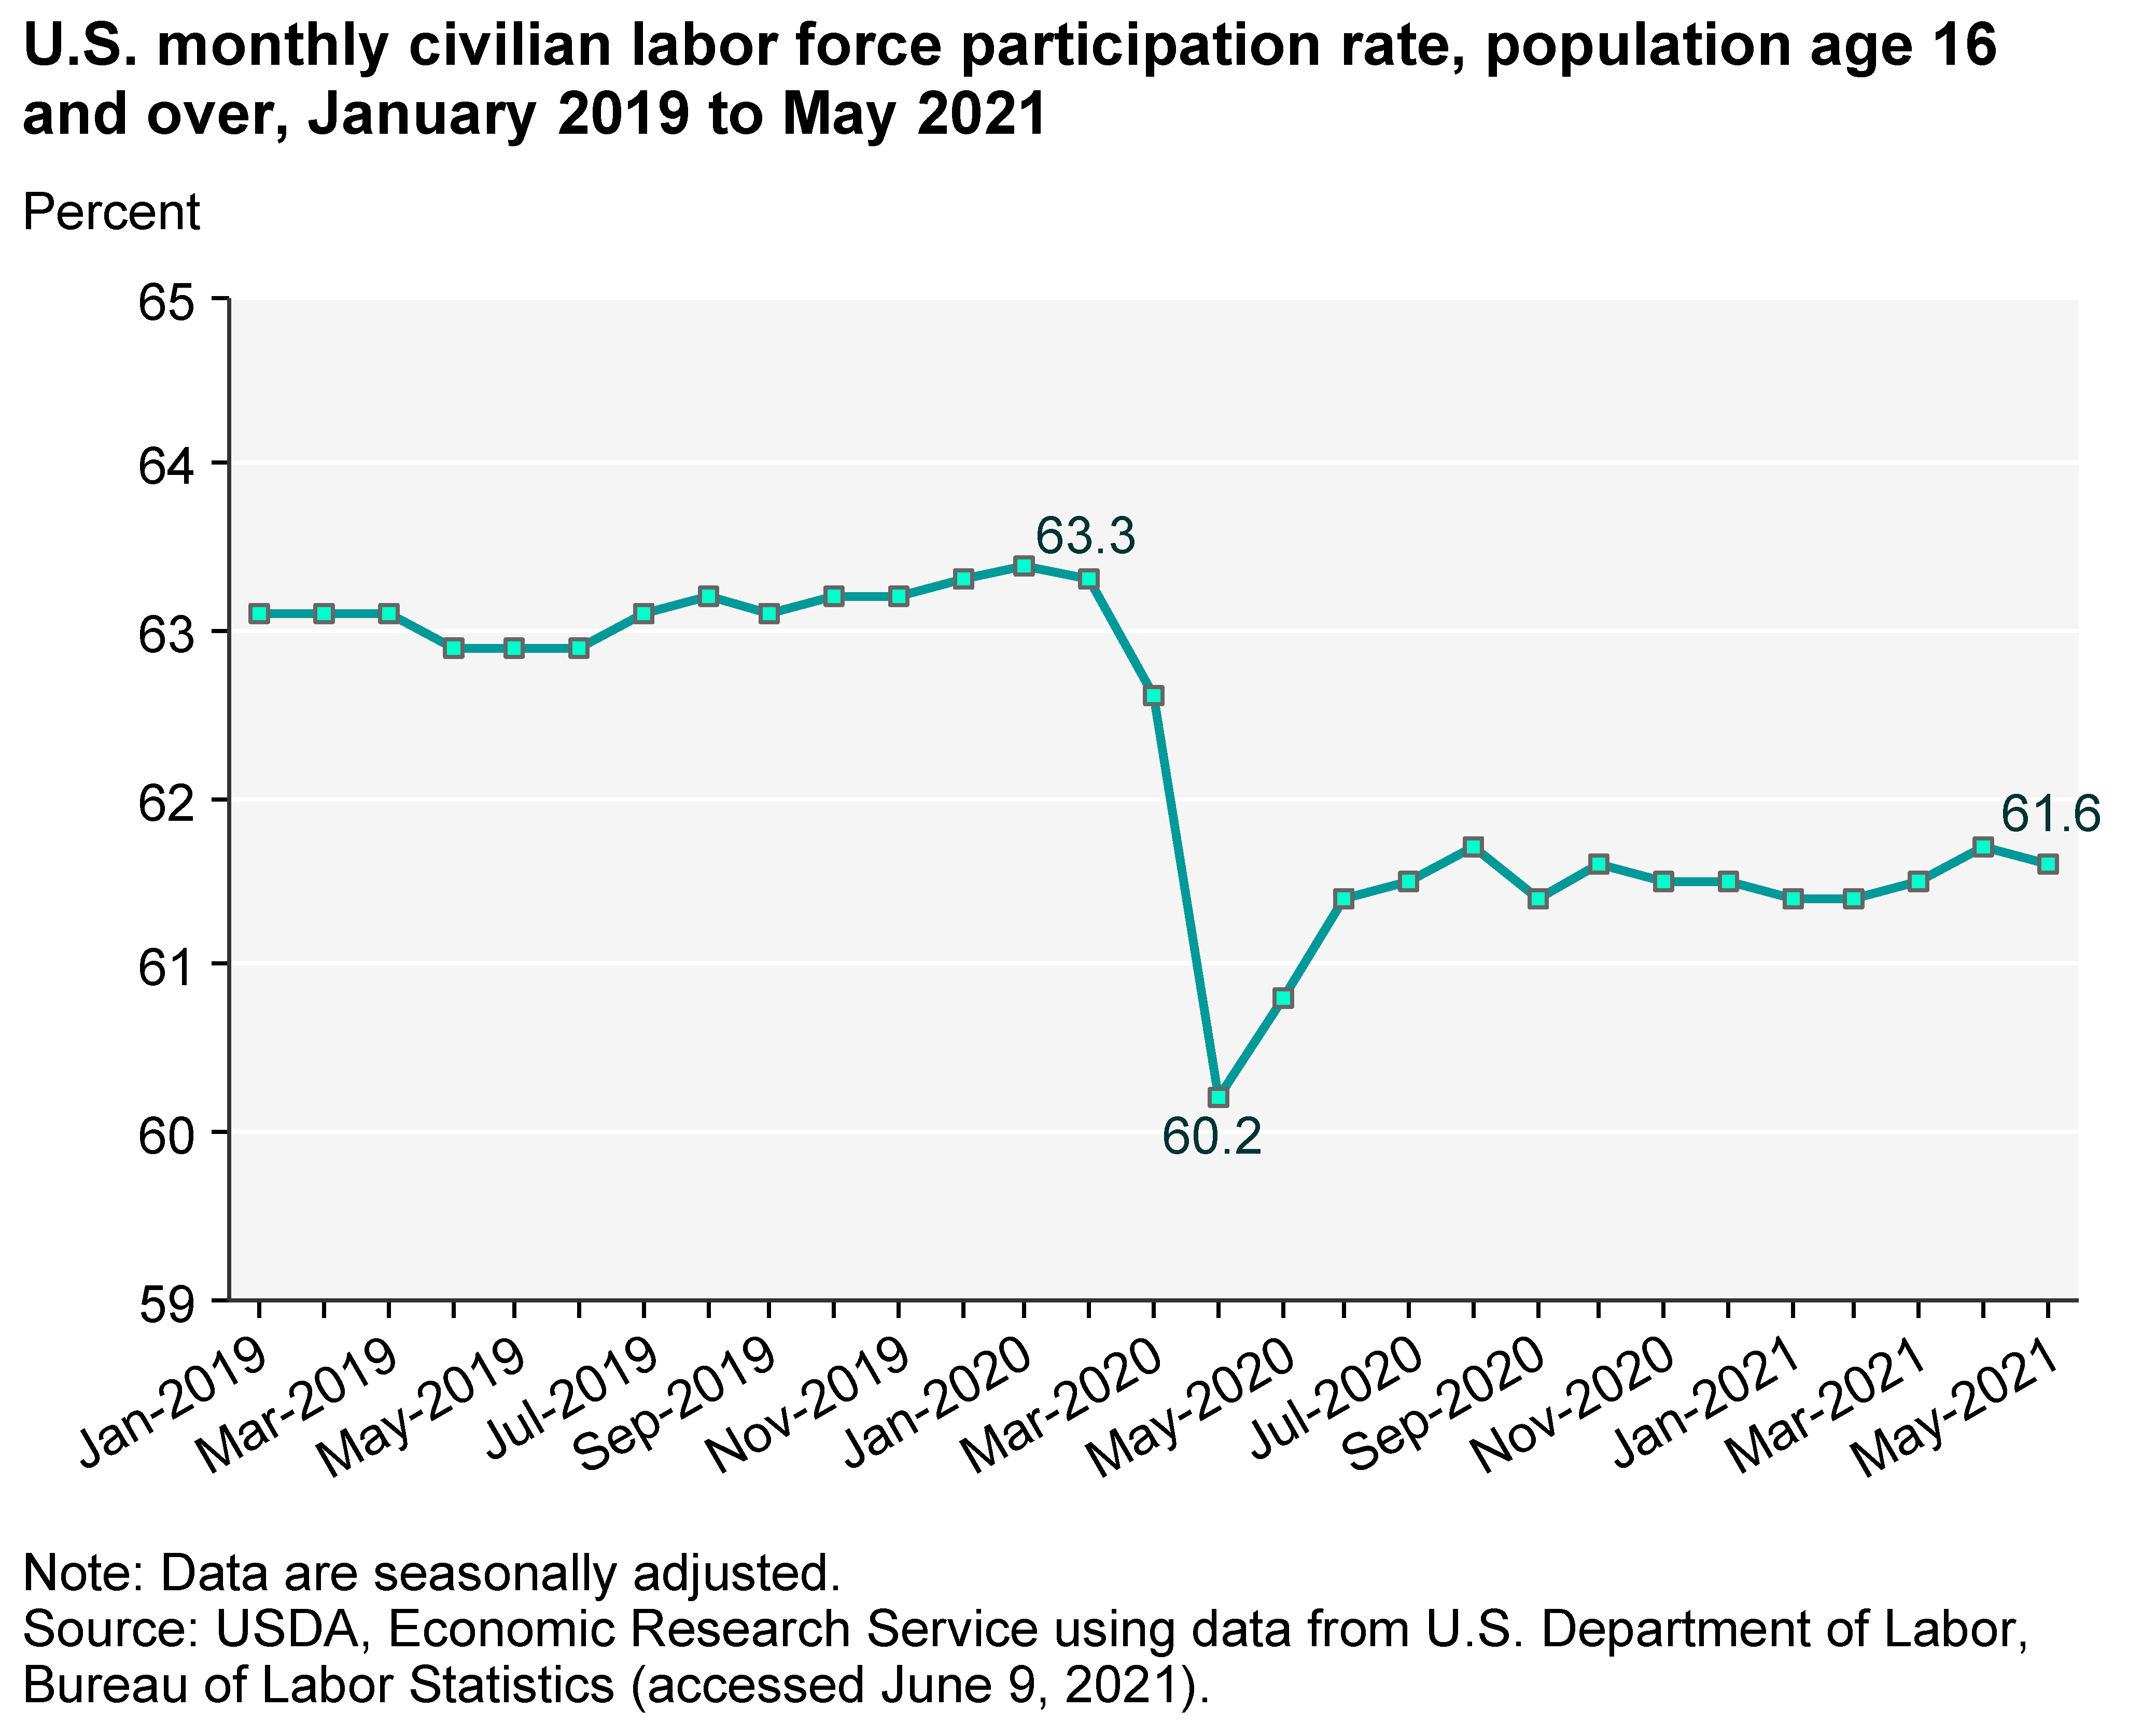
Changes in the unemployment rate do not tell the entire story of labor market changes during the COVID-19 pandemic. Changes in the labor force participation rate—the percentage of the working-age population that is either working or actively looking for work—also affect the labor market. Coinciding with the rise in unemployment at the beginning of the pandemic and recession, the national civilian labor force participation rate of adults aged 16 and older dropped from 63.3 percent in February 2020 to 60.2 percent in April 2020, according to BLS data (labor force participation in metro and nonmetro areas during this period are not available). Labor force participation partially recovered by June 2020 but has remained in the range of 61.4 to 61.7 percent since then; below the level of labor force participation prior to the pandemic.
Download chart image | Chart data
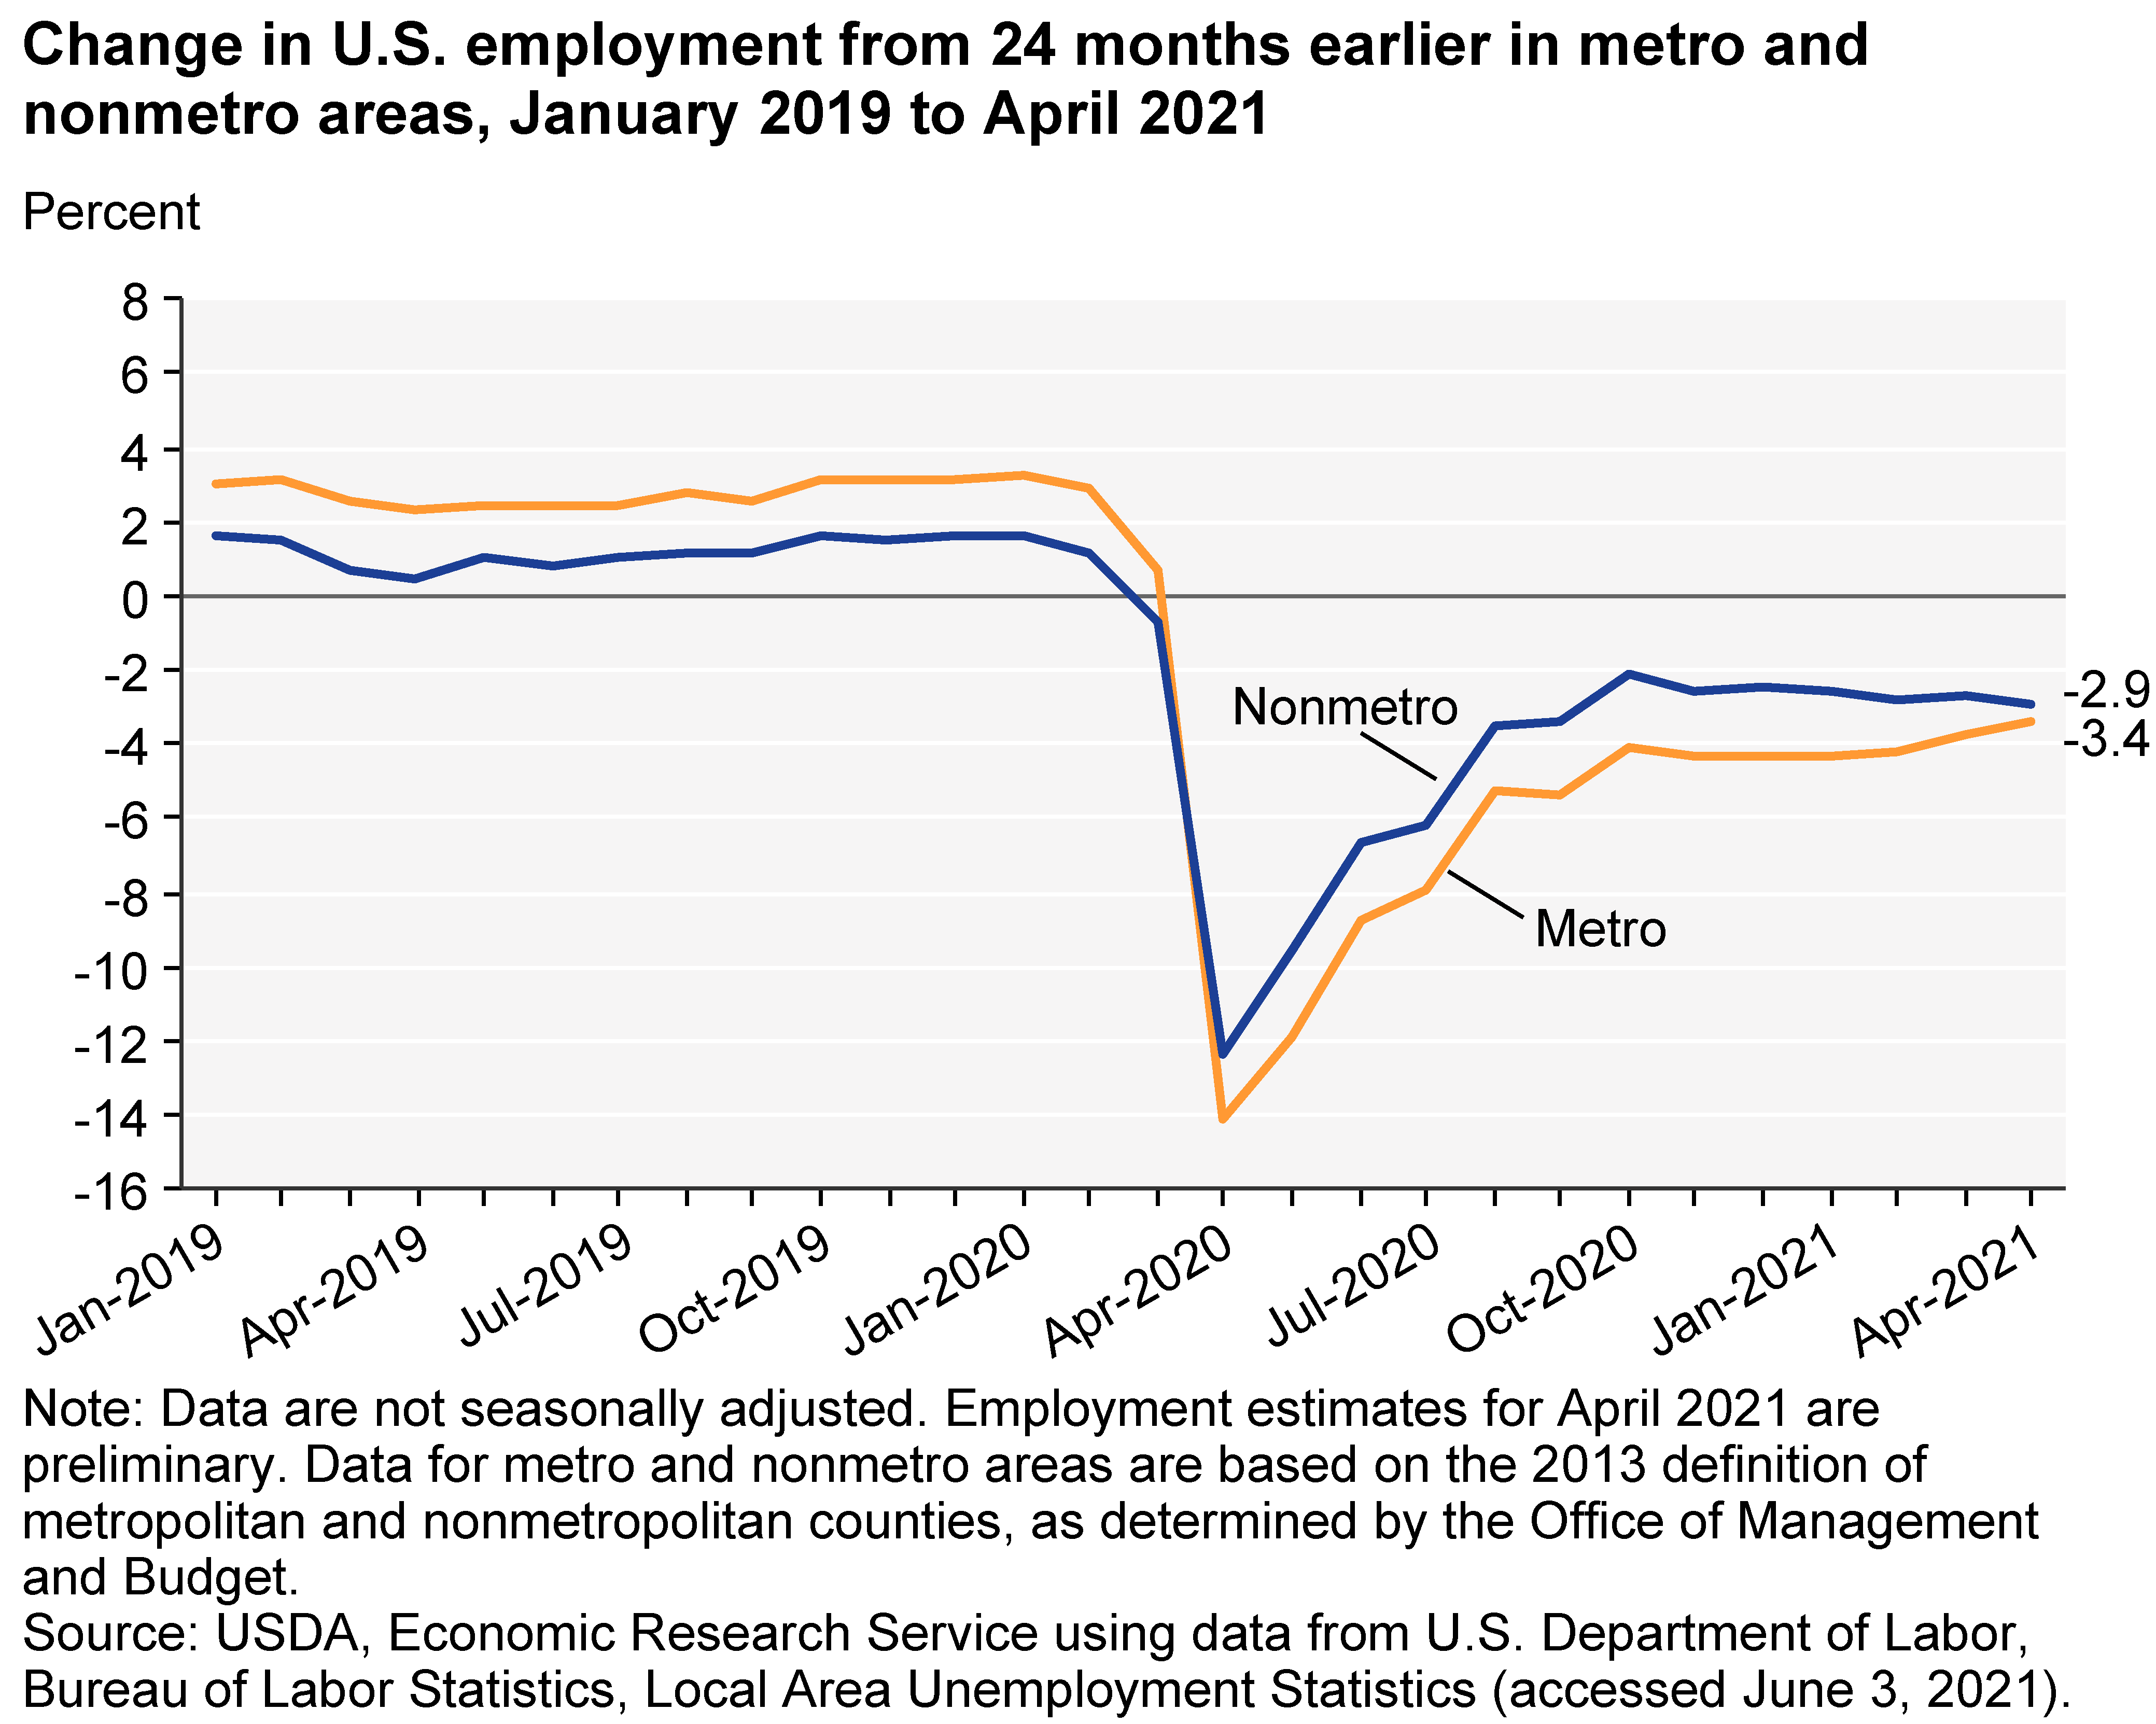
Changes in employment compared to the levels seen prior to the pandemic are inversely related to changes in the unemployment rate. However, because labor force participation has declined, percent employment changes show less recovery than changes in the unemployment rate. For example, although the unemployment rate in nonmetro areas had declined almost to the pre-pandemic level by November 2020, employment in nonmetro areas remained 2.6 percent below the nonmetro employment level from 24 months earlier. (Note: comparisons in the chart below are made to employment levels 24 months earlier to avoid comparisons to employment in prior periods during the pandemic). The decline in metro employment in the same 24-month period was even greater–4.3 percent. Employment remained depressed compared to 24 months earlier in both metro and nonmetro areas through April 2021, though more depressed in metro areas. In April 2021, employment in nonmetro areas was 2.9 percent below the level 24 months earlier, while metro employment was 3.4 percent below the earlier level.
Download chart image | Chart data
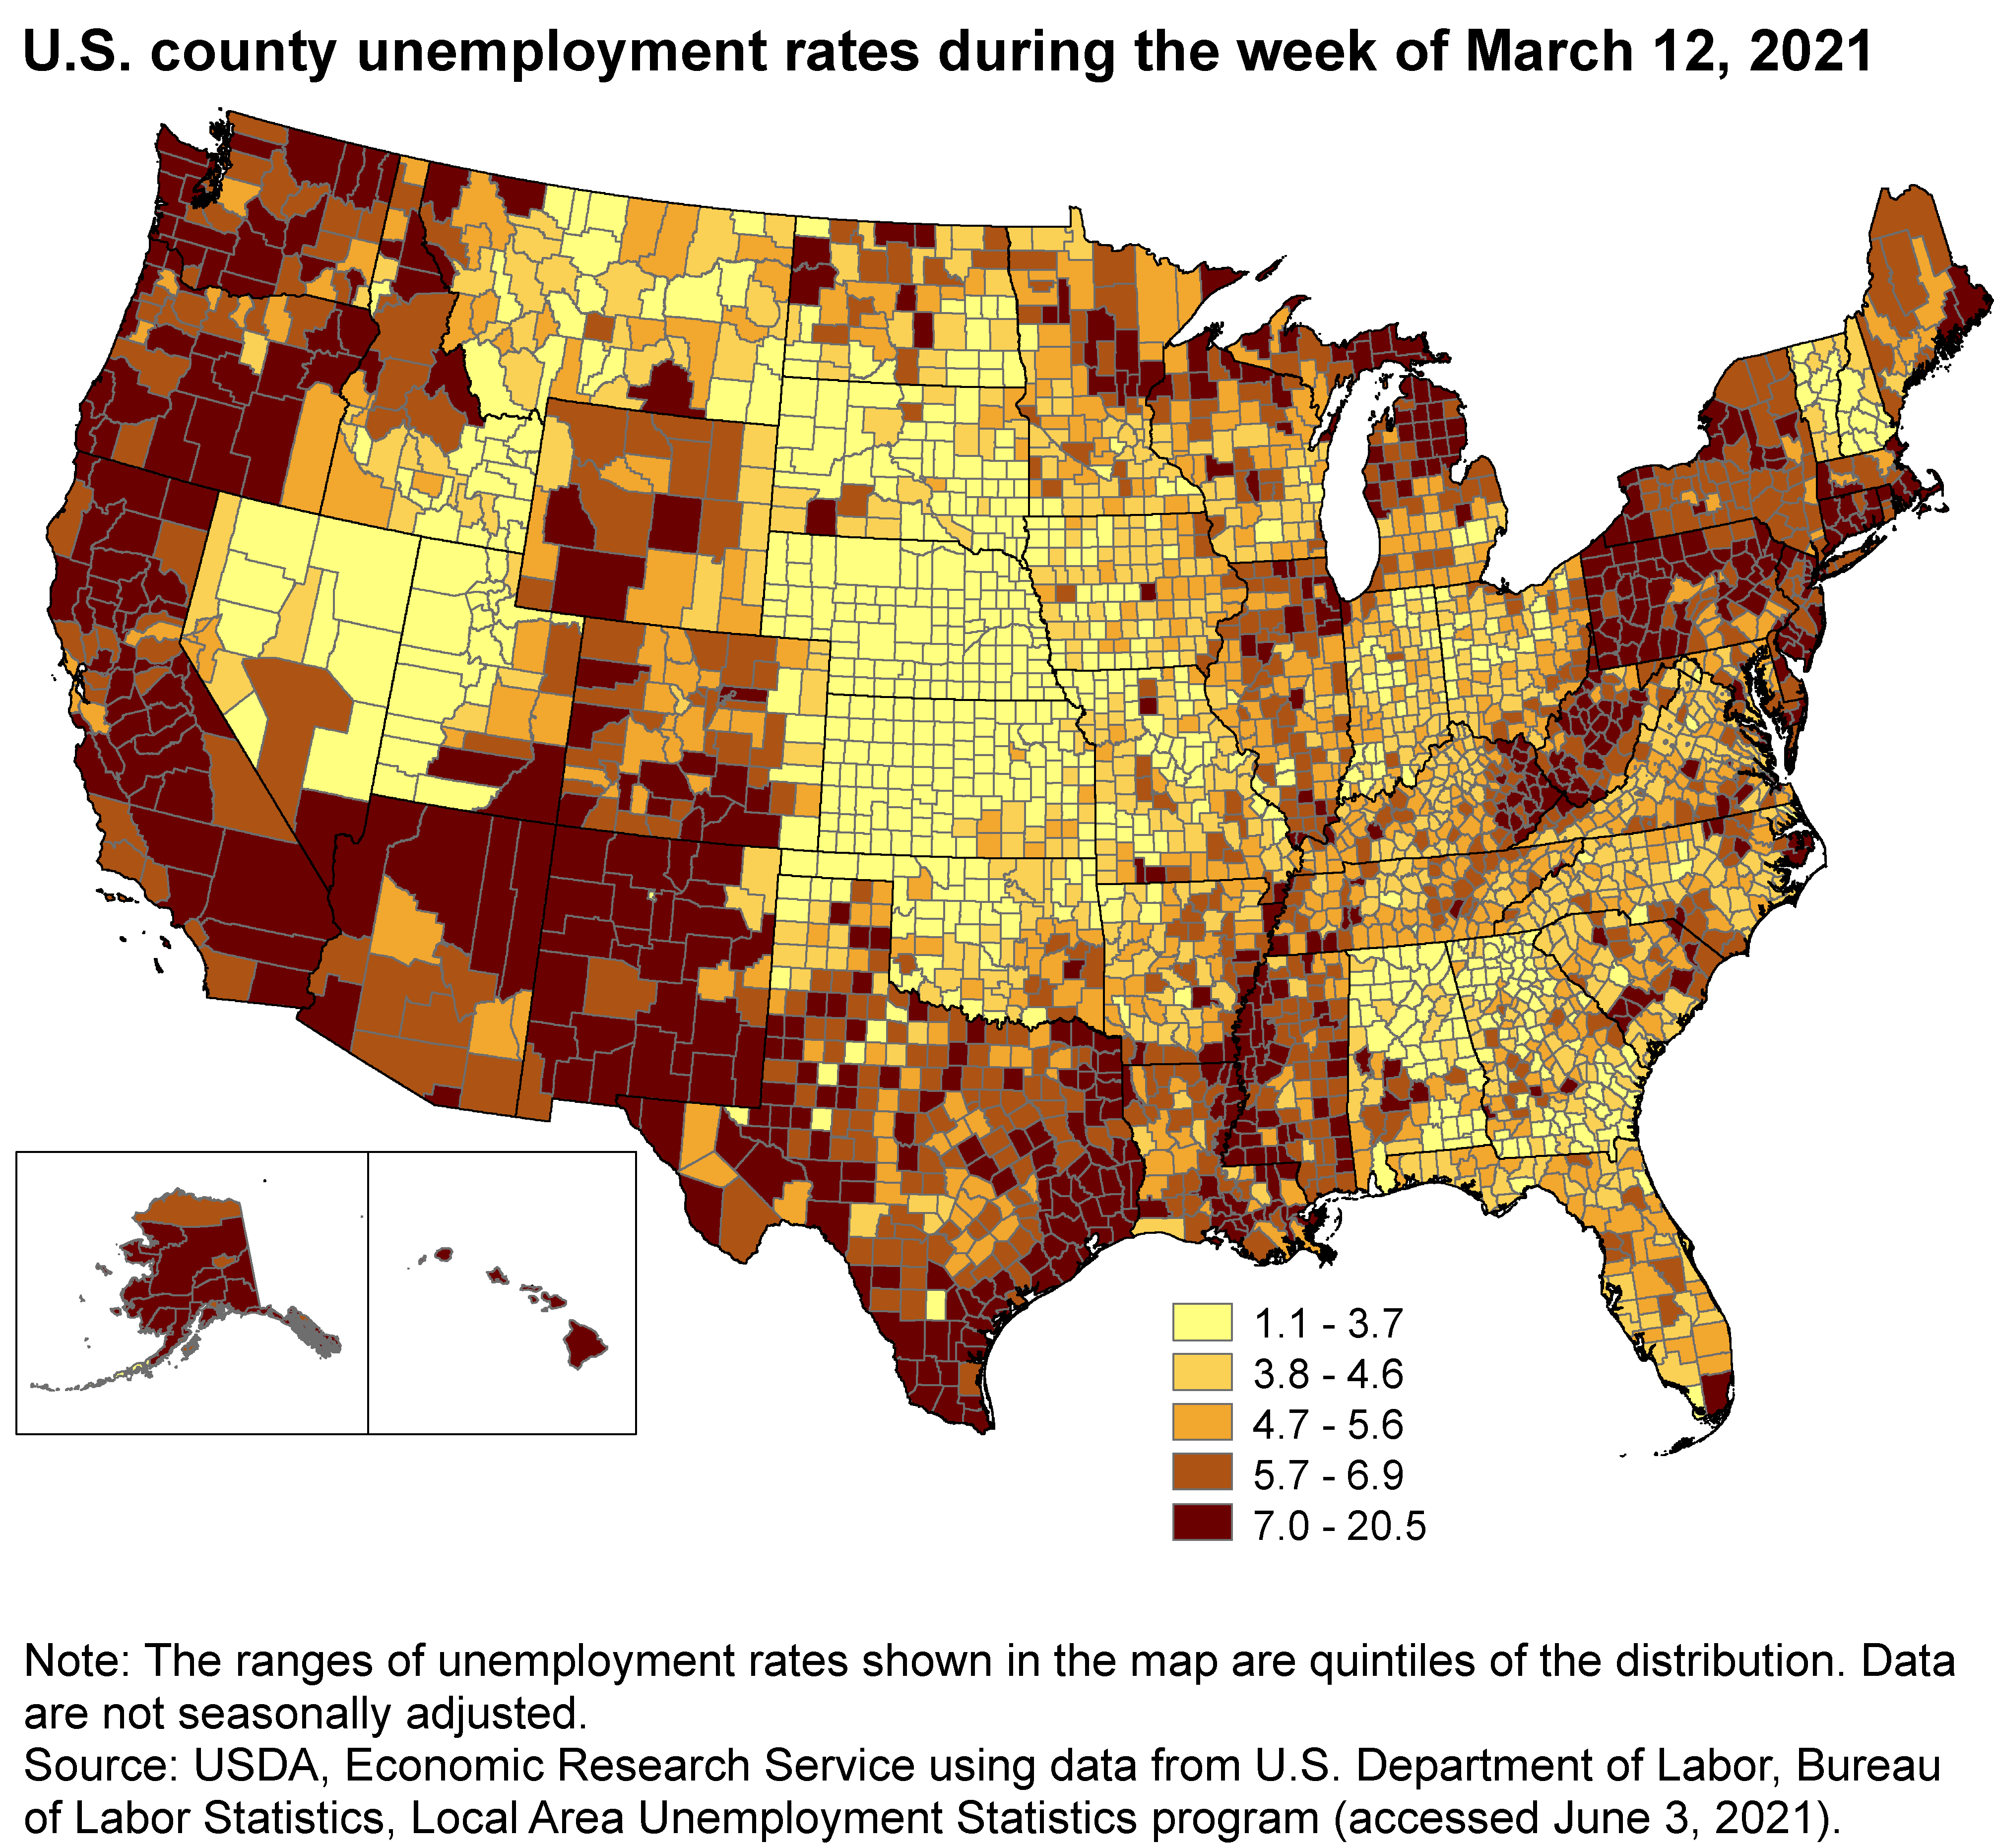
Unemployment rates in March 2021 varied substantially across counties in the United States, ranging from a low of 1.1 percent to a high of 20.5 percent. Generally, the highest unemployment rates were evident in parts of the Northeast region (especially in Appalachia), the northern Midwest region, in the lower Mississippi Delta and parts of the South Atlantic division in the South region, Texas, much of the Mountain region, and most of the Pacific region. The lowest unemployment rates were evident in the Great Plains in the West North Central division and in parts of the Mountain region, though high unemployment rates occurred in some counties in these regions as well.
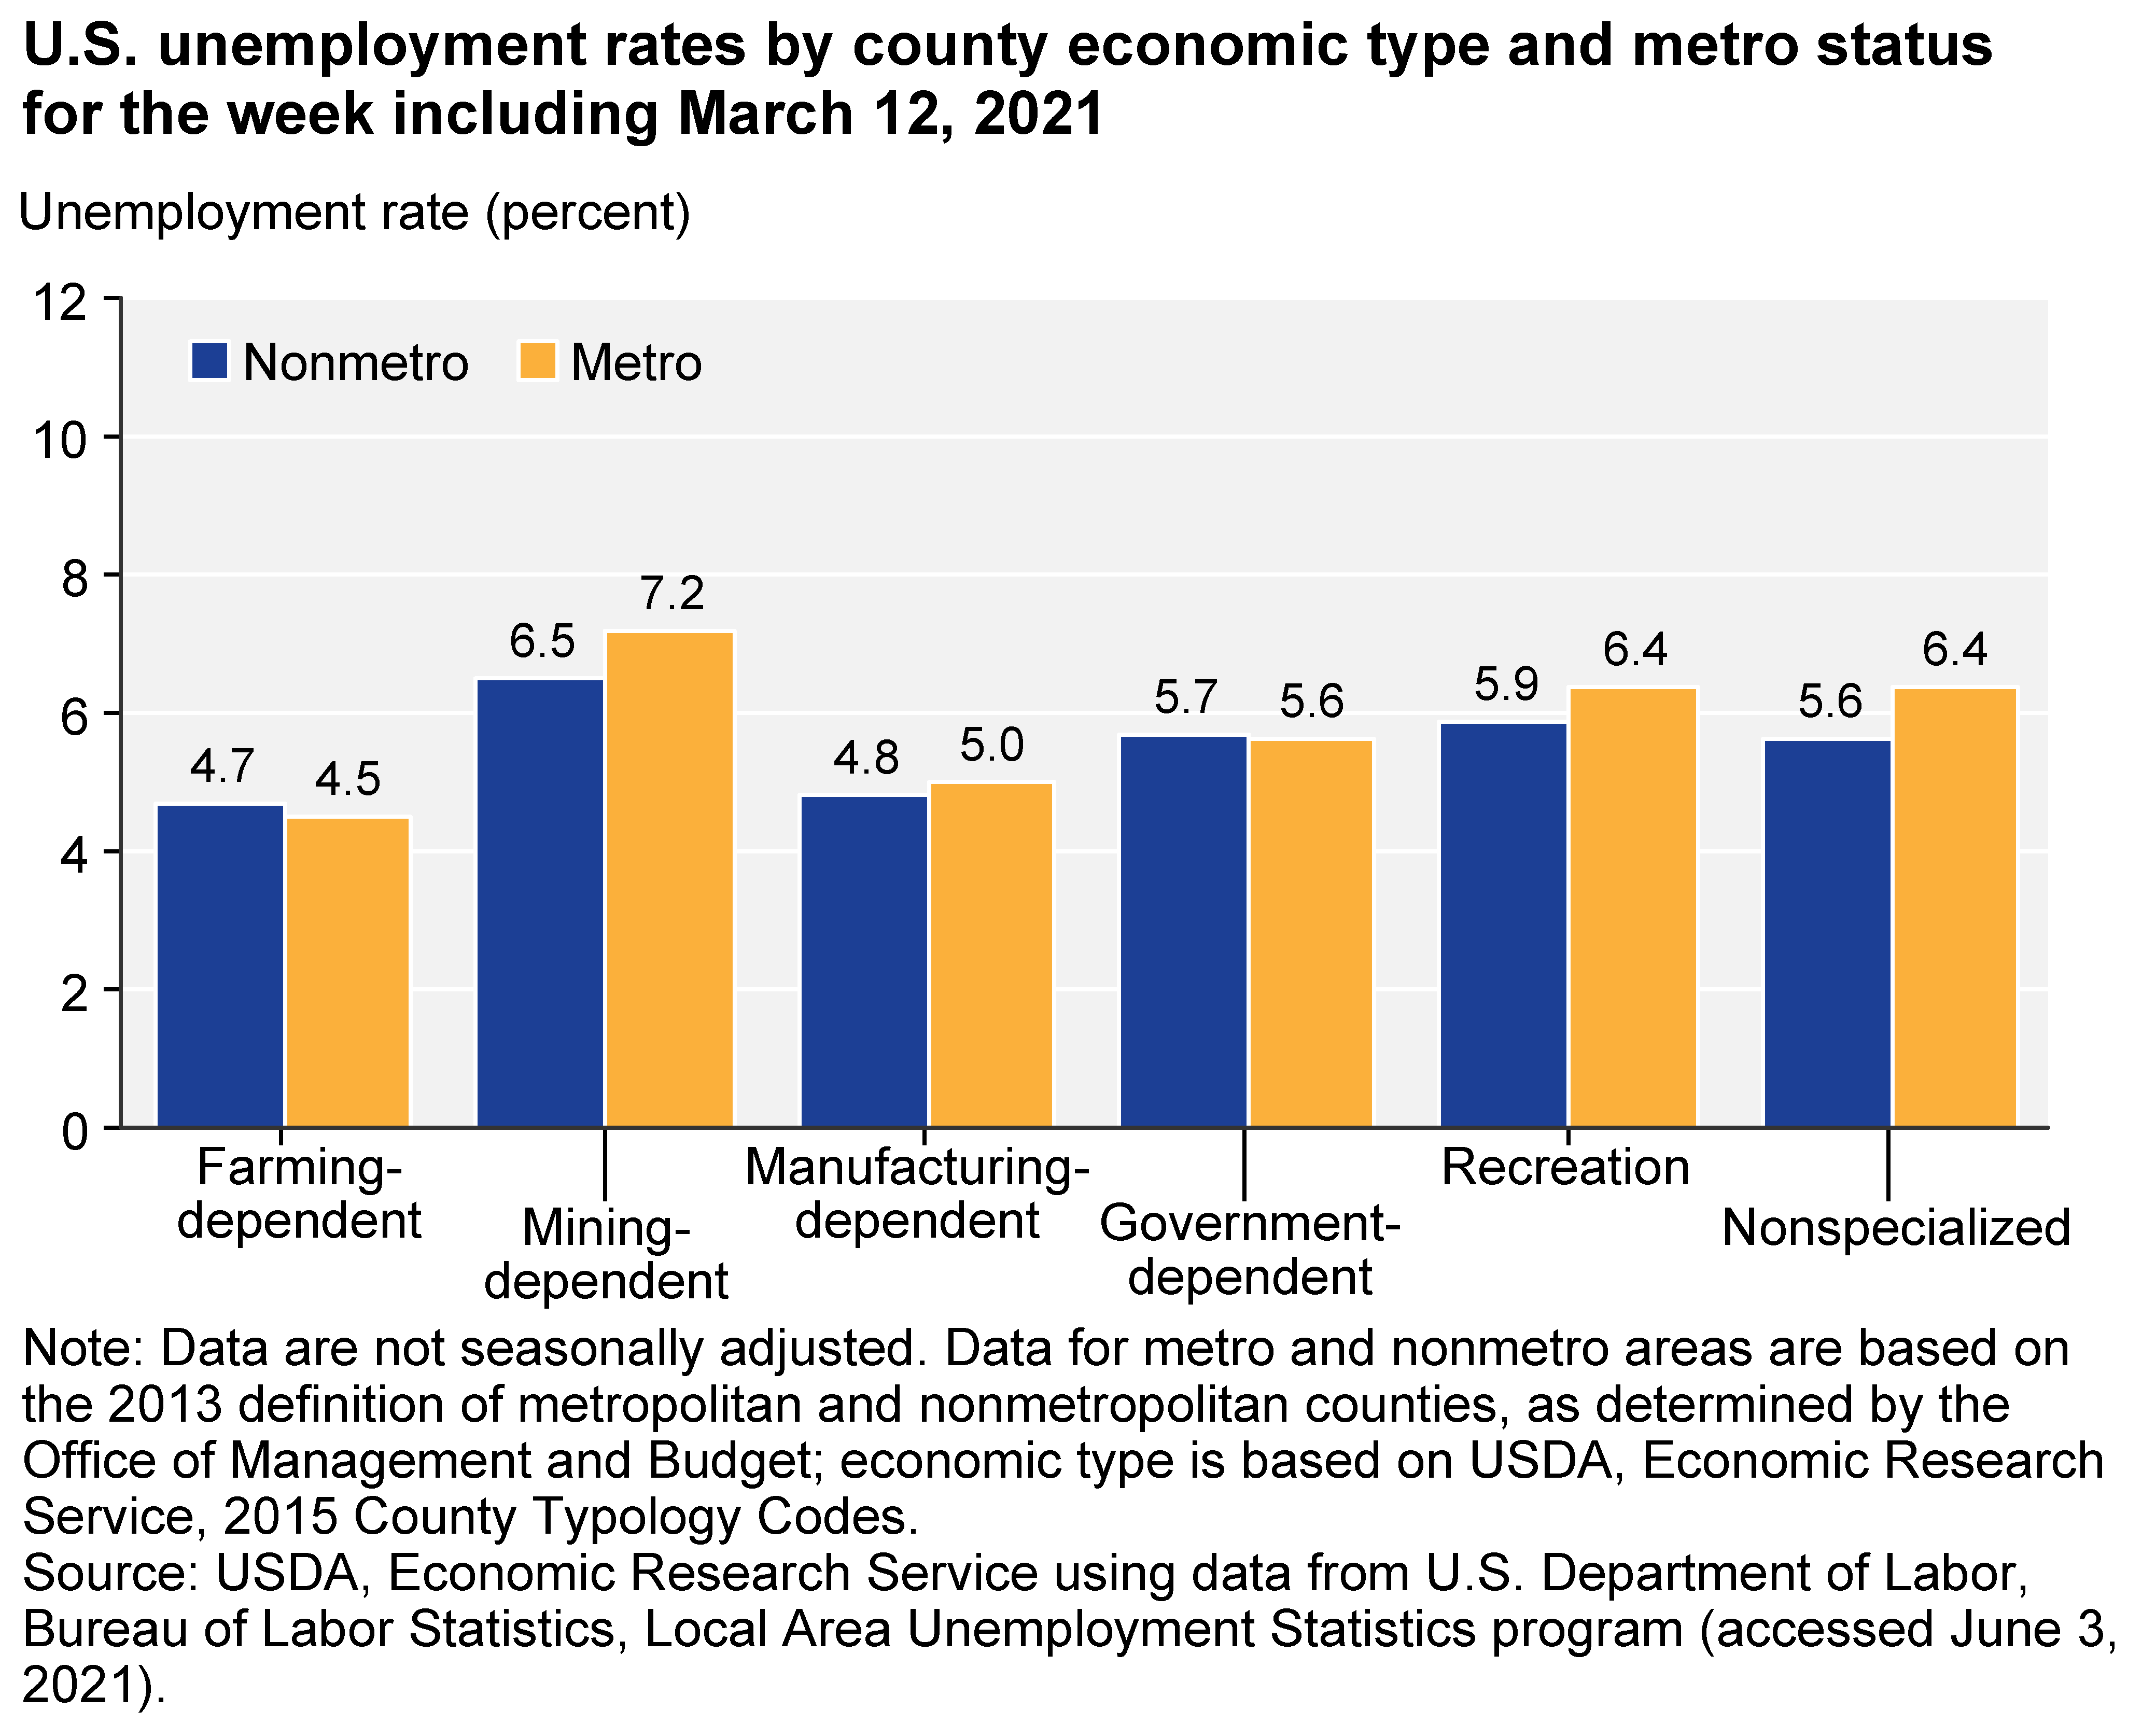
The unemployment rate in January 2021 was higher in metro than in nonmetro counties for most county economic types, except farming-dependent and Federal and State government-dependent counties (the unemployment rates in metro and nonmetro counties were very similar for these economic types). Farming-dependent counties had the lowest unemployment rate in both metro and nonmetro counties (4.7 percent in nonmetro and 4.5 percent in metro farming-dependent counties), and manufacturing-dependent counties also had relatively low unemployment (4.8 percent in nonmetro and 5.0 percent in metro manufacturing-dependent counties). The highest unemployment rate occurred in metro mining-dependent counties (7.2 percent). Among nonmetro counties, the highest unemployment rate also occurred in mining-dependent counties (6.5 percent).
Download chart image | Chart data
In general, nonmetro counties have lower unemployment rates than metro counties but similar prevalence of COVID-19 cases per 100,000 residents overall. Across county economic types in nonmetro areas, farming-dependent and manufacturing-dependent counties have the highest cumulative COVID-19 prevalence but the lowest unemployment rates.
Note on Data Sources
The county-level data on COVID-19 cases are from the Johns Hopkins University Center for Systems Science and Engineering (JHU-CSSE). The number of cases in each county are divided by the 2019 population of the county to compute case rates, using the 2019 U.S. Department of Commerce, Bureau of the Census population estimates. The JHU-CSSE case data are based on case reports provided by the U.S. Centers for Disease Control and Prevention (CDC) and by State and local health departments. Not all cases are assigned to specific counties in the JHU-CSSE data (1.4 percent of total cases were not assigned to specific counties on June 7, 2021); these unassigned cases are not included in the analysis of case rates by metro status or county economic types.
The county-level data on unemployment rates are from the BLS Local Area Unemployment Statistics (LAUS) program. These data are model-based estimates based mainly on the monthly Current Population Survey employment and unemployment estimates, and unemployment insurance claims data from State workforce agencies. The county estimates are controlled to sum to State-level estimates, which are controlled to sum to national estimates.
The LAUS estimates are considered preliminary in the first month after release, as additional information is incorporated into subsequent estimates. Significant changes in estimated county-level unemployment rates can occur between the initial preliminary estimate and subsequent revised estimates. For example, the maximum change in the unemployment rate for a single county between the preliminary estimate for March 2020 provided in the LAUS data released on April 29, 2020, and the revised estimate for March 2020 provided in the LAUS data released on June 5, 2020, is 1.94 percentage points. Across all counties, the mean difference in the March 2020 unemployment rate between the preliminary and revised estimate was -0.06 percentage points (i.e., the mean rate was 0.06 percentage points lower in the revised LAUS estimates), and the median difference was -0.08 percentage points.
