

Rising Rural Mortality Rates From Natural Causes for Working-Age Adults Lead to Widening Gap With Urban Counterparts
- by Kelsey L. Thomas (Conley), Elizabeth A. Dobis and David McGranahan
- 3/18/2025
Highlights
- The rural prime working-age (aged 25-54) population saw an increase in natural cause mortality rates between the periods 1999–2001 and 2017–2019.
- The gap in mortality rates between rural and urban areas for the prime working-age population grew from a rural lead over urban areas of 6 percent in 1999 to a rural lead of 43 percent in 2019.
- The more rural the area, the greater the increase (or smaller the decrease) in natural-cause mortality rates, affecting both males and females.
- In rural areas, natural cause mortality rates for prime working-age females rose more than for prime working-age males between 1999–2001 and 2017–2019.
The gap between rural and urban mortality rates from natural causes is widening. Twenty-five years ago, natural-cause, or disease-related, mortality rates were similar for working-age adults in both rural and urban areas. However, by 2019, the natural-cause mortality rate for rural residents of prime working age (ages 25–54) was 43 percent higher than for those living in urban areas. This growing disparity reflects both an improvement in urban health and a decline in rural health, which could have negative implications for rural families, communities, employment, and the rural economy.
To investigate the rural-urban natural-cause mortality gap, USDA, Economic Research Service researchers analyzed data from the Centers for Disease Control and Prevention on deaths from causes such as heart disease, cancer, and issues related to pregnancy. The data were from two 3-year periods, 1999–2001 and 2017–2019. The gap in natural-cause mortality rates widened between rural and urban areas for all major causes of death, although those differences varied, especially across age, sex, and rurality.
Increases in Mortality Rates Are Higher in Rural Areas
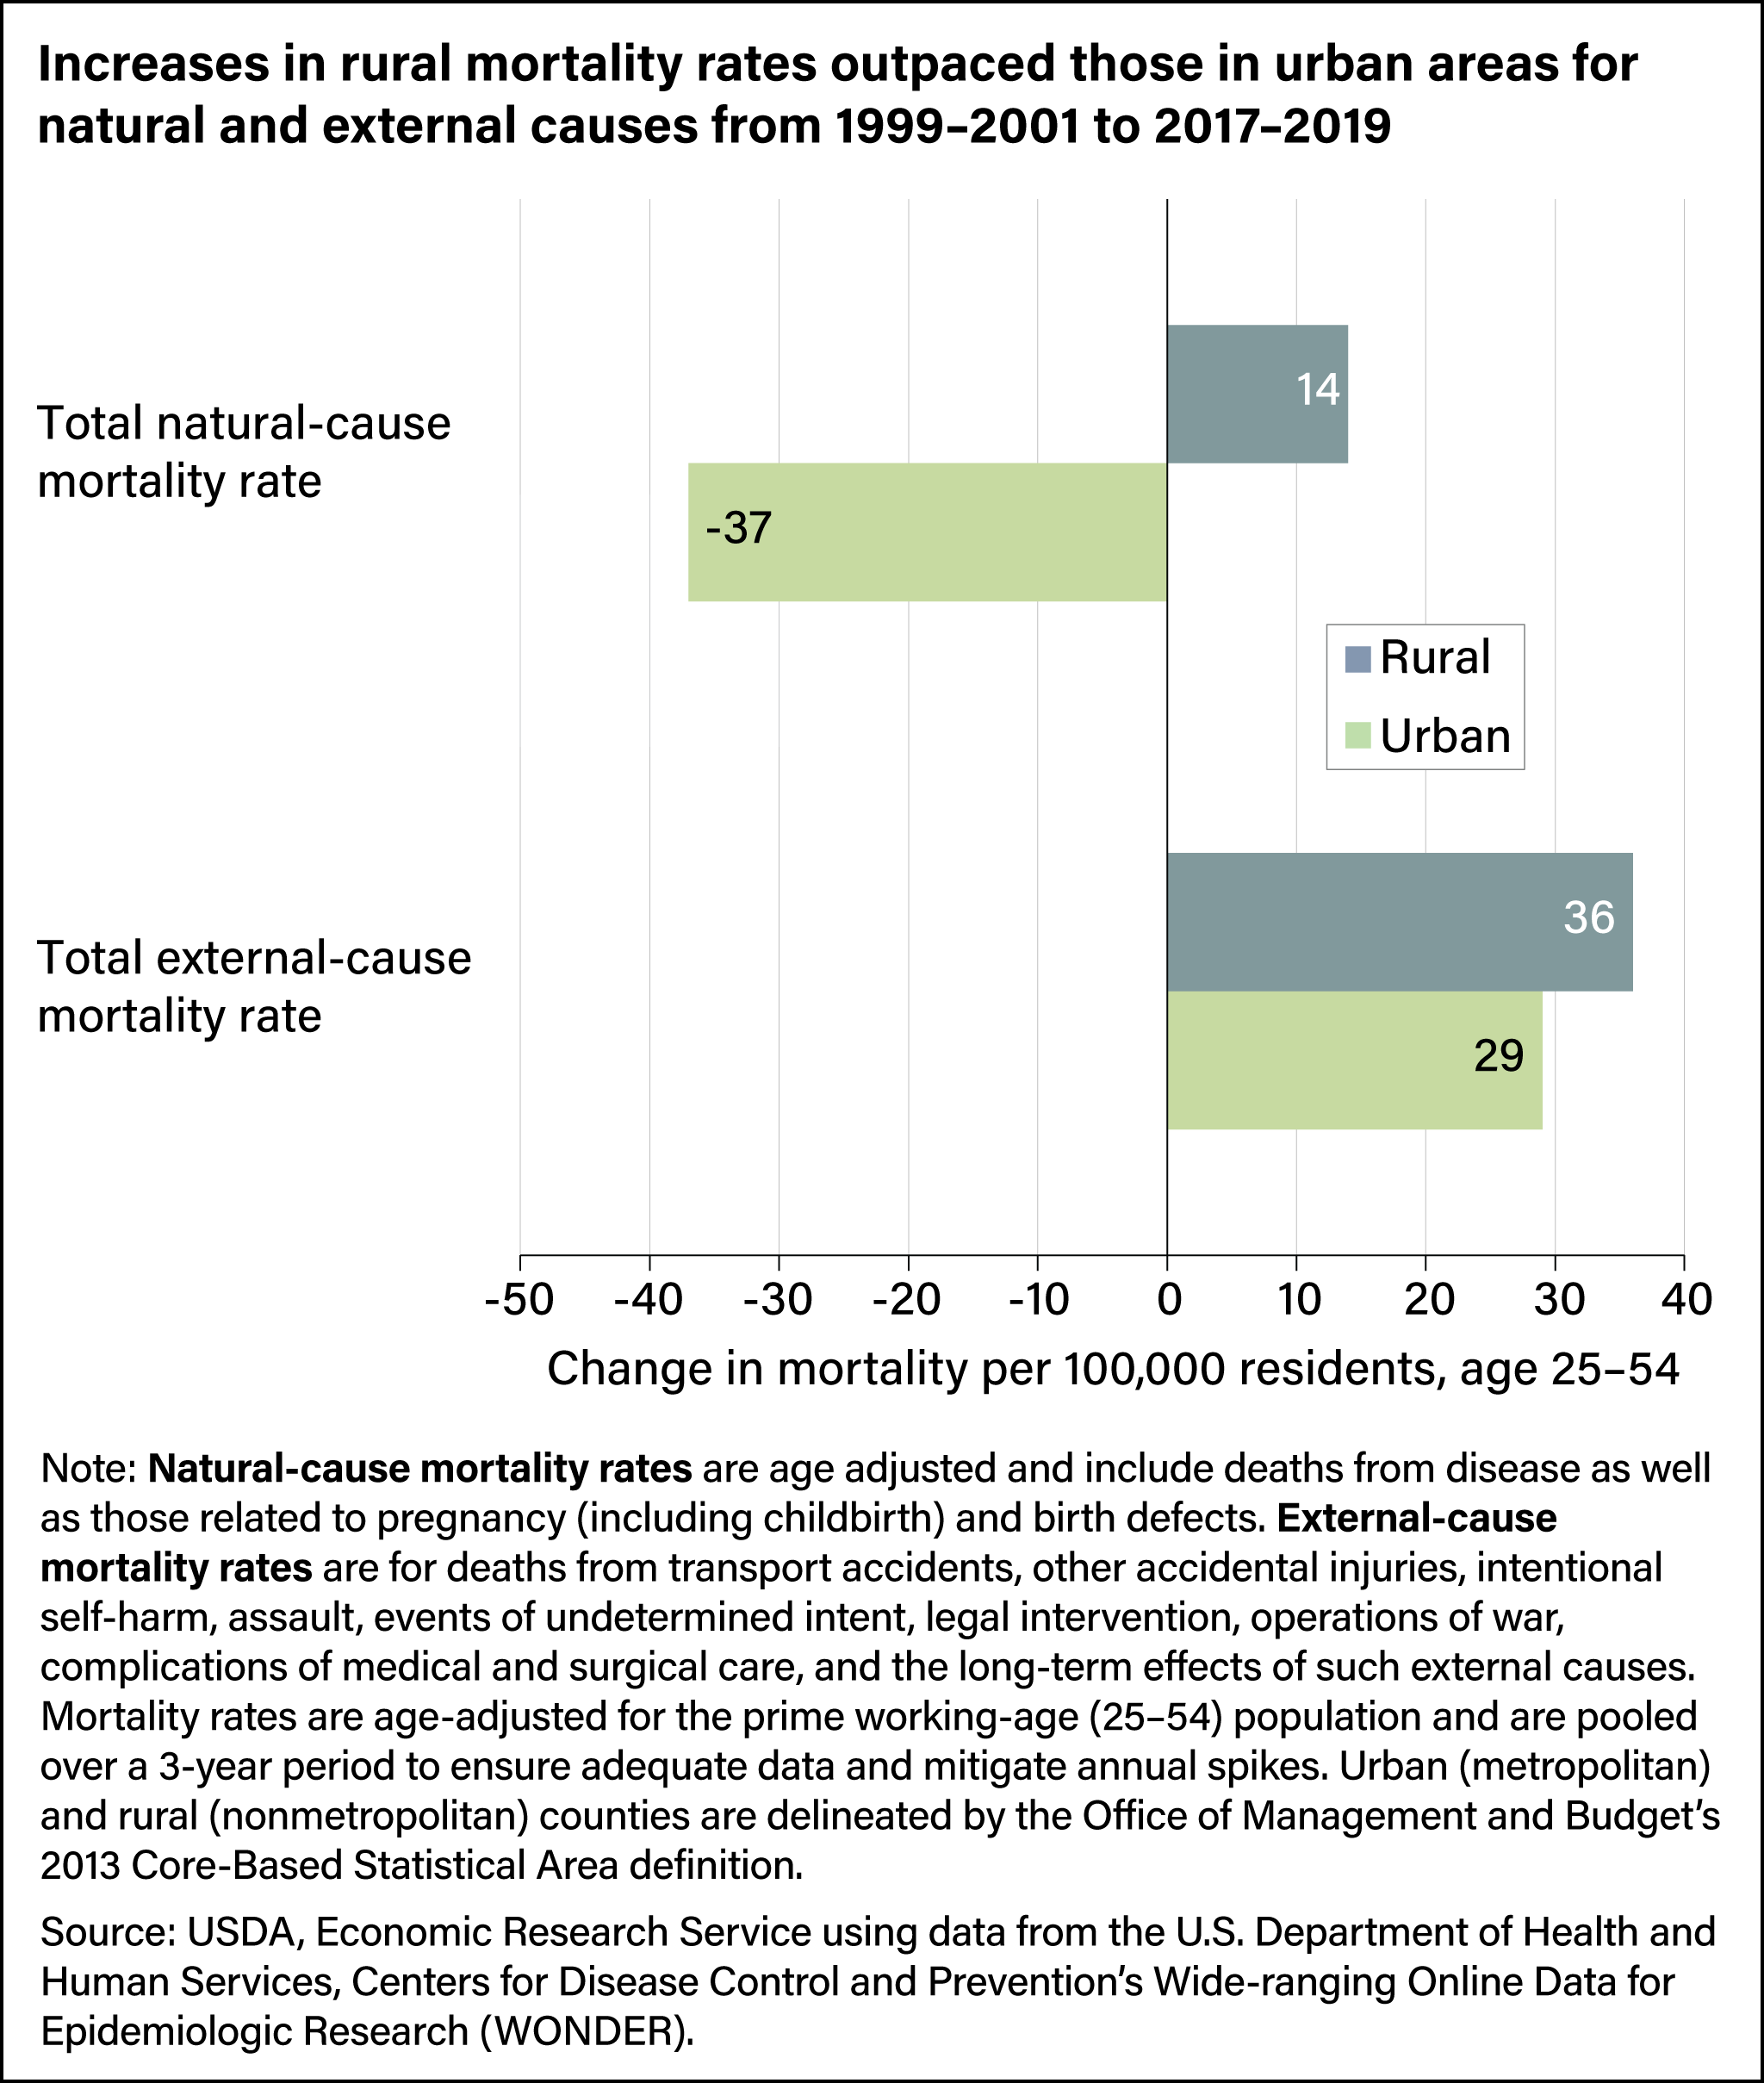
Comparing changes in rural and urban mortality rates for the prime working-age population, researchers noted differences between external-cause and natural-cause mortality. External causes of mortality include traffic accidents, drug overdose, suicide, and alcohol-induced deaths, and natural causes include deaths related to disease and old age, and, for women, deaths related to pregnancy and childbirth. In rural and urban areas alike, external-cause death rates increased for the prime working-age population, but the rise was slightly greater in rural areas: 36 deaths per 100,000 residents compared with 29 deaths per 100,000 residents for urban residents. On the other hand, natural-cause mortality rates increased for the rural prime working-age population (by 14 deaths per 100,000 residents) but fell (by 37 deaths per 100,000 residents) in urban areas.
Rural, Working-Age Adults Were the Only Group to Experience Increase in Natural-Cause Mortality
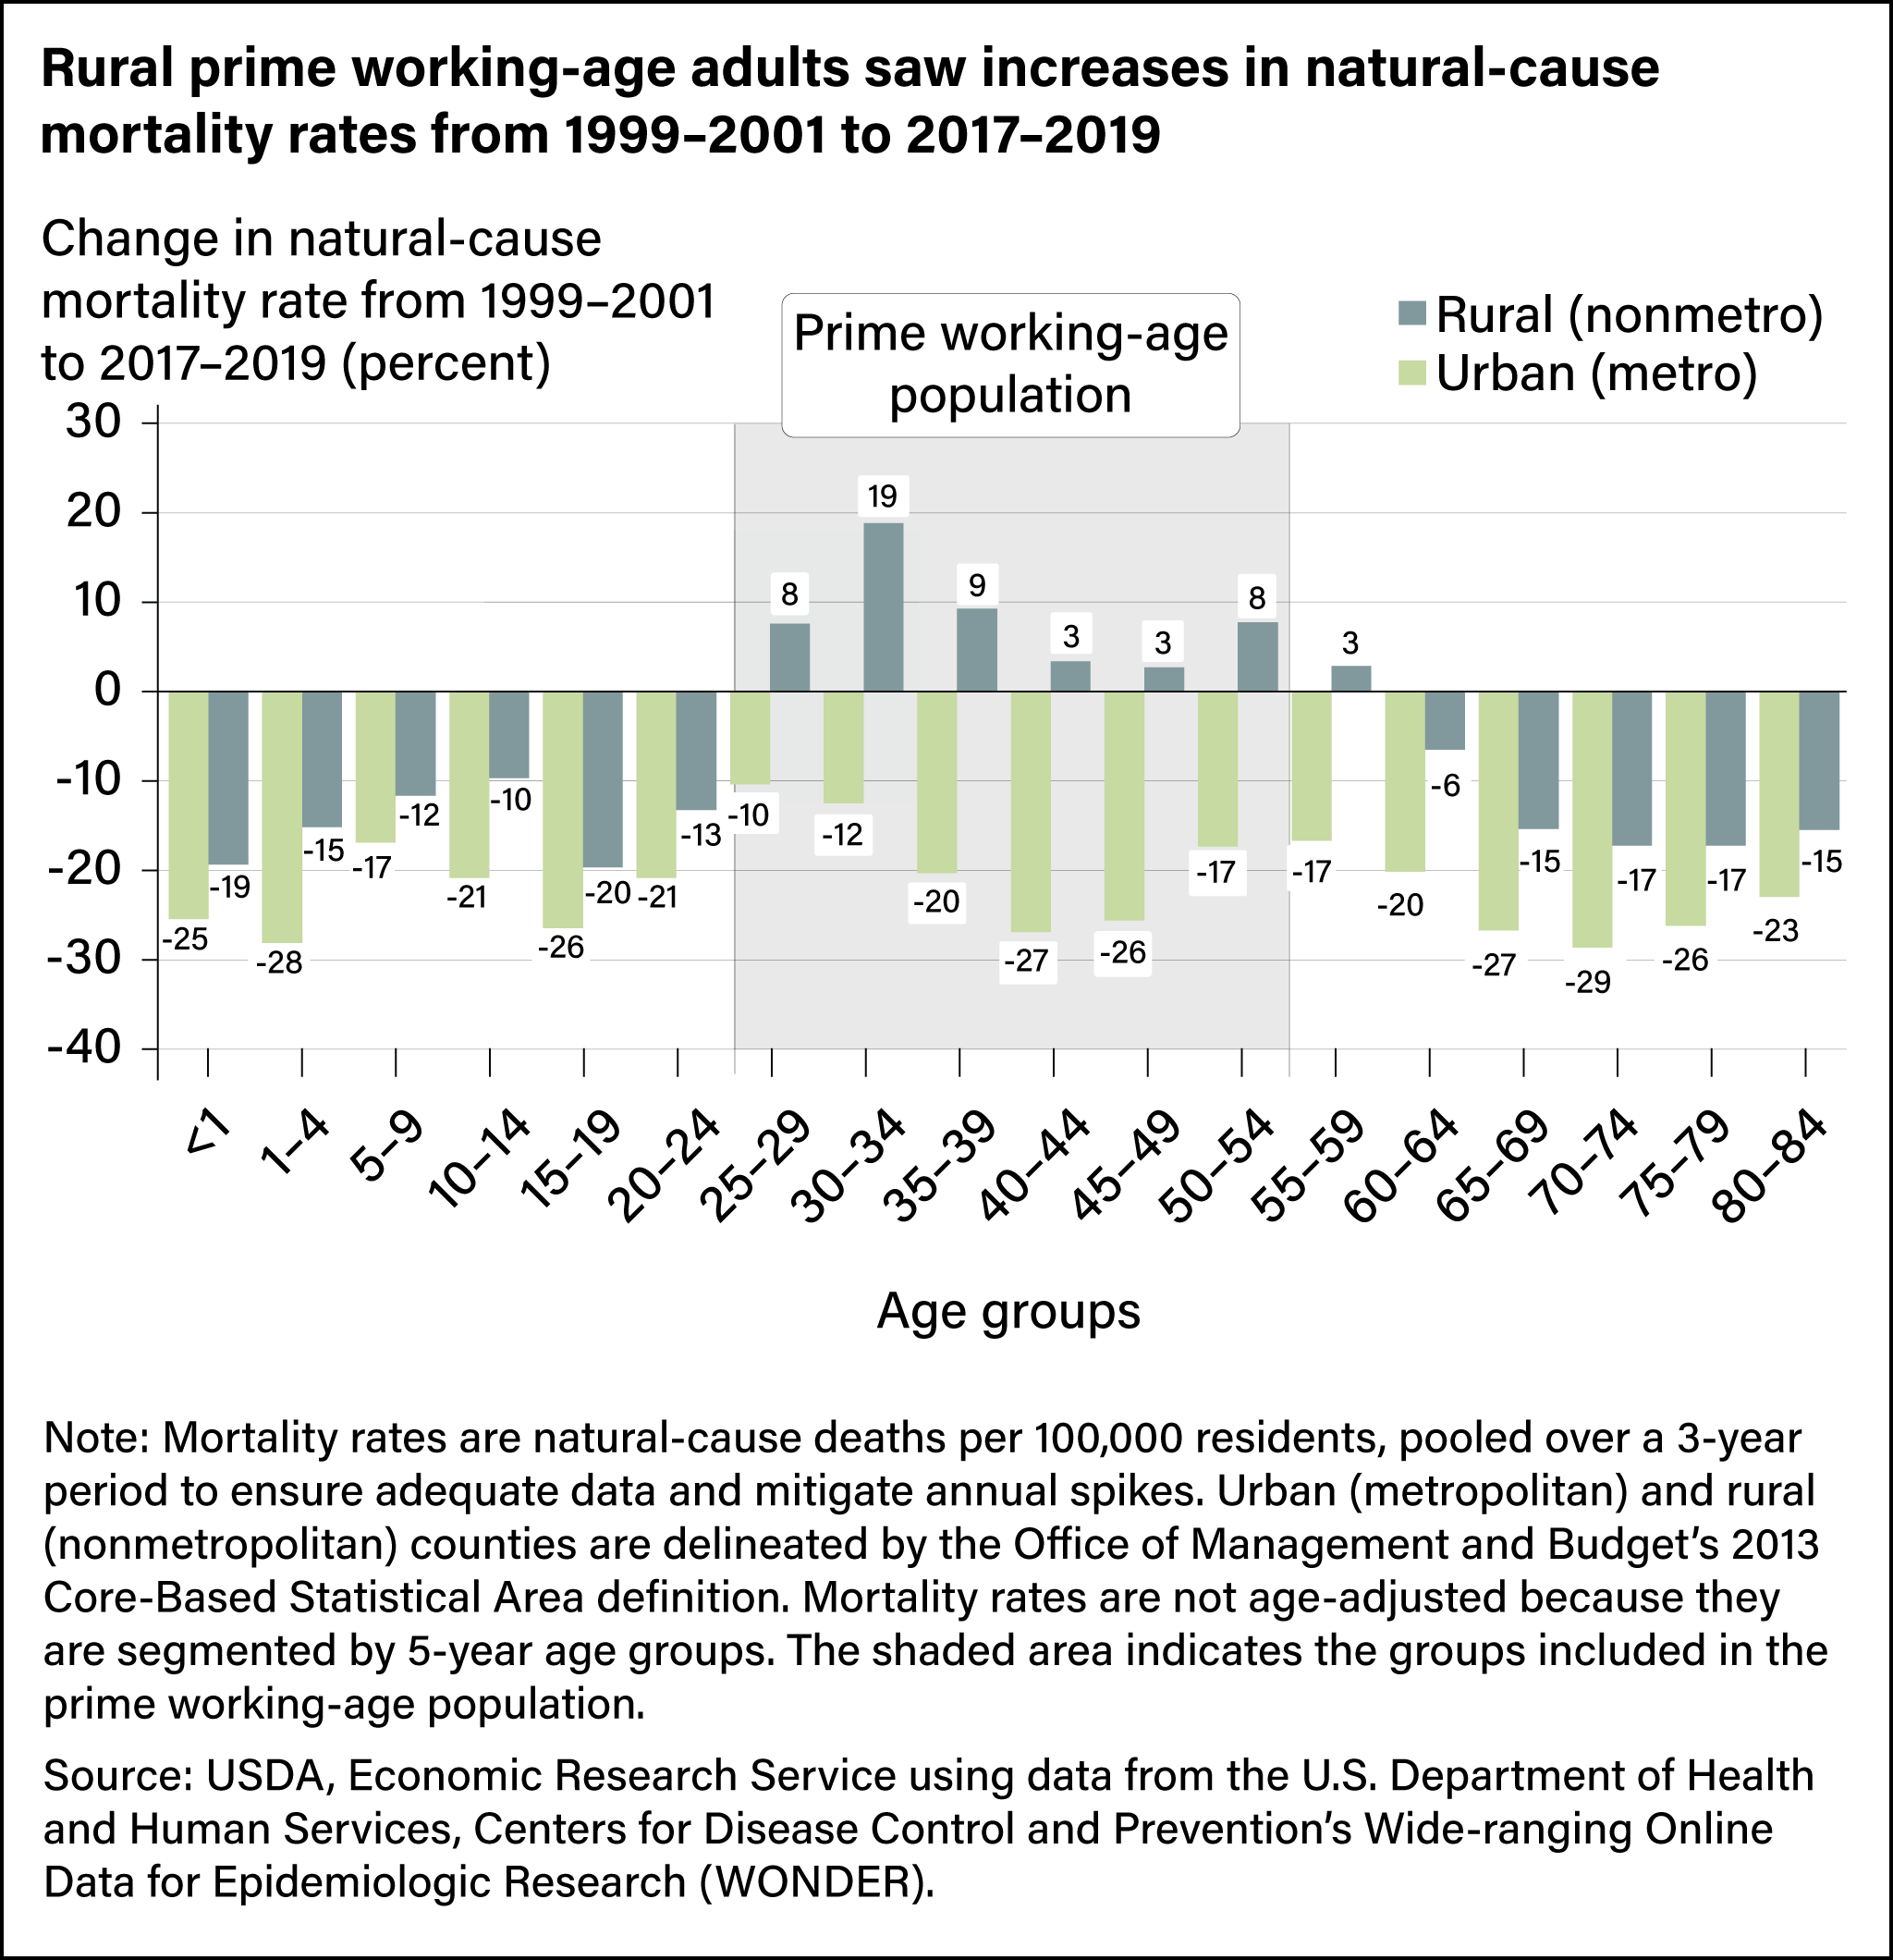
Examining natural-cause mortality rates by age group reveals a divergence across age and rurality. Urban areas saw natural-cause mortality rates decrease across all age groups from 1999–2001 to 2017–2019. In rural areas, natural-cause mortality rates fell for younger (birth up to age 24) and older (aged 60–84) populations, although those declines were not as much as in urban areas. However, natural-cause mortality rates rose for the rural prime working-age population (aged 25–54) and for rural adults aged 55–59. The largest percentage increase (19 percent) in rural natural-cause mortality rates was among 30- to 34-year-olds.
The More Rural the Location, the Larger the Natural-Cause Mortality Rate Gap, Especially for Females
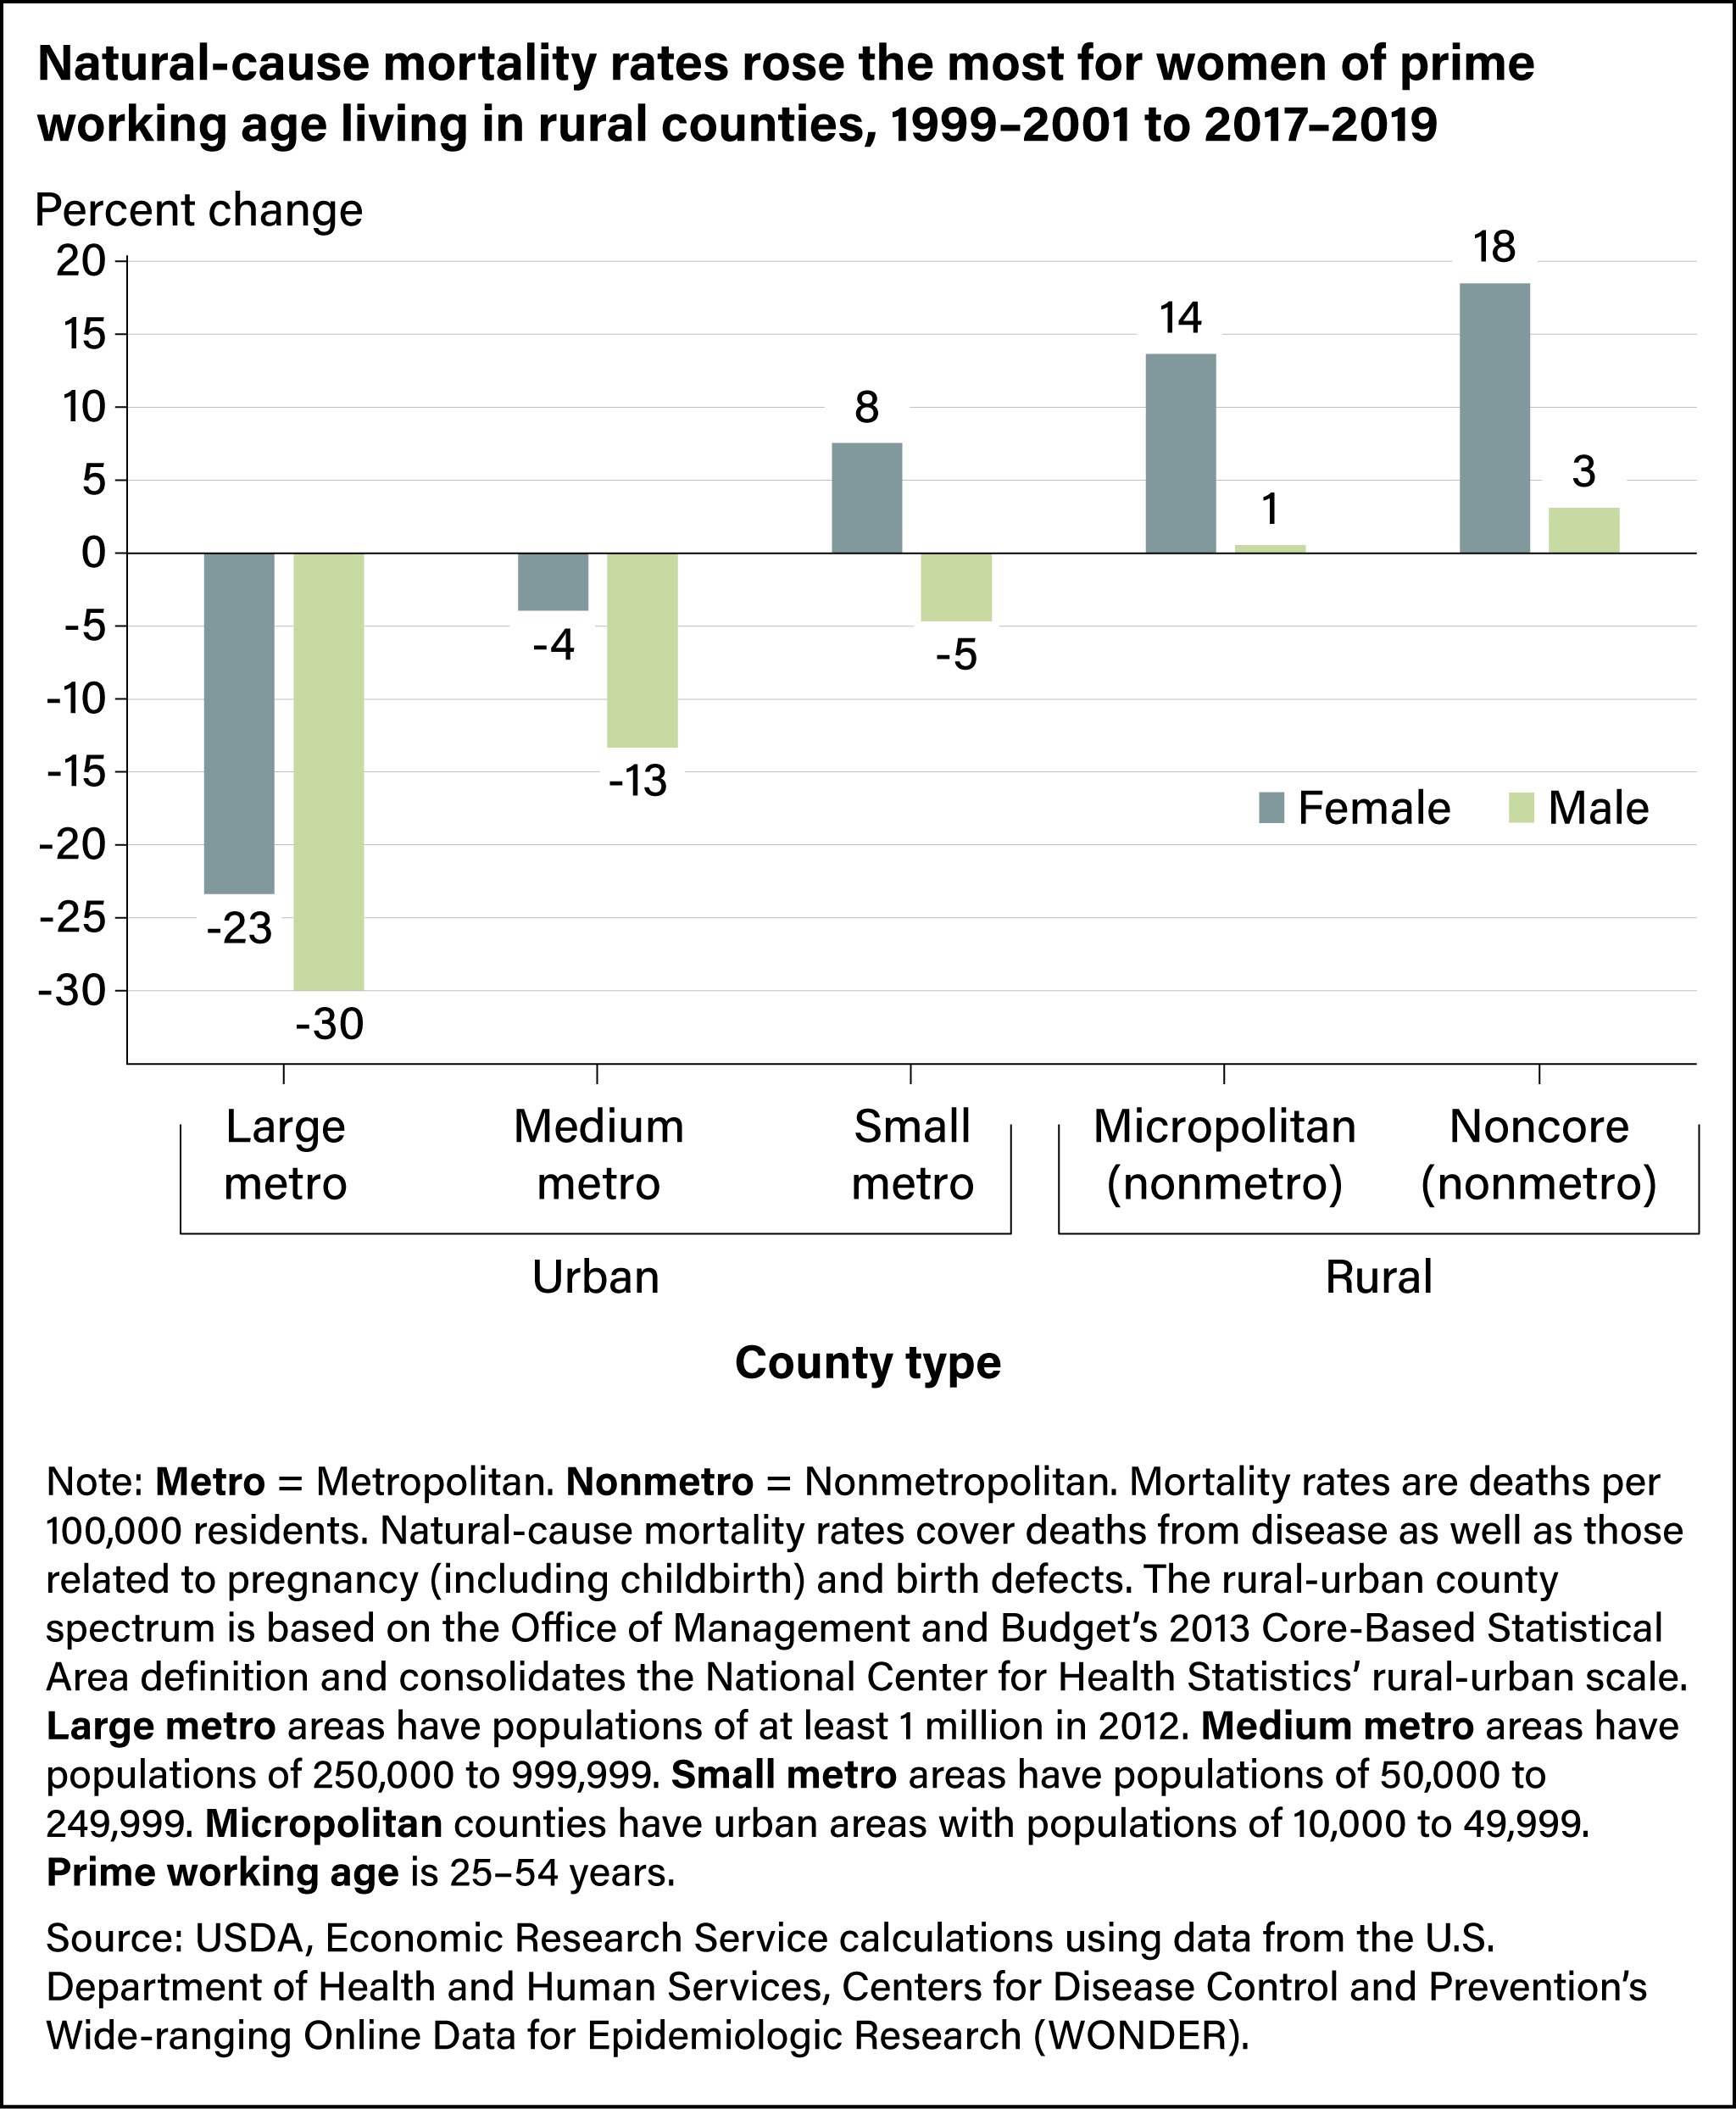
Changes in natural-cause mortality rates for the prime working-age population also varied by county rurality and sex. Within rural areas, the more rural the county, the greater the increase (or smaller the decrease) in natural-cause mortality rates, particularly among females. In large urban counties, natural-cause mortality rates decreased by 23 percent for females and 30 percent for males, while in the most rural or nonmetro counties, natural-cause mortality rates increased 18 percent for females and 3 percent for males. Across all rural counties (micropolitan and noncore), the increases were larger for females than they were for males. The data suggest the rising prime working-age natural-cause mortality rates for females helped drive an overall increase of natural-cause mortality rates in rural areas between 1999–2001 and 2017–2019.
Different Underlying Causes of Death Drive the Rural-Urban Mortality Rate Gap for Males and Females
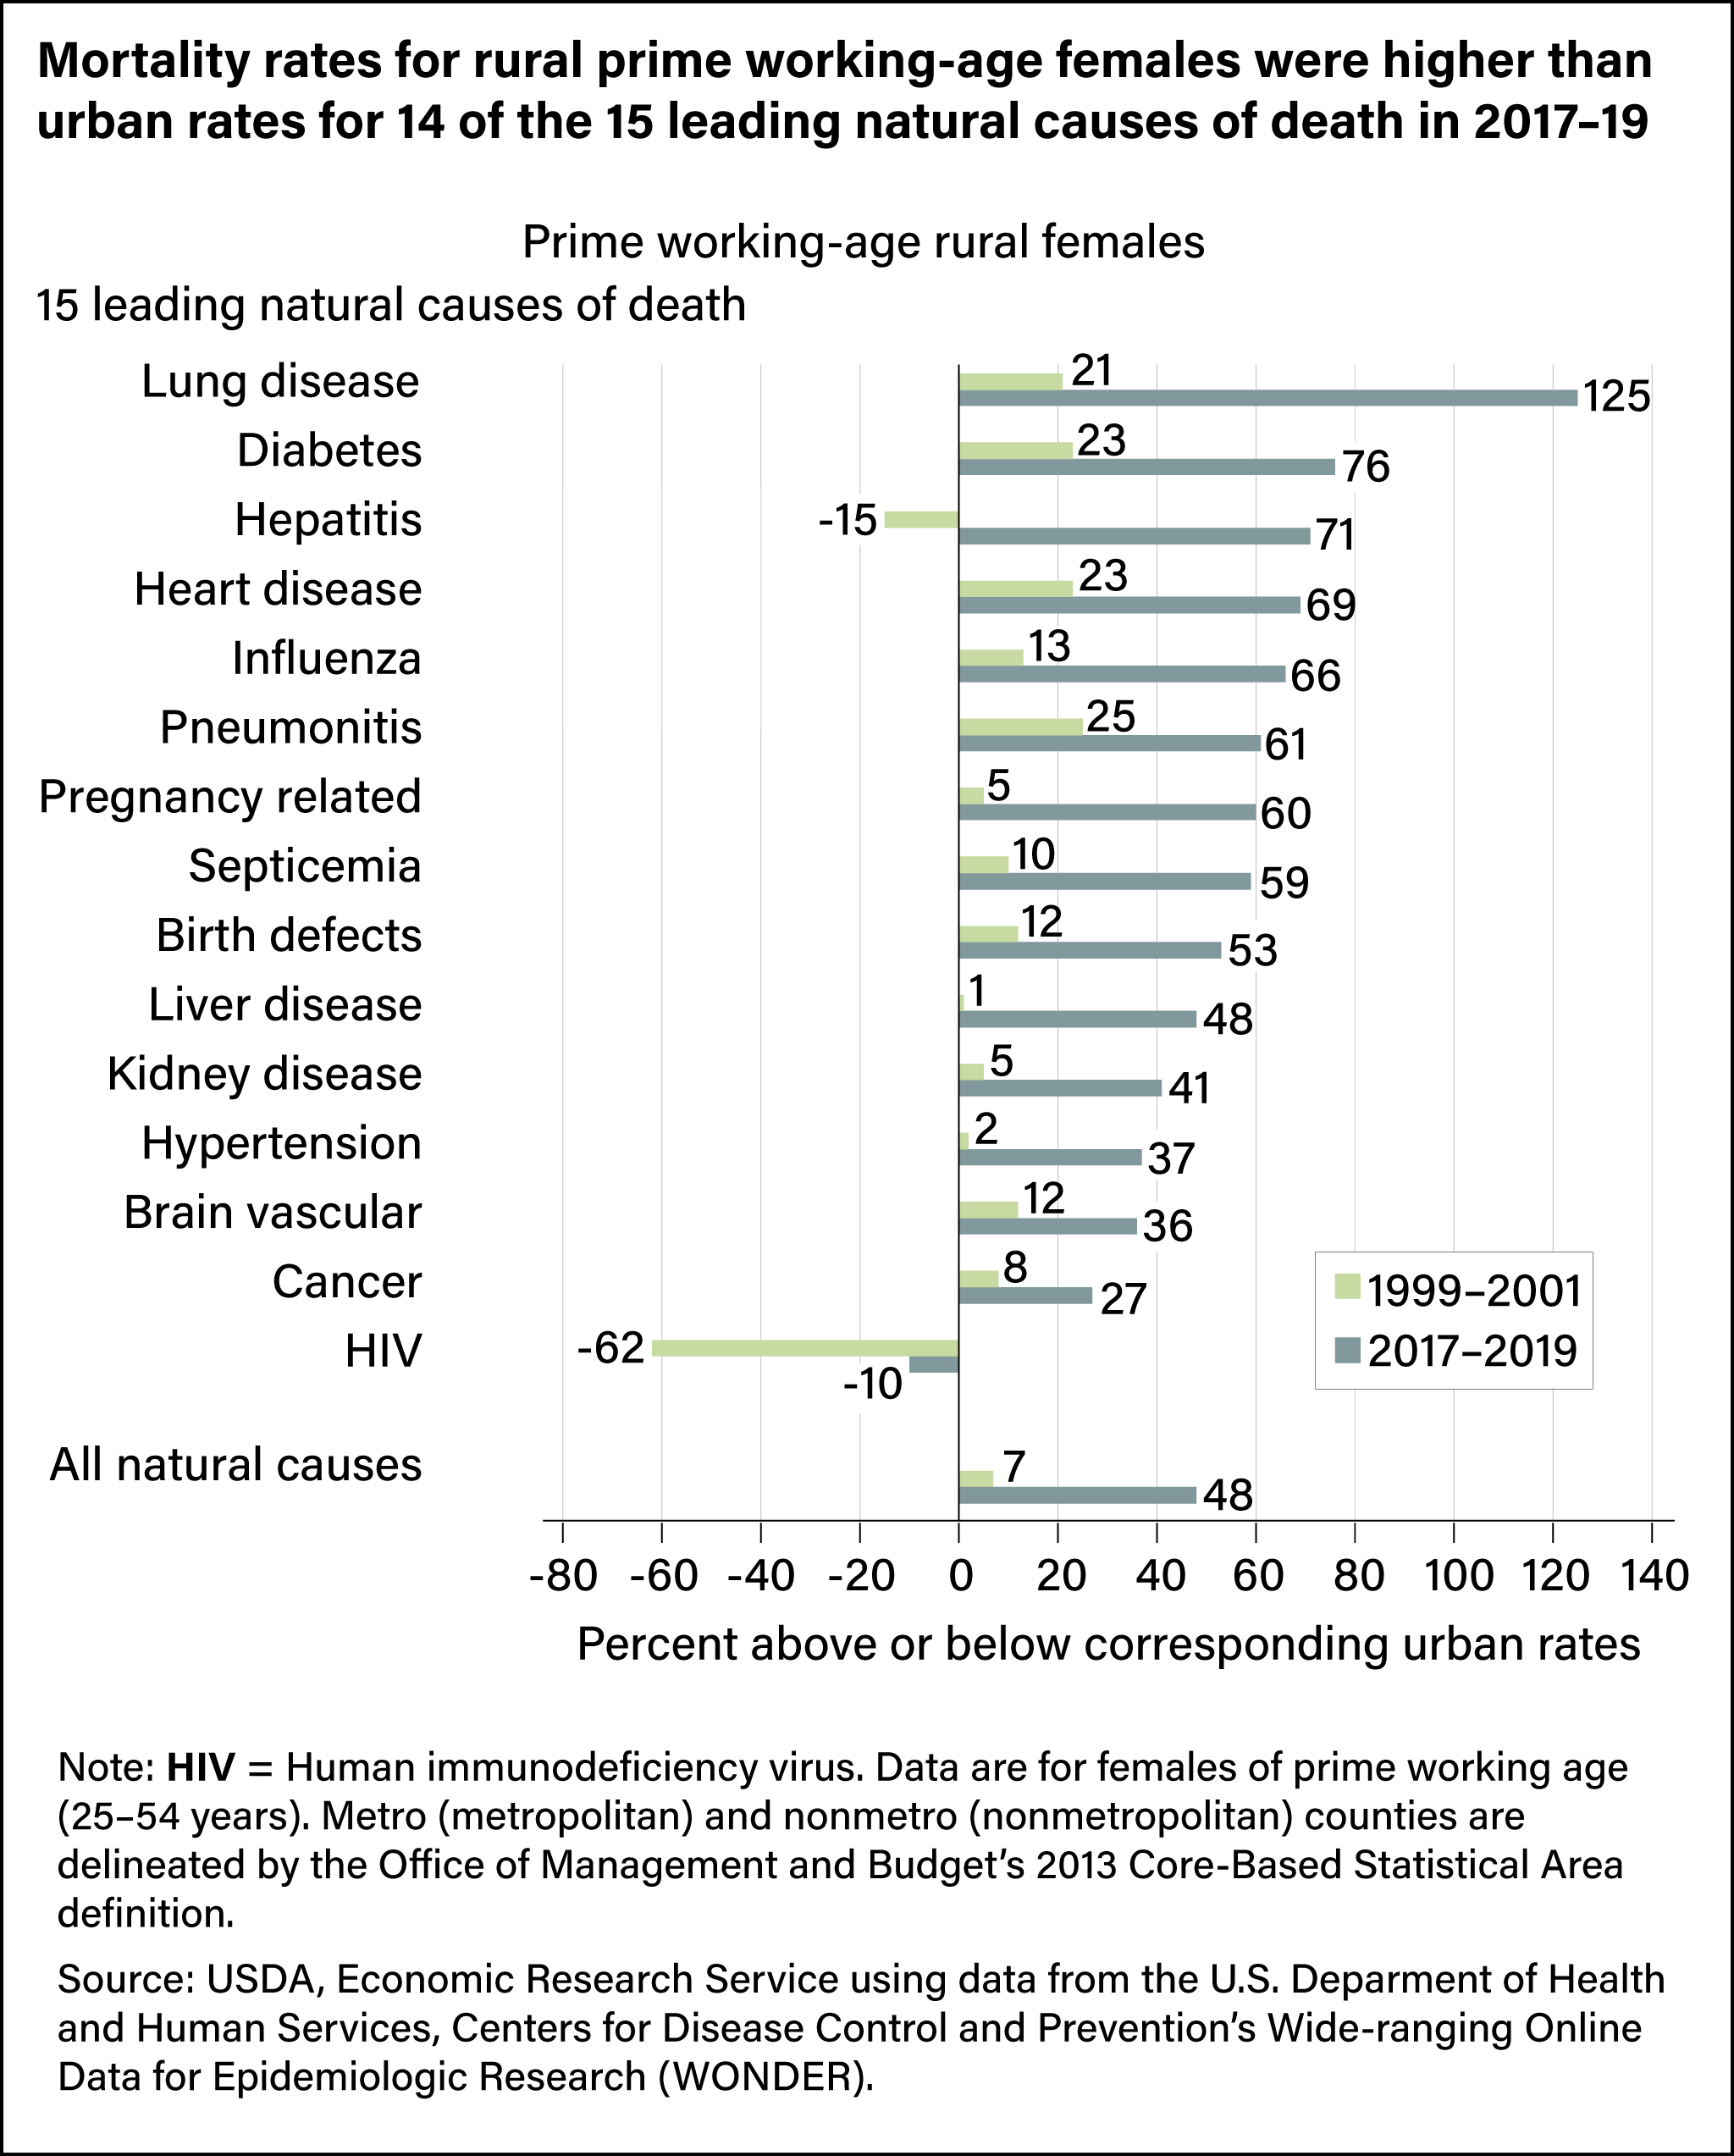
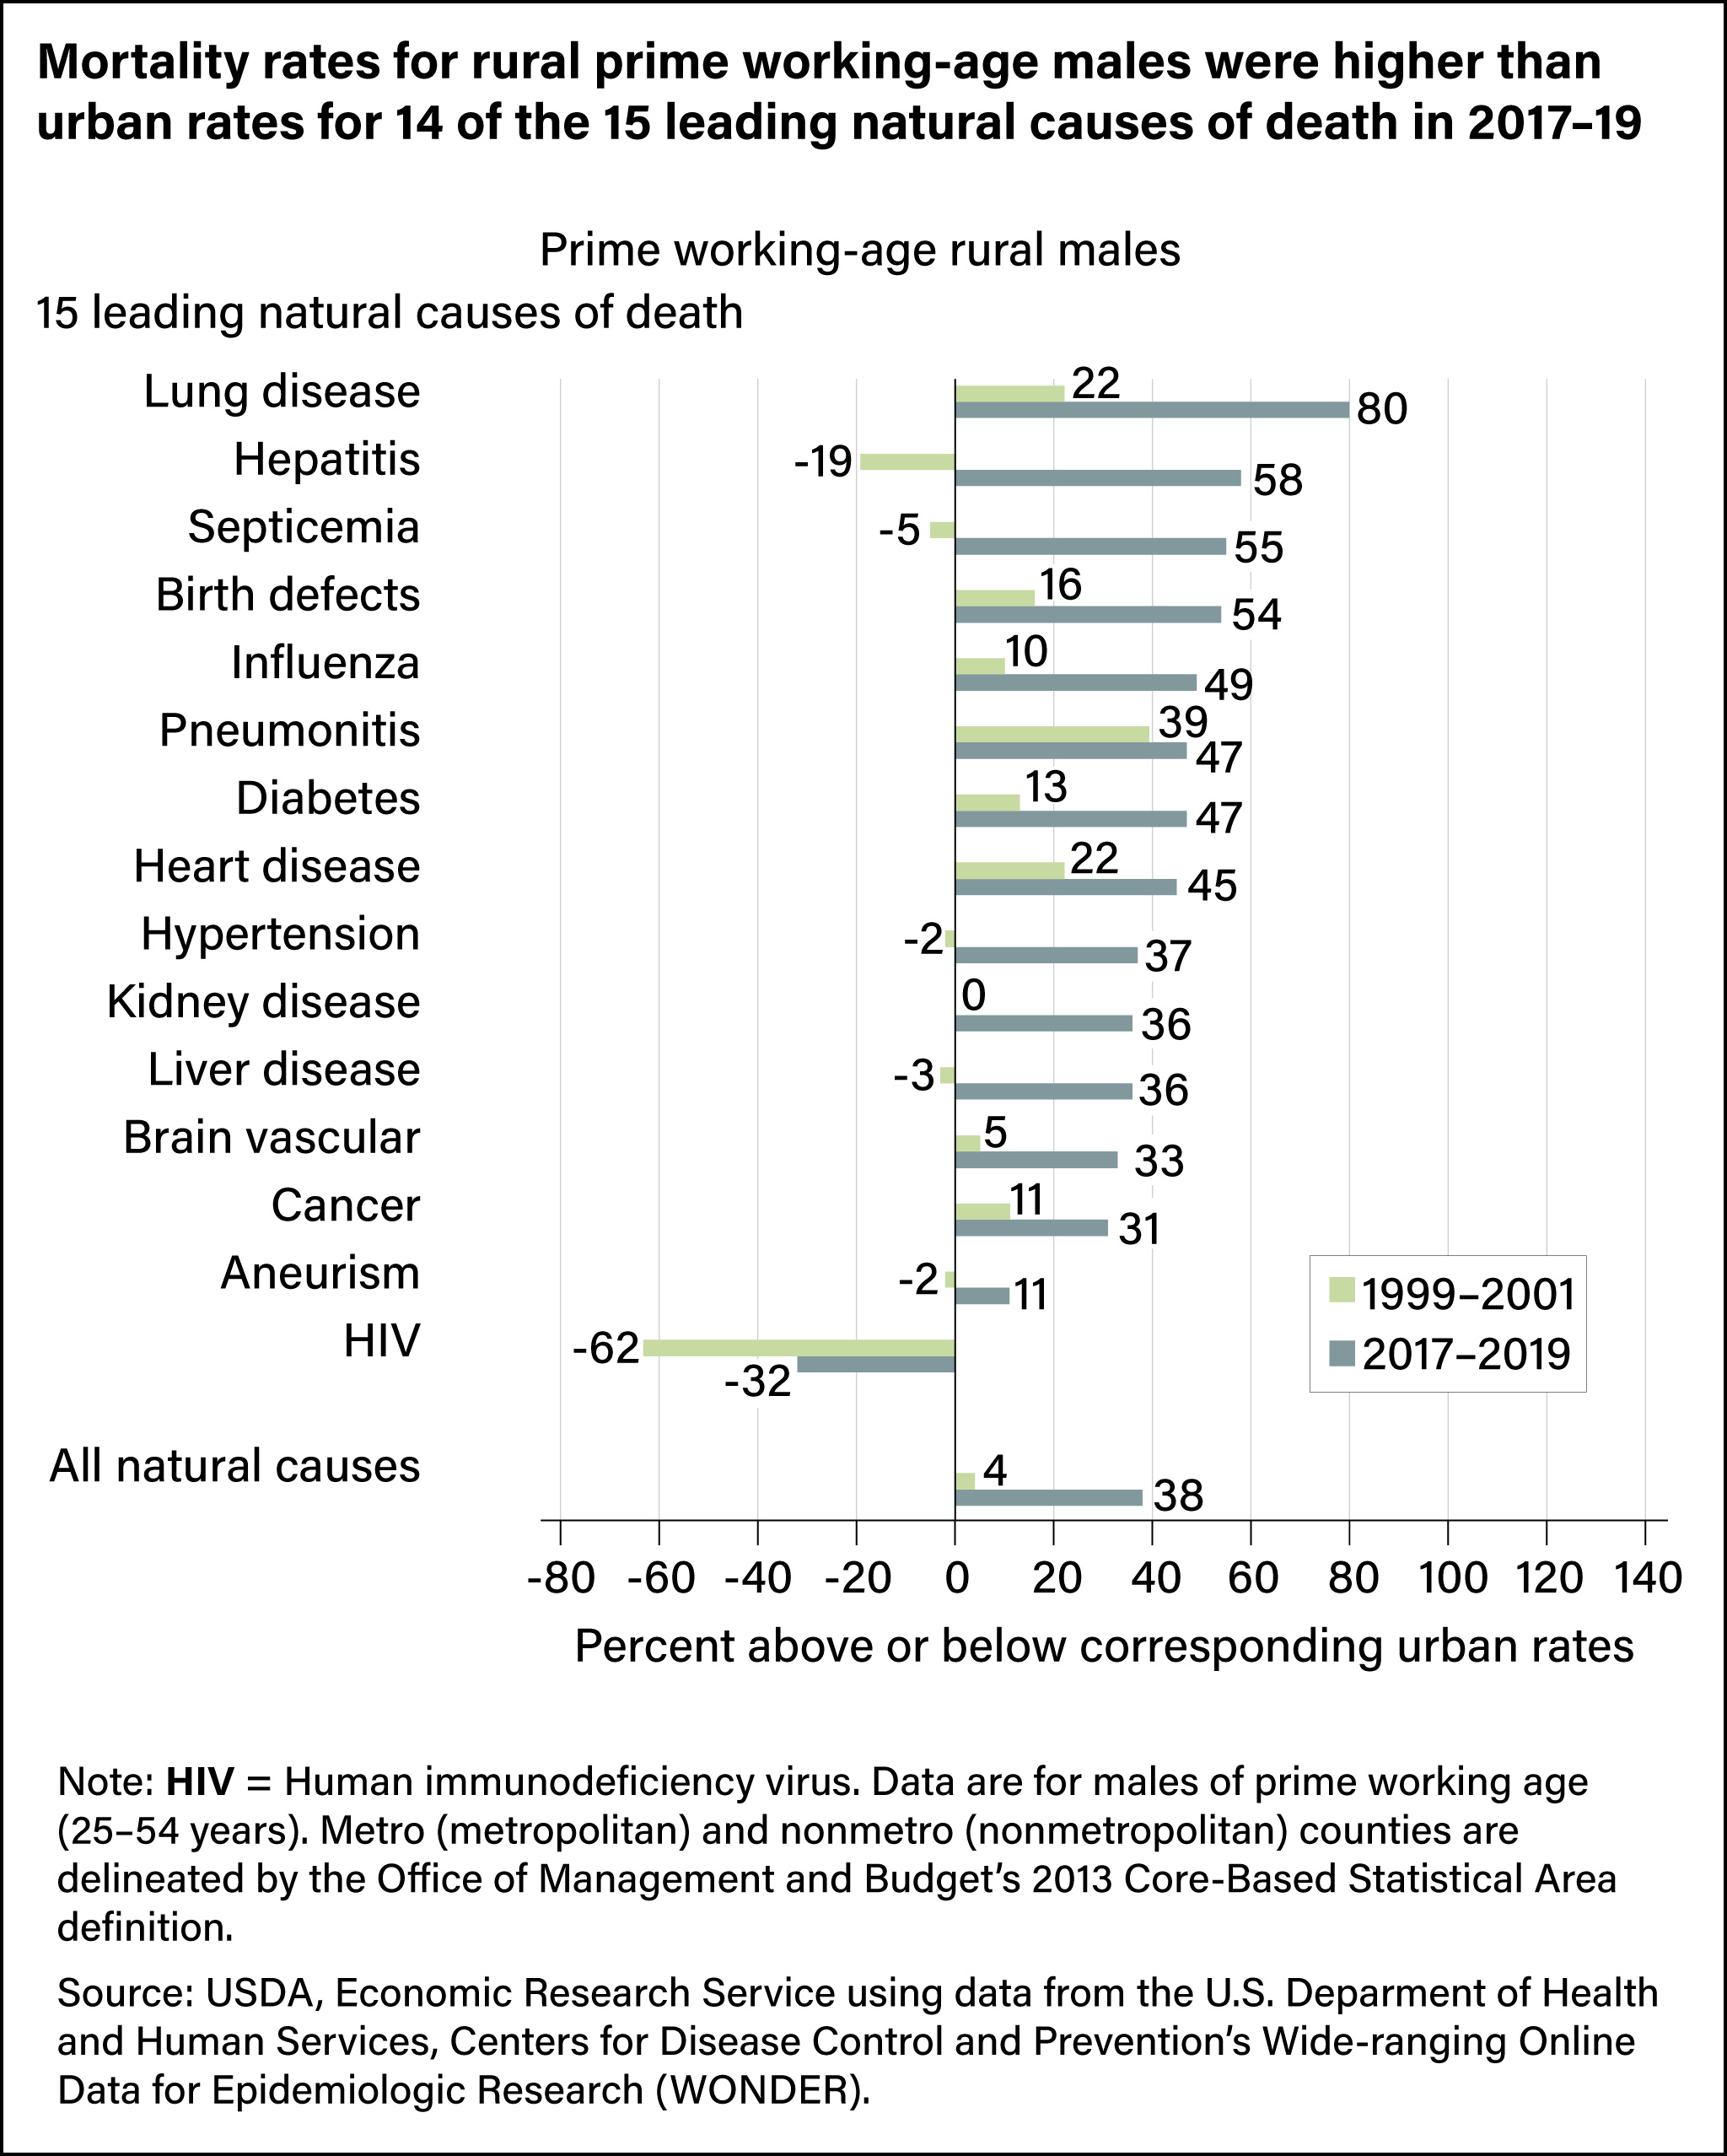
In 2017–19, mortality rates for most leading causes of death for both sexes were higher in rural areas than in urban areas, except for deaths from human immunodeficiency virus, or HIV. Mortality rates from all natural causes for prime working-age females were 48-percent higher in rural areas than in urban areas, compared with 38 percent for males. Both represented notable increases from the differences in 1999–2001, when the rates for rural females were 7 percent higher than for urban females and the rates for rural males were 4 percent higher.
A closer look at specific causes of death shows even greater disparities, especially between rural and urban females. In the most recent period, lung disease was the largest cause of death differential, at 125 percent, between rural and urban females. Some other natural causes of death for females with differences greater than 50 percent between rural and urban areas included diabetes (76 percent), hepatitis (71 percent), heart disease (69 percent), influenza (66 percent), pneumonitis (61 percent), and pregnancy-related deaths (60 percent). Lung disease also was the cause of death with the largest difference for males in 2017–2019, with 80 percent more deaths in rural areas than in urban areas. Hepatitis (58 percent), septicemia (55 percent), and birth defects (54 percent) were also more than 50 percent higher for males in rural areas than in urban areas.
Examining changes in specific causes of death gives more context as to what may be driving the widening rural-urban mortality gap. The largest increase from natural causes for prime working-age females was in pregnancy-related deaths, which surged by 313 percent. However, the mortality rate from those deaths was less than 2.5 in 2017–2019. For rural prime working-age males, mortality rates from hypertension rose the most, climbing by 132 percent. The mortality rate from those deaths was 3.0 in 2017–2019. Cancer mortality rates were the highest cause of death for rural prime working-age females in 2017–2019 (52.0 per 100,000 females) and the second highest for rural prime working-age males, but fell for both groups. Heart disease mortality rates were the opposite, highest for prime working-age males in 2017–2019 (68.8 per 100,000 males) and second highest for prime working-age females, although they decreased for males from the 1999–2001 rate and rose for females.
| Females | Males | |||||
|---|---|---|---|---|---|---|
| Nonmetro mortality rate |
Percent change, 1999–2001 to 2017–2019 |
Nonmetro mortality rate |
Percent change, 1999–2001 to 2017–2019 |
|||
| Cause of death | 1999–2001 | 2017–2019 | 1999–2001 | 2017–2019 | ||
| Cancer | 60.9 | 52.0 | -15 | 61.3 | 47.6 | -22 |
| Heart disease | 28.6 | 33.7 | 18 | 73.4 | 68.8 | -6 |
| Liver disease | 4.8 | 9.7 | 103 | 12.4 | 16.2 | 31 |
| Diabetes | 6.0 | 8.7 | 45 | 8.2 | 12.9 | 58 |
| Lung disease | 4.3 | 7.4 | 73 | 4.4 | 5.7 | 30 |
| Brain vascular | 7.6 | 6.5 | -14 | 8.2 | 8.6 | 4 |
| Septicemia | 2.4 | 3.8 | 61 | 2.5 | 4.2 | 68 |
| Influenza | 2.3 | 3.7 | 60 | 3.3 | 4.3 | 28 |
| Kidney disease | 1.9 | 2.8 | 43 | 2.5 | 3.9 | 57 |
| Pregnancy-related | 0.5 | 2.2 | 313 | n/a | n/a | n/a |
| Birth defects | 1.4 | 1.6 | 18 | 1.7 | 1.9 | 13 |
| Hypertension | 0.8 | 1.6 | 89 | 1.3 | 3.0 | 132 |
| HIV | 2.1 | 1.1 | -49 | 6.6 | 2.1 | -67 |
| Pneumonitis | 0.5 | 0.9 | 78 | 0.8 | 1.0 | 23 |
| Hepatitis | 1.0 | 0.9 | -15 | 2.7 | 1.5 | -46 |
| Aneurism | n/a | n/a | n/a | 1.3 | 1.5 | 12 |
| All natural causes | 152.6 | 176.3 | 16 | 228.9 | 232.5 | 2 |
Note: Data are for prime working-age adults (25–54 years old). Mortality rates are deaths per 100,000 males or females. Causes of death are ordered by nonmetro rates in 2017–2019. Aneurism was not one of the top 15 causes of death for females, so data are not available. Nonmetro (rural) counties are delineated by the Office of Management and Budget’s 2013 Core-Based Statistical Area definition.
Source: USDA, Economic Research Service using data from the U.S. Department of Health and Human Services, Centers for Disease Control and Prevention’s Wide-ranging Online Data for Epidemiologic Research (WONDER)
This article is drawn from:
- Thomas (Conley), K.L., Dobis, E.A. & McGranahan, D. (2024). The Nature of the Rural-Urban Mortality Gap. U.S. Department of Agriculture, Economic Research Service. EIB-265.
You may also like:
- Rural Economy & Population. (n.d.). U.S. Department of Agriculture, Economic Research Service.
- Farm Household Well-being. (n.d.). U.S. Department of Agriculture, Economic Research Service.
- Winkler, R.L. & Petersen, J. (2024, September 26). Fewer People Are Moving Out of Rural Counties Since COVID-19. Amber Waves, U.S. Department of Agriculture, Economic Research Service.
- Dobis, E.A. & Todd, J.E. (2022, August 1). The Most Rural Counties Have the Fewest Health Care Services Available. Amber Waves, U.S. Department of Agriculture, Economic Research Service.
- Dobis, E.A. & Todd, J.E. (2022, July 5). Self-Employed Workers Are Less Likely To Have Health Insurance Than Those Employed by Private Firms, Governments. Amber Waves, U.S. Department of Agriculture, Economic Research Service.
- Farrigan, T., Genetin, B., Sanders, A., Pender, J., Thomas (Conley), K.L., Winkler, R.L. & Cromartie, J. (2024). Rural America at a Glance: 2024 Edition. U.S. Department of Agriculture, Economic Research Service. EIB-282.
We’d welcome your feedback!
Would you be willing to answer a few quick questions about your experience?