

Analyzing Food Sales Trends at the State Level Using New Series
- by Wilson Sinclair and Eliana Zeballos
- 6/6/2024
The USDA, Economic Research Service’s (ERS) Food Expenditure Series (FES) provides a comprehensive measure of the total value of all food purchases in the United States. The FES estimates food spending at both the national and State levels. The series tracks spending on food at home (FAH)—food often prepared at home, such as from grocery stores—and food away from home (FAFH)—food mostly prepared and consumed away from home, such as at restaurants. The series allows Government agencies, academic researchers, and industry stakeholders to assess and track developments in consumer food purchasing behaviors and the U.S. food supply.
In February 2024, ERS revised State-level estimates in a report addendum based on the Bureau of Labor Statistics’ Quarterly Census of Employment and Wages, following a similar methodology as the national-level FES.
State Food Expenditure Series Shows Variation in Food Sales in 2023
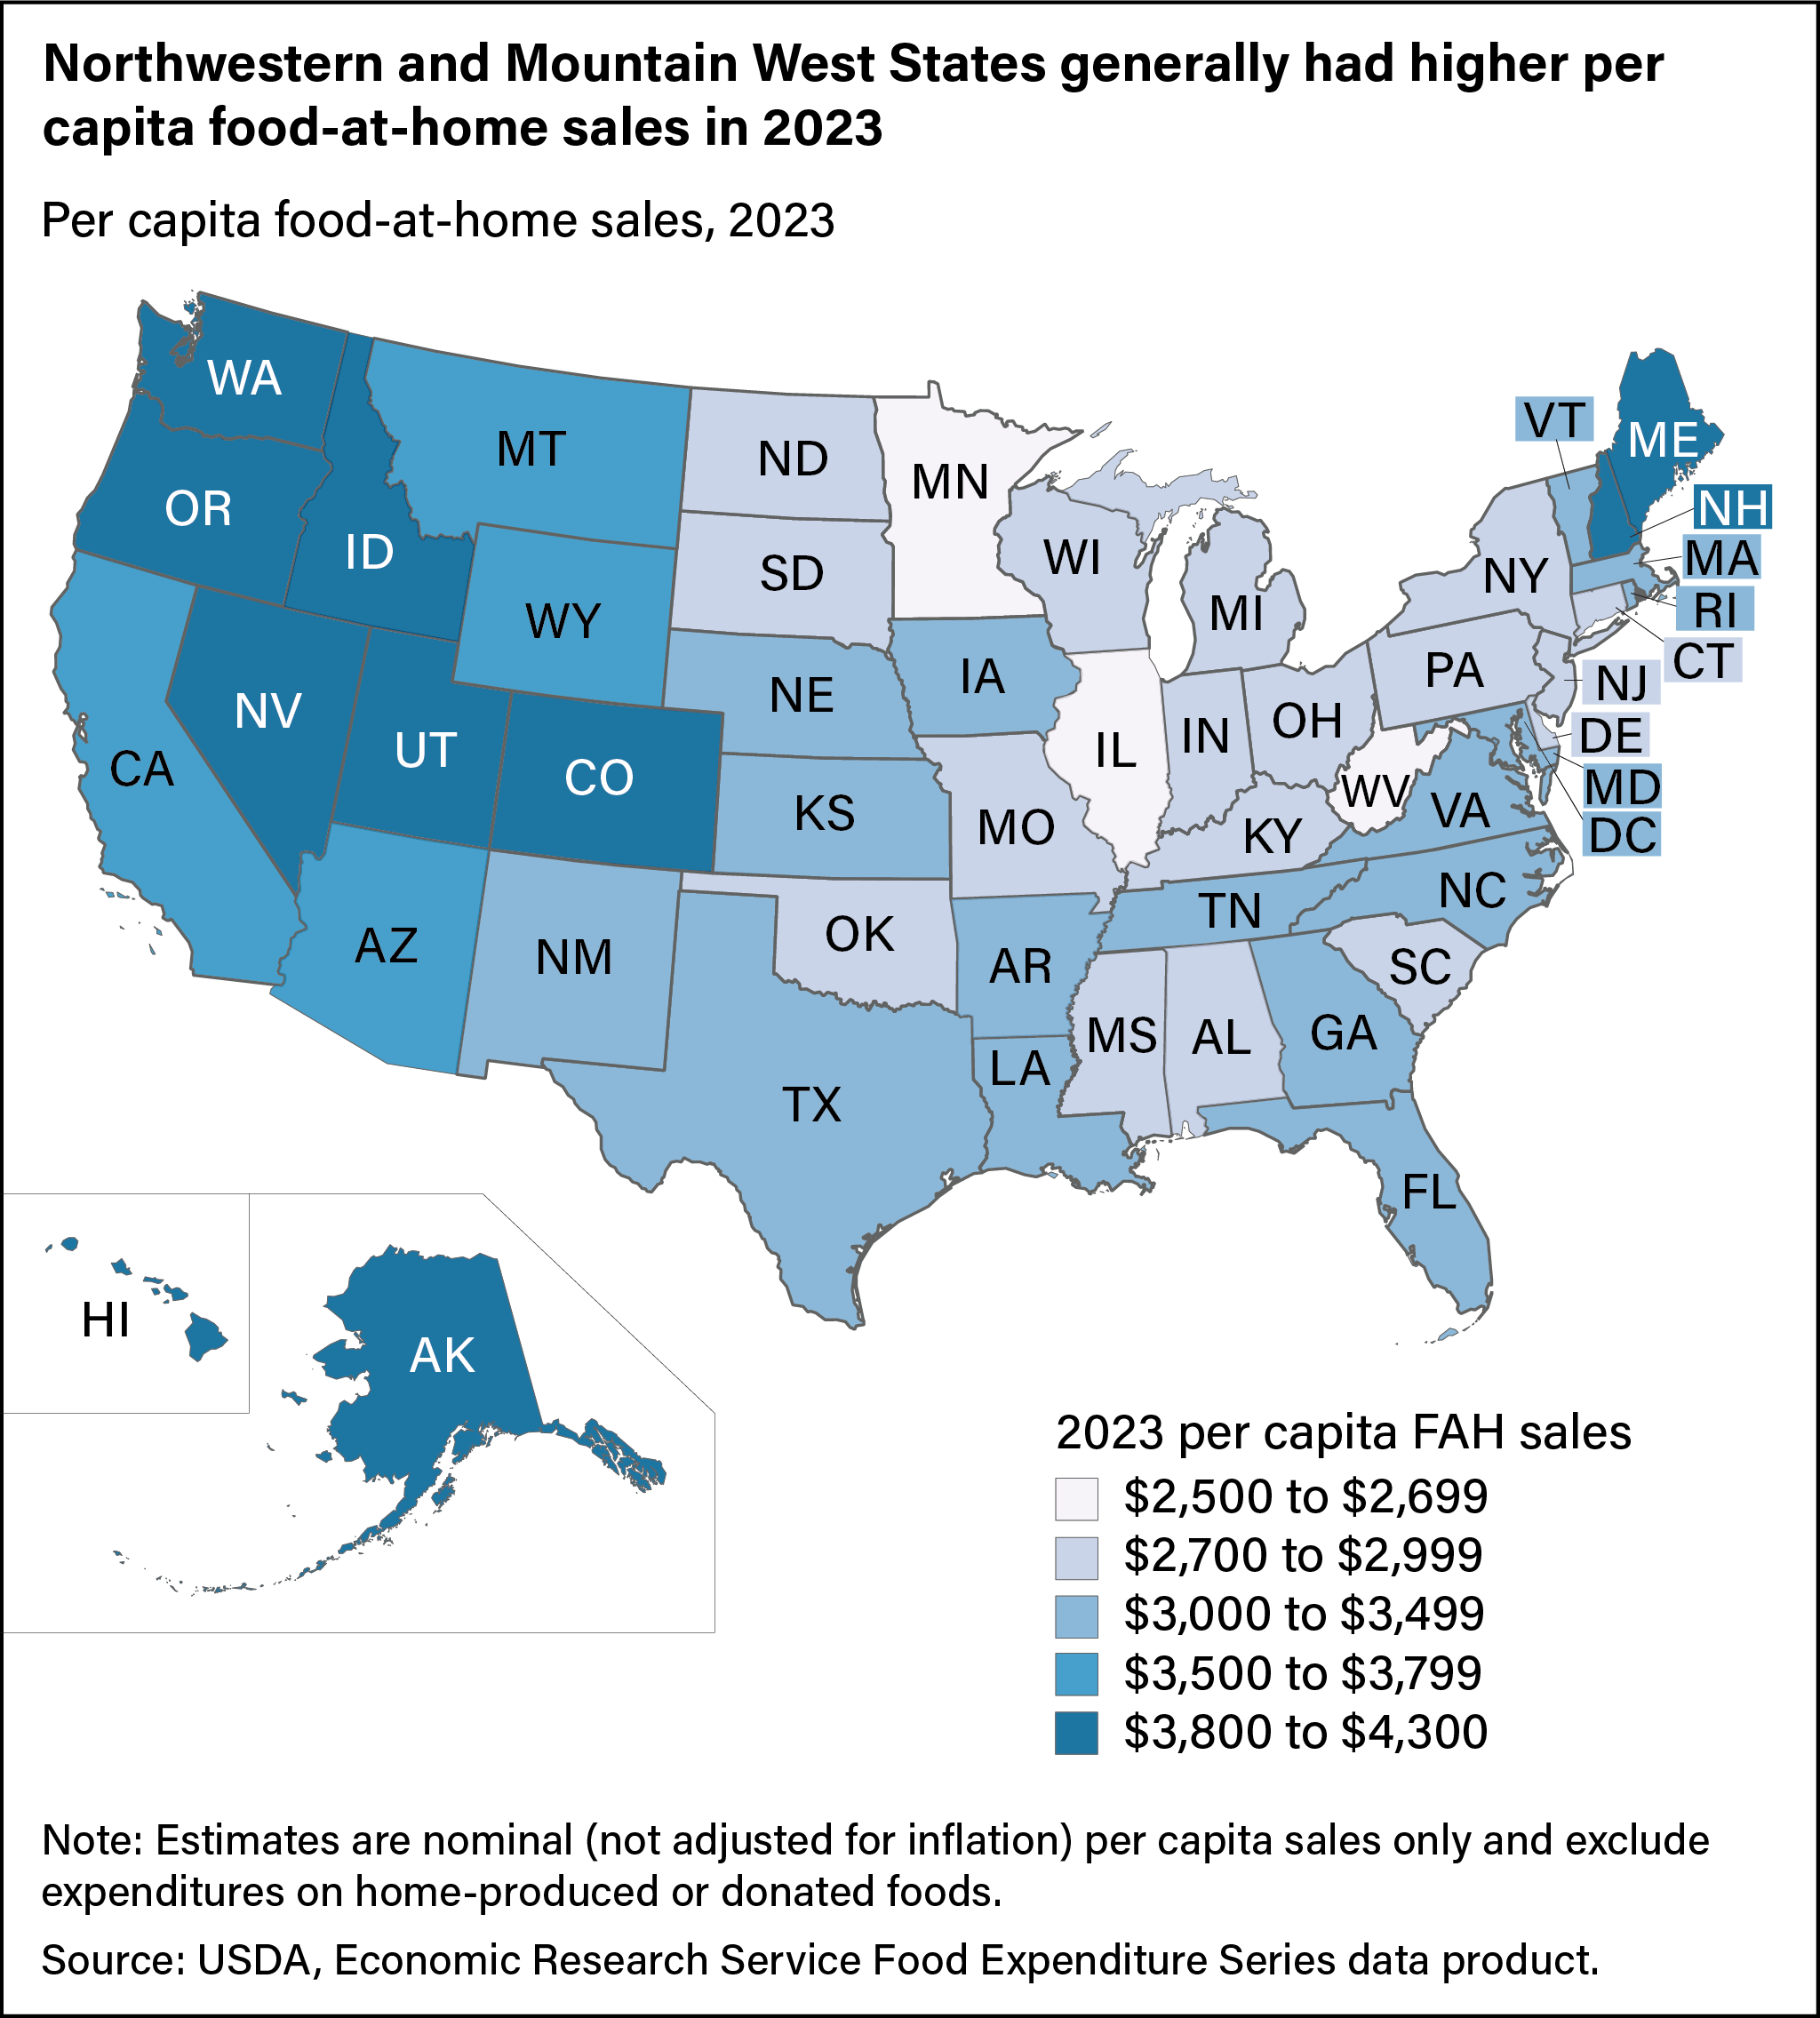
U.S. per capita food sales were $7,102 in 2023. However, there was great variation in food purchases across the States and between FAH and FAFH. Nationally, about 44.8 percent, or $3,179, of food purchases went toward FAH. Per capita FAH sales in 2023 ranged from a low of $2,503 in West Virginia to a high of $4,157 in Alaska. Higher per capita FAH sales were typically concentrated in the Northwestern and Mountain West States as Washington, Colorado, Oregon, and Utah rounded out the top five. Illinois, Minnesota, Indiana, and Oklahoma followed West Virginia with the lowest per capita FAH sales in 2023. Kansas was the median State for FAH sales at $3,130.
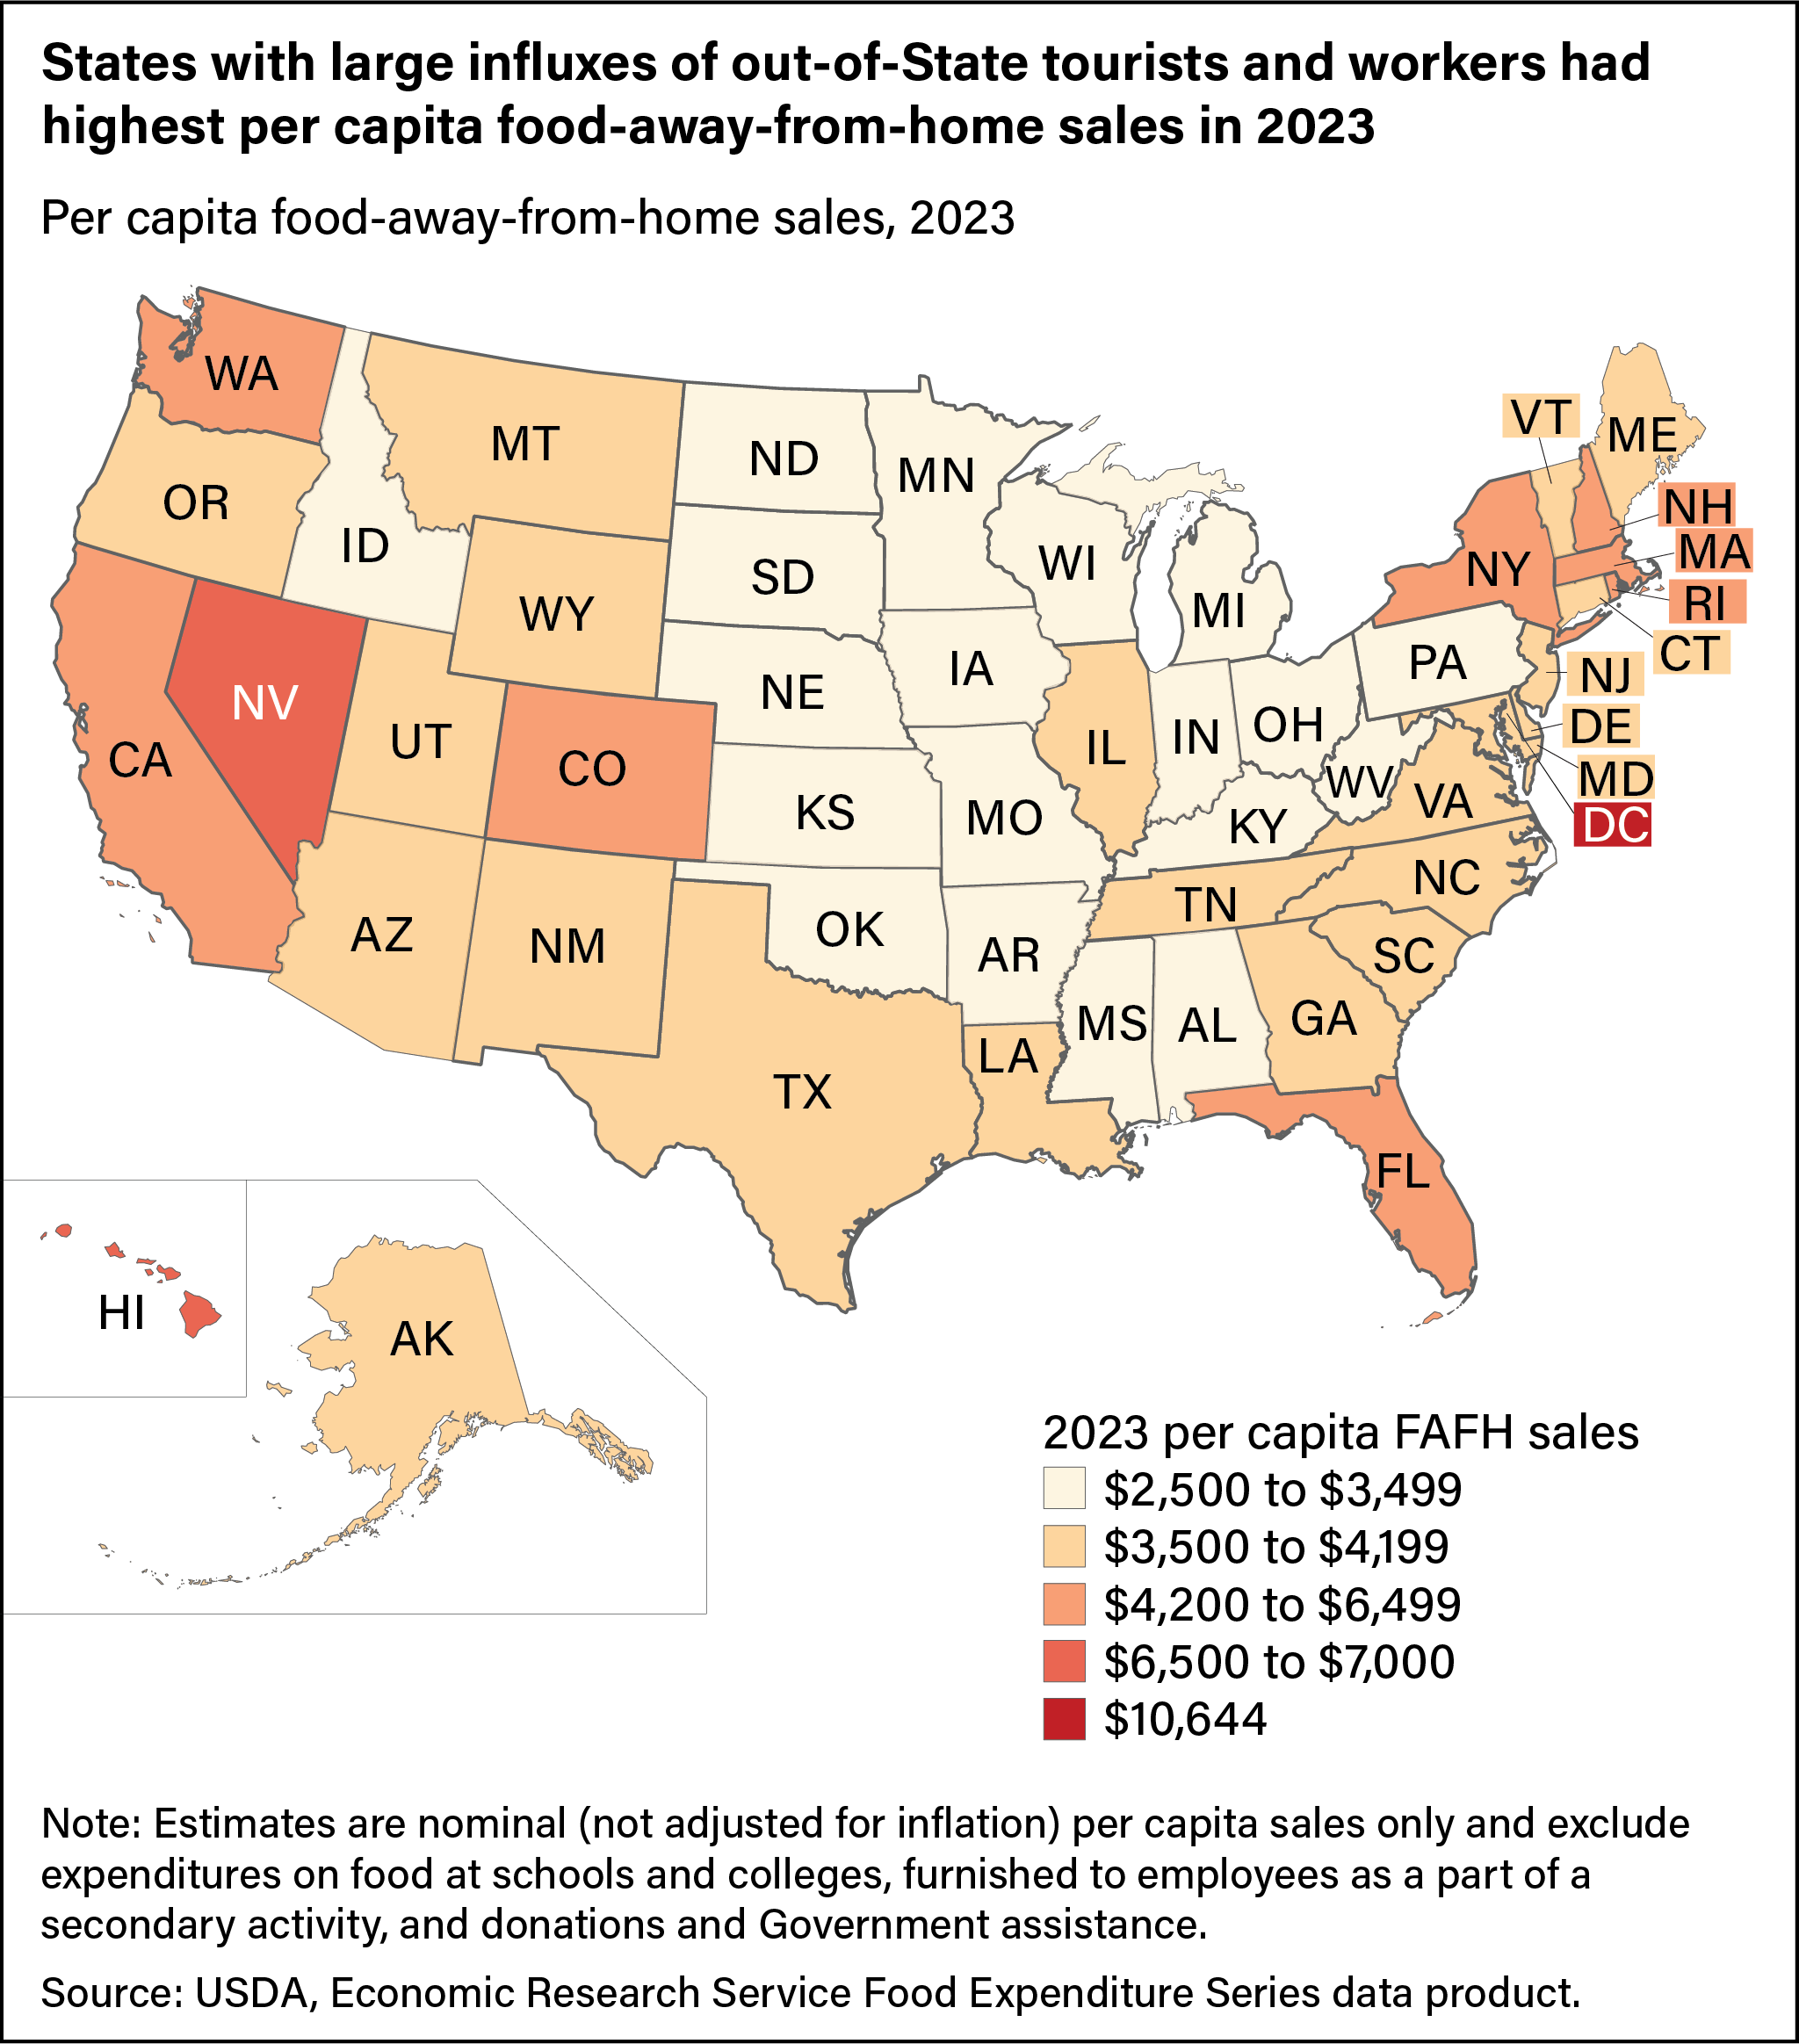
Per capita FAFH purchases in 2023 were higher nationally than any year on record at $3,923. However, per capita FAFH sales were more uneven across States than FAH. In 2023, Washington, DC ($10,644), Nevada ($6,907) and Hawaii ($6,679) had the highest per capita FAFH sales in the United States, each more than 30 percent higher than the fourth highest State of California at $5,133. Possible factors for these outliers include tourism for all three areas as well as interstate commuting employees in Washington, DC. Tourists and commuters may tend to spend more on FAFH than on FAH, a relatively more costly form of food purchases, in the States they are visiting. West Virginia had the lowest per capita FAFH purchases in 2023 at $2,597, followed by Iowa ($2,789), Wisconsin ($2,872), Arkansas ($2,896), and Alabama ($2,926). North Carolina had the median per capita sales for FAFH at $3,610.
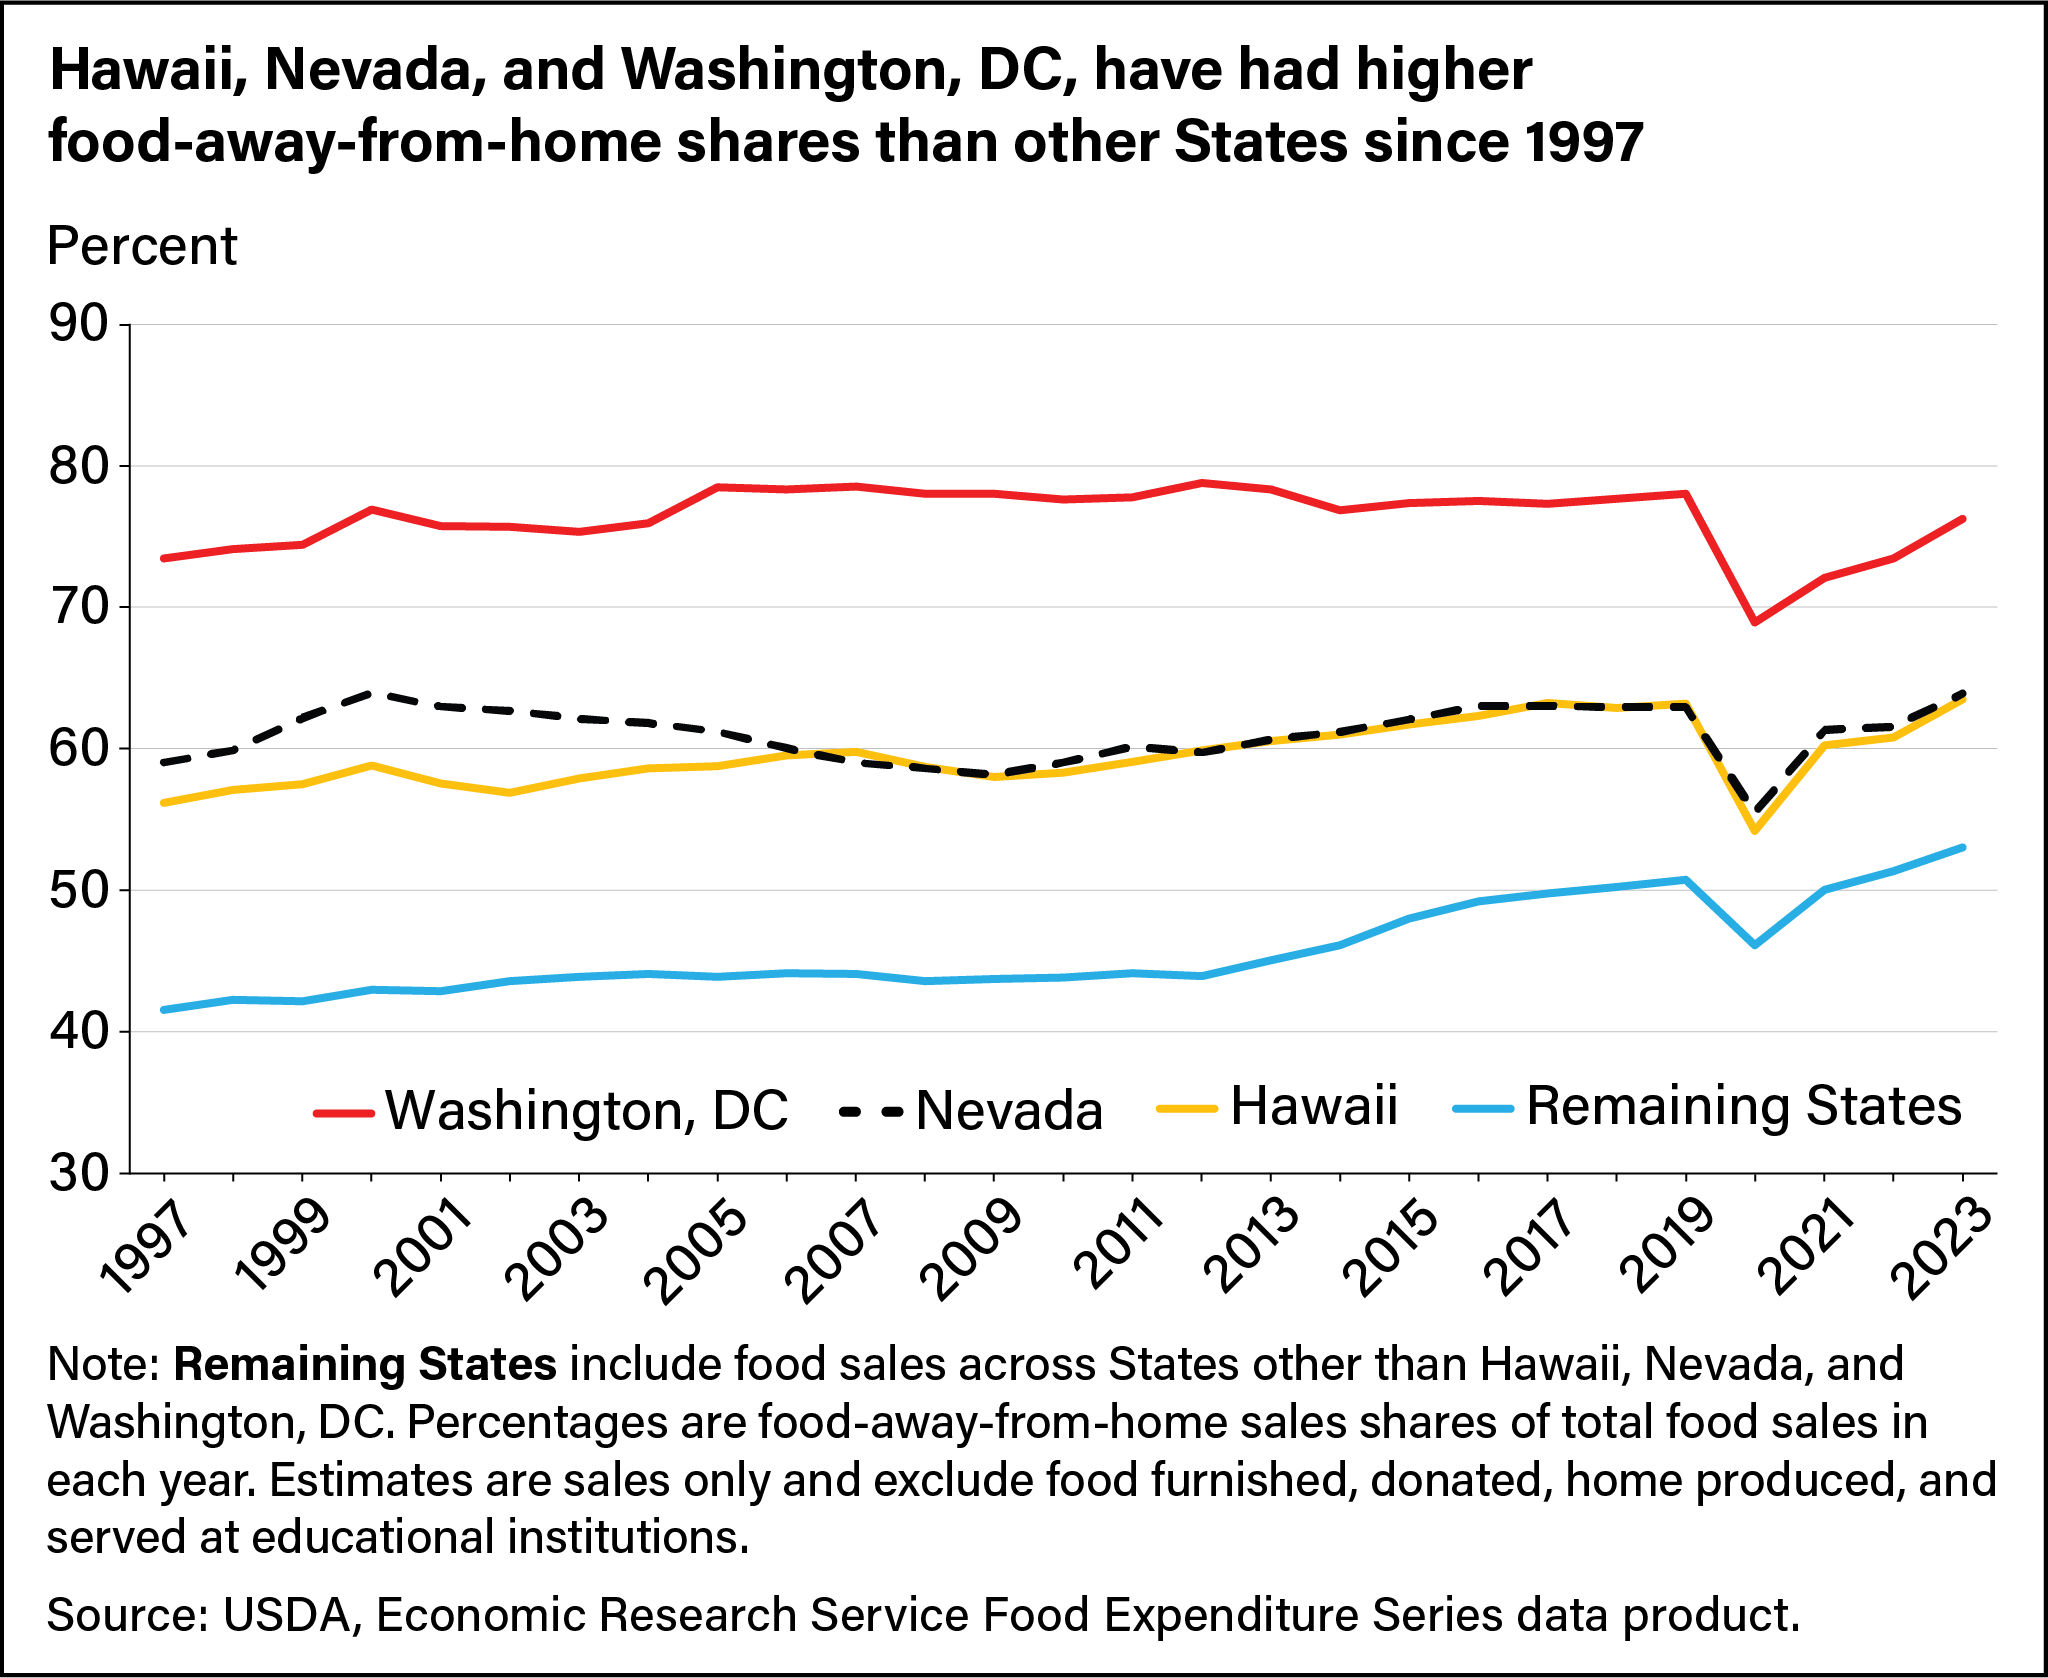
Hawaii, Nevada, and Washington, DC, are outliers for the food-away-from-home shares of total food sales, a consistent trend from 1997 to 2023. In 1997, 41.6 percent of food sales in the remaining States were FAFH sales, which was considerably lower than the share in Washington, DC (73.5 percent), Nevada (59.0 percent), and Hawaii (56.2 percent). In 2023, the per capita FAFH share was 76.2 percent for Washington, DC, 63.9 percent for Nevada, 63.5 percent for Hawaii, and 53.0 percent for the remaining States. These three outliers also experienced outsized disruptions in food sales patterns in 2020 during the Coronavirus (COVID-19) pandemic. In Washington, DC, the share of FAFH sales decreased 9.1 percentage points from 2019 to 2020, while Hawaii and Nevada’s FAFH share decreased 9.0 percentage points and 7.5 percentage points, respectively. The FAFH share in the remaining States decreased 4.6 percentage points.
In most States, the FAFH share grew rapidly from 2020 to 2023. Nevada’s and Hawaii’s FAFH share grew at least 8 percentage points over the 3 years, while all other States grew 6.9 percentage points. While Washington, DC’s FAFH share grew 7.3 percentage points over the period, it remained over 12 percentage points higher than Nevada’s and Hawaii’s in 2023.
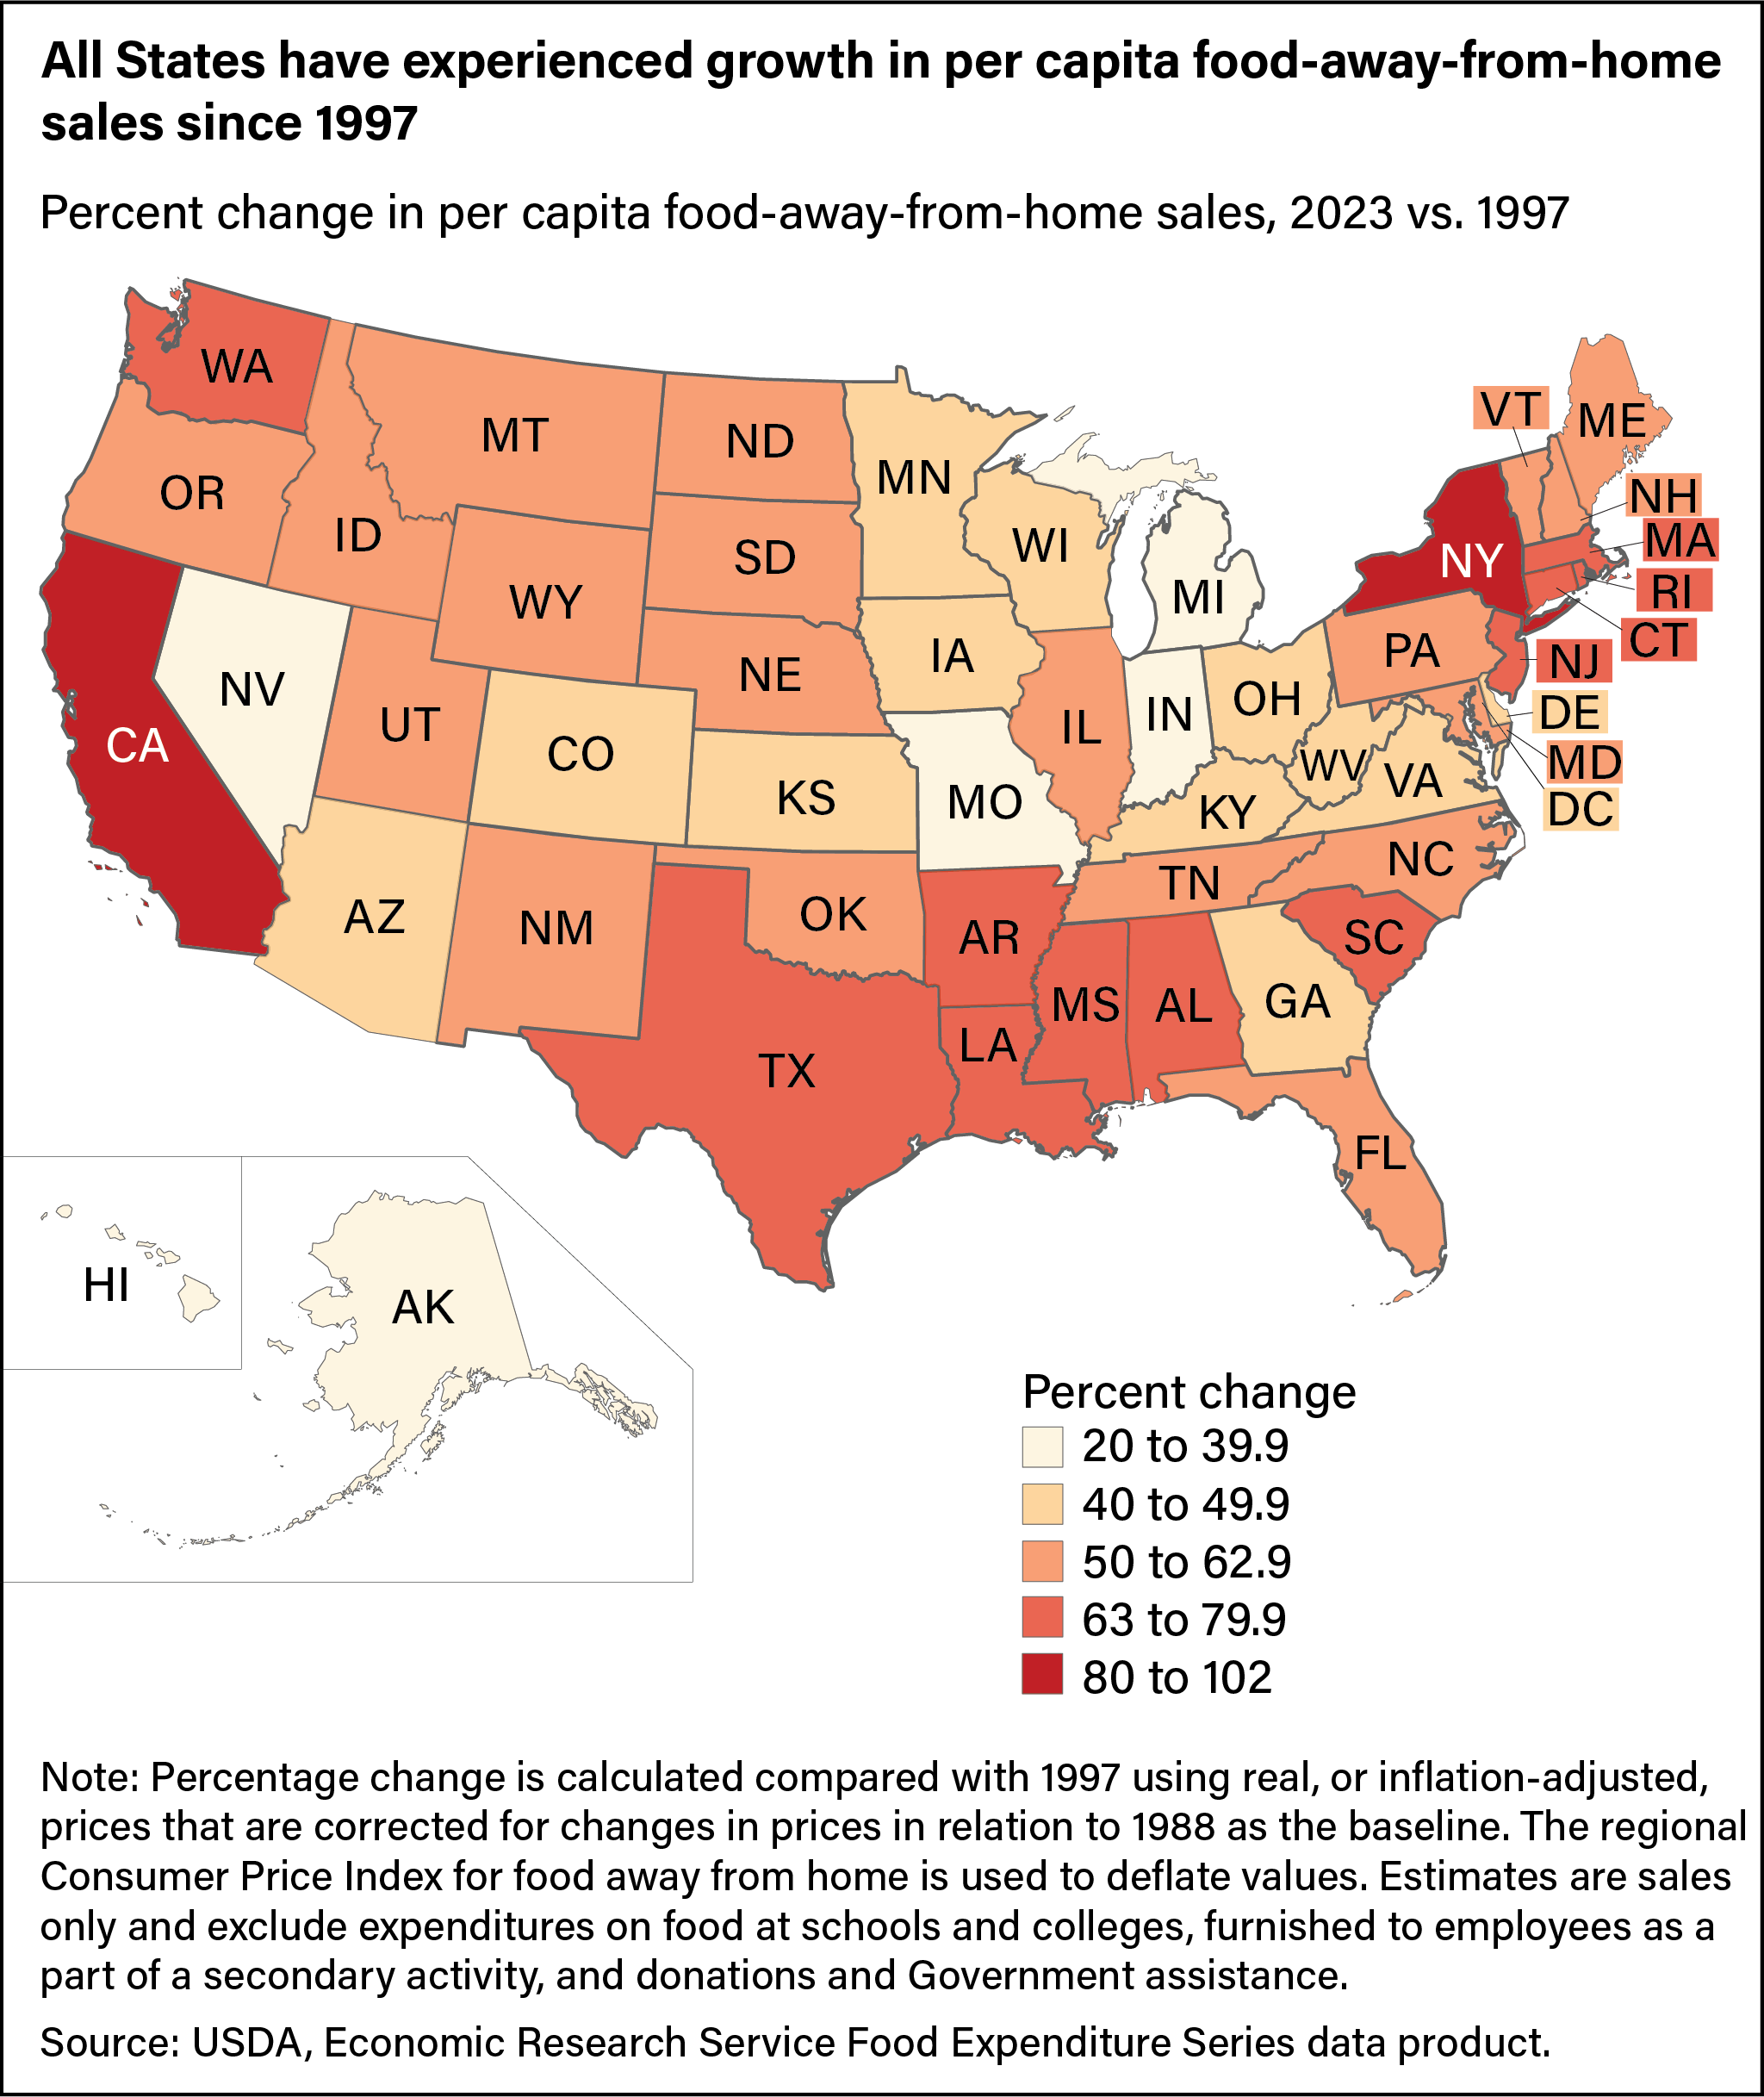
Food-Away-From-Home Sales Have Grown in All States; Food-at-Home Sales Have Grown in Most States
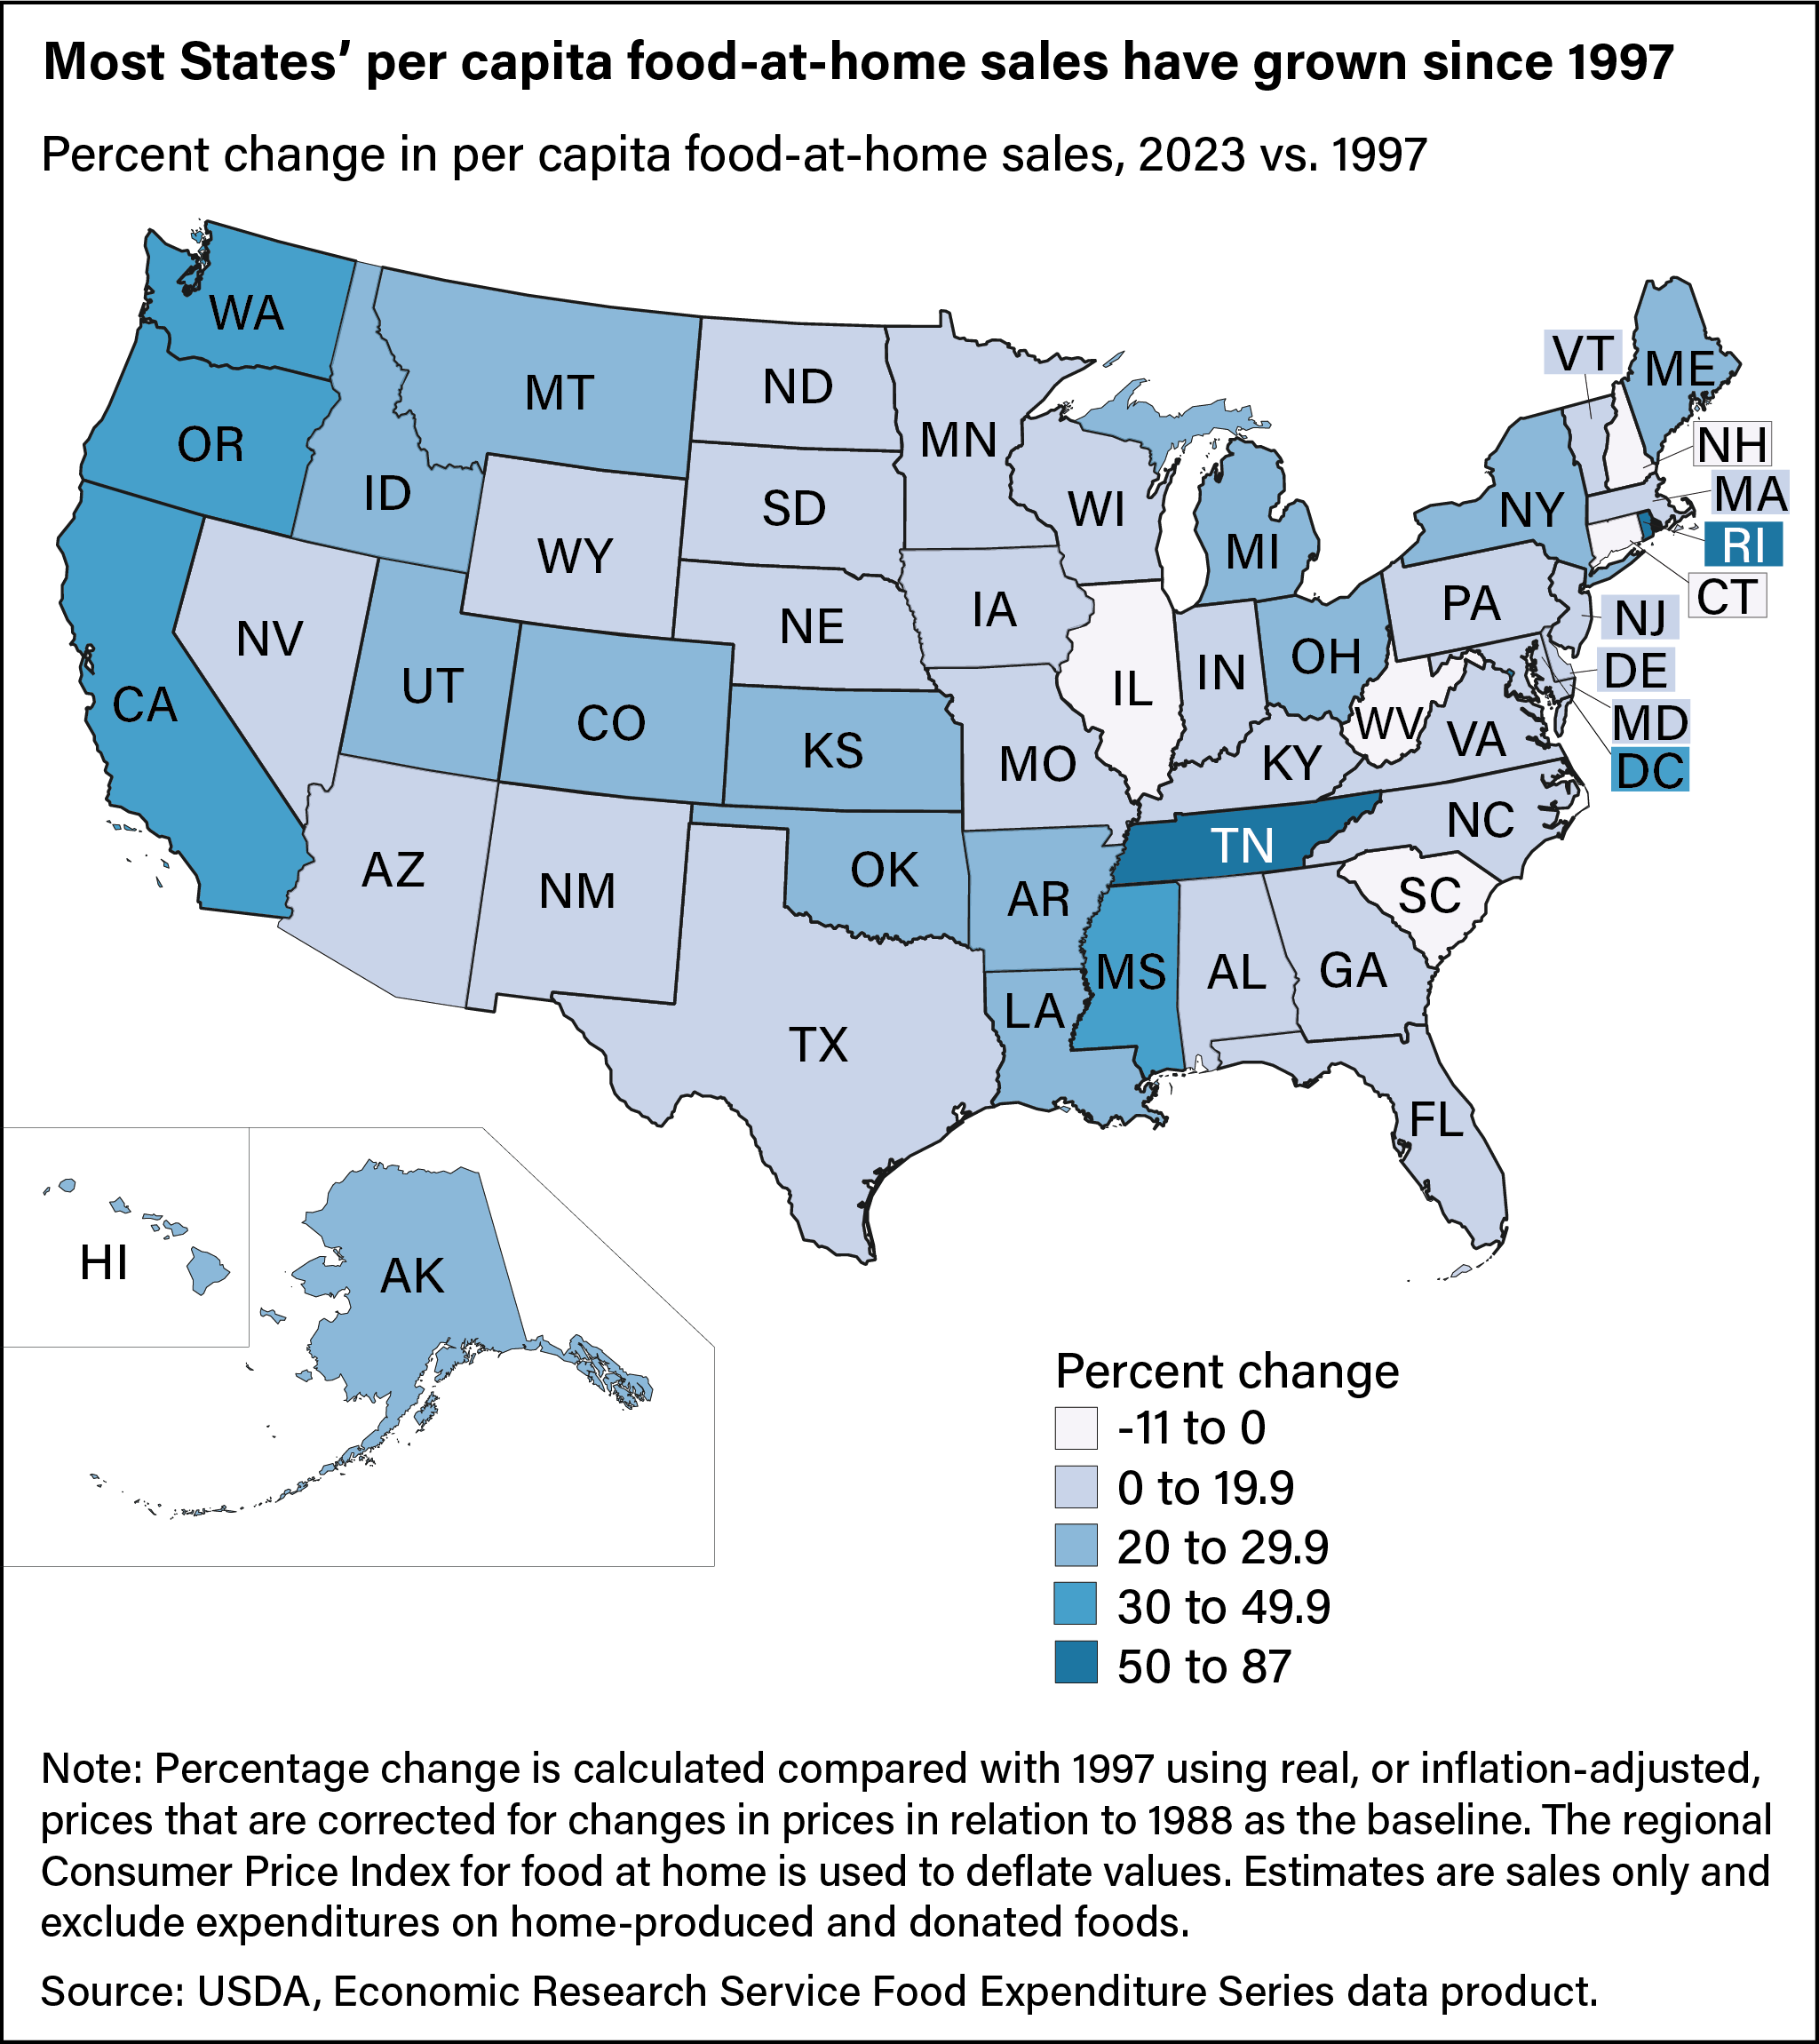
Food sales patterns changed greatly across States since the start of the State-level FES data in 1997, often without apparent regional patterns. To look at these State-level food sales trends over time, population movement and regional price differences are controlled by deflating sales using a regional Consumer Price Index and dividing by population estimates for each State. Nationally, per capita, inflation-adjusted total food purchases increased 38.4 percent between 1997 and 2023, and FAH sales grew by 18.0 percent. Five States saw declines in FAH purchases during this period: South Carolina (11.0 percent), Illinois (7.4 percent), West Virginia (7.1 percent), Connecticut (5.2 percent), and New Hampshire (1.9 percent). The largest growth in per capita FAH sales was concentrated in the Eastern United States as Rhode Island (86.5 percent), Tennessee (63.6 percent), and Washington, DC, (46.4 percent) had the largest growth. The State with the median FAH growth was Arizona at 16.0 percent.
From 1997 to 2023, per capita, inflation-adjusted food-away-from-home sales grew in all U.S. States. North Dakota had the median growth across States, with FAFH sales increasing 54.5 percent since 1997. FAFH purchases more than doubled in New York since 1997, increasing 101.7 percent, the largest State-level increase. California’s FAFH sales increased 97.1 percent, and Mississippi’s increased 77.6 percent. Nevada had a 21.4-percent increase in FAFH purchases since 1997, less than any other State. The other two outliers for FAFH shares also had relatively low growth in FAFH sales: Hawaii (37.2 percent) and Washington, DC (49.8 percent).
This article is drawn from:
- Food Expenditure Series. (n.d.). U.S. Department of Agriculture, Economic Research Service.
- Zeballos , E. & Sinclair, W. (2023). Estimating the State-Level Food Expenditure Series. U.S. Department of Agriculture, Economic Research Service. TB-1962.
- Zeballos, E. & Sinclair, W. (2024). State Food Expenditure Series . USDA, Economic Research Service.
You may also like:
- Zeballos , E. & Sinclair, W. (2021, October 4). Food Spending by U.S. Consumers Fell Almost 8 Percent in 2020. Amber Waves, U.S. Department of Agriculture, Economic Research Service.
- Zeballos , E. & Sinclair, W. (2023, September 25). U.S. Consumers Spent More on Food in 2022 Than Ever Before, Even After Adjusting for Inflation. Amber Waves, U.S. Department of Agriculture, Economic Research Service.