Energy Payments to Farmers Vary According to Farm Size, Energy Markets, Location
- by Justin B. Winikoff and Karen Maguire
- 7/9/2024
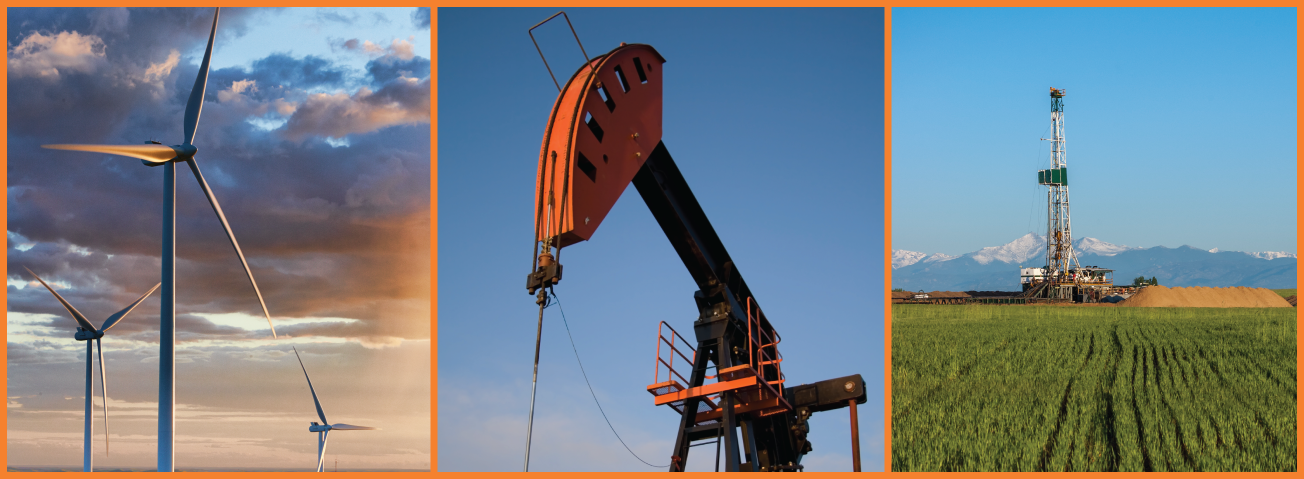
From 2011 to 2020, about 3.5 percent of U.S. farm operations received payments for hosting commercial energy production from resources such as oil, natural gas, and wind power on their land. The payments can be a source of significant income for farm operators. During the period, farmers received an annual average of $30,482 (in 2020 U.S. dollars) in commercial energy payments per farm, about 30 percent of a typical operation’s off-farm income. Average annual energy payments during that time also were higher than what farmers received through Government programs. USDA, Economic Research Service researchers found the size of energy payments to farm households are driven primarily by farm size, energy market conditions, and the location of the operation.
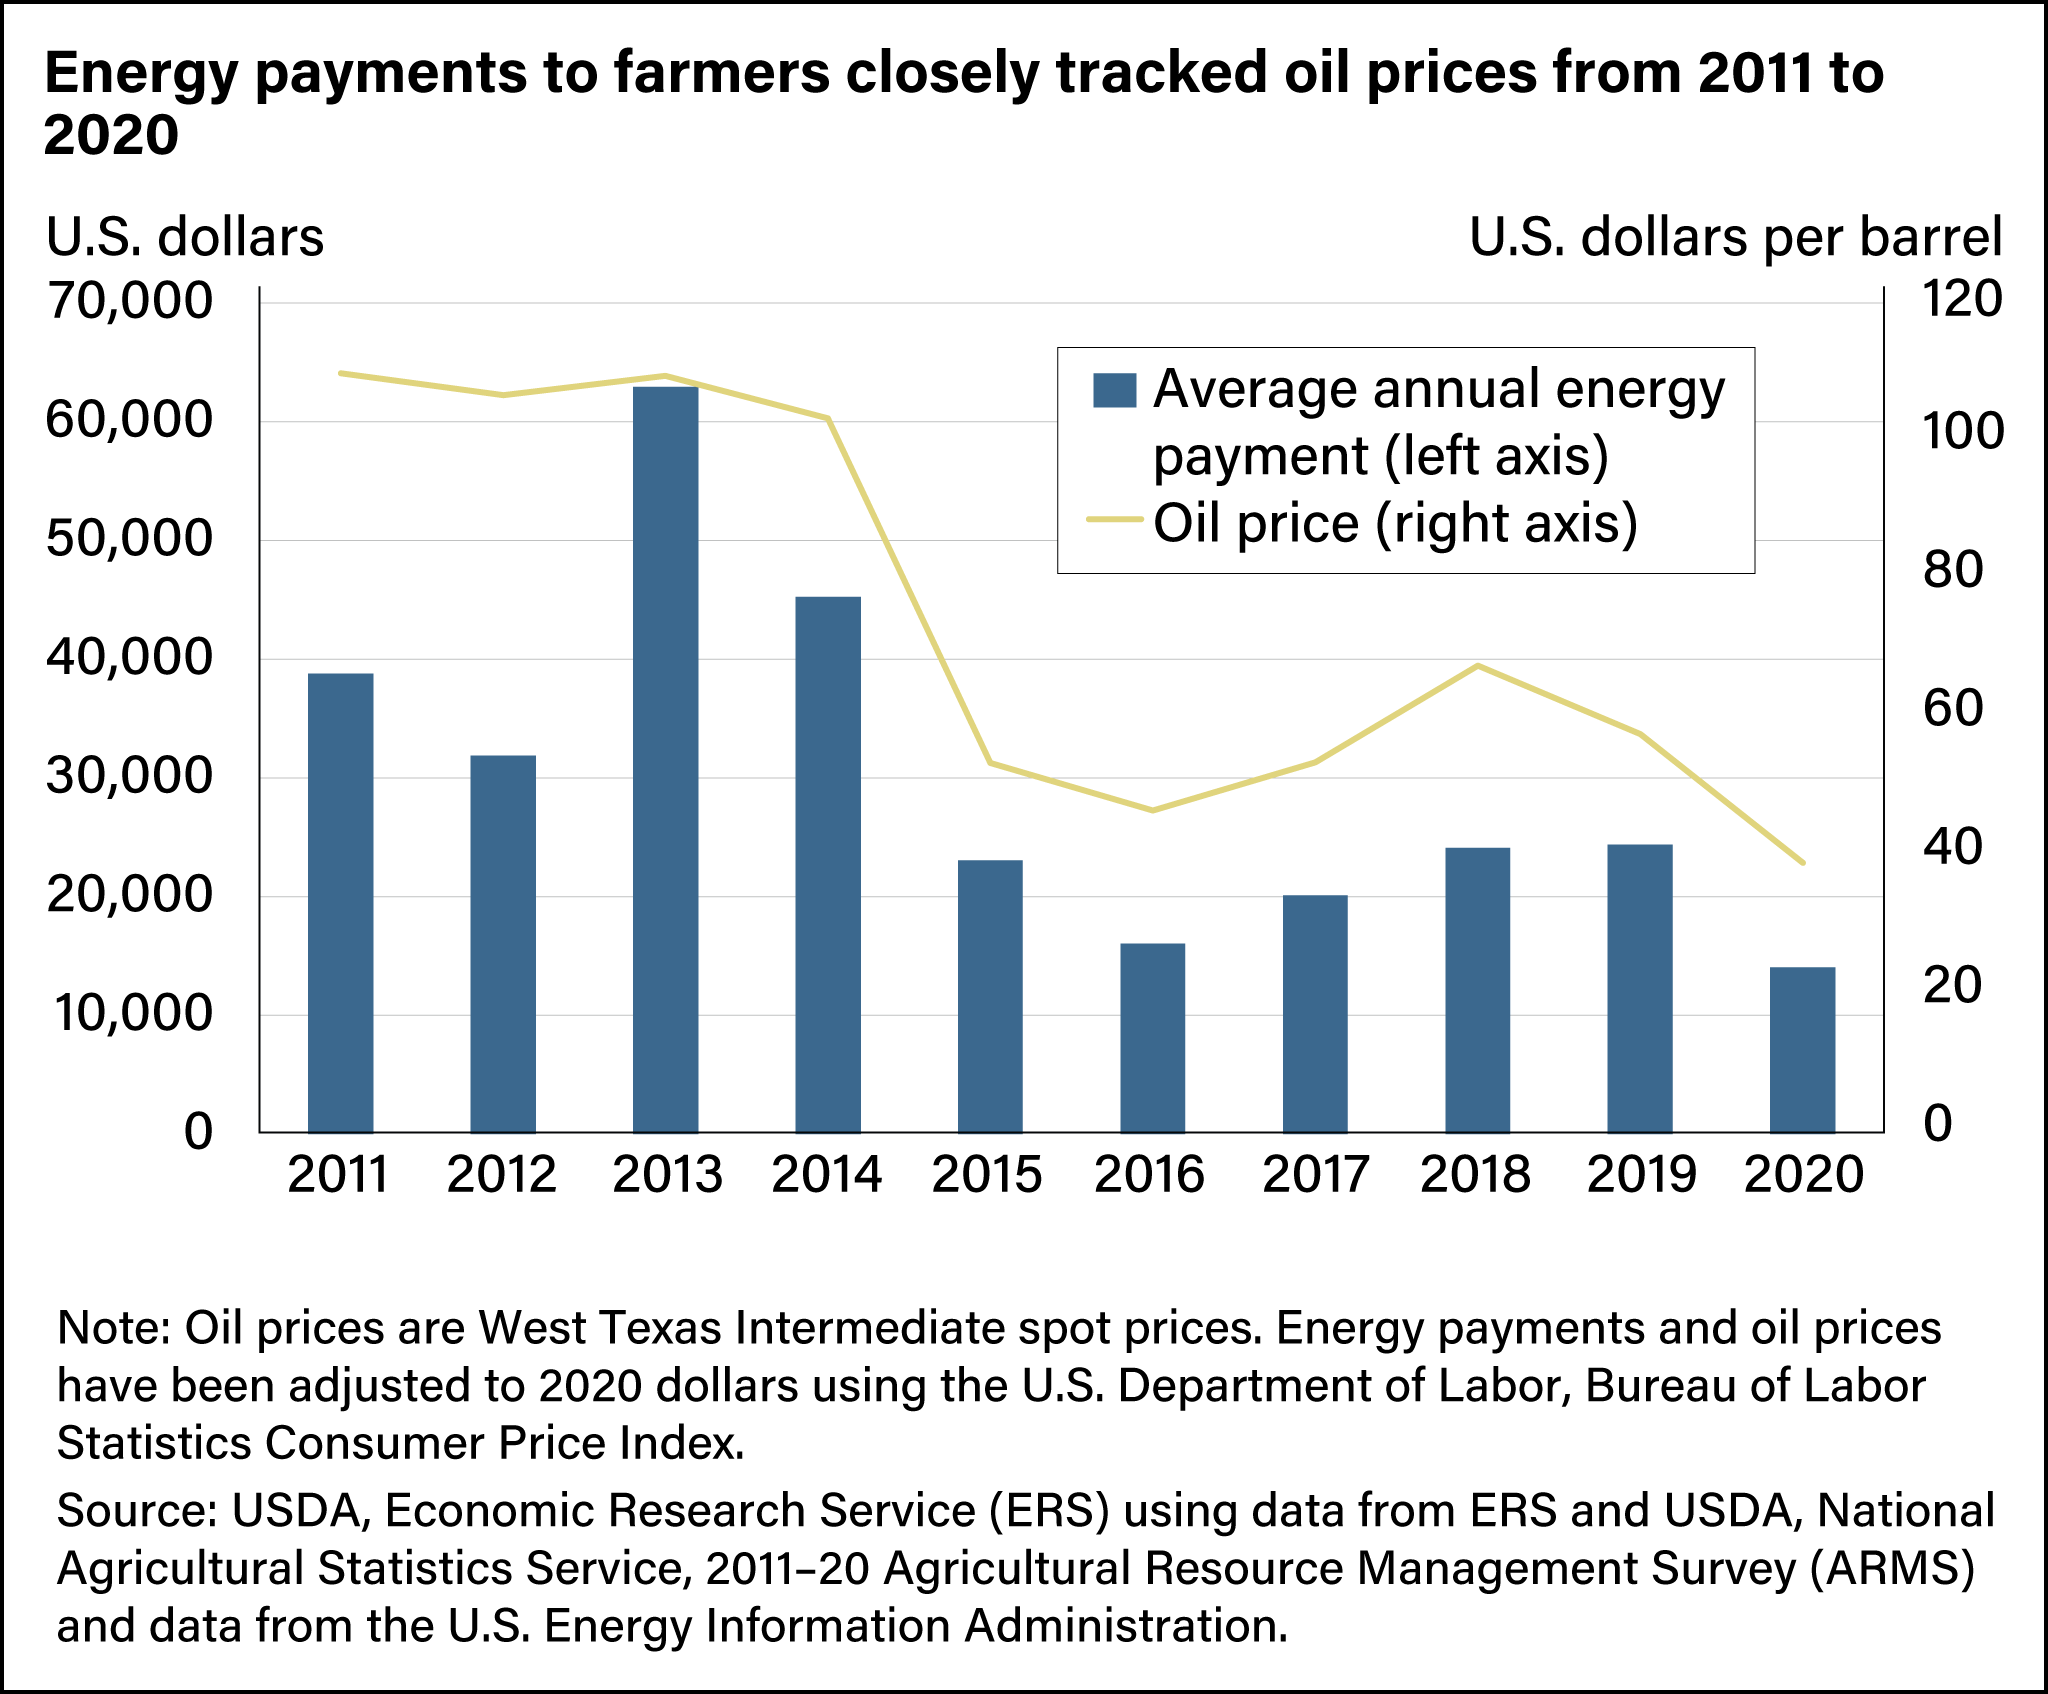
Researchers examining data from the 2011–20 Agricultural Resource Management Surveys (ARMS) found energy income fluctuated from year to year, averaging as high as $62,944 in 2013 and as low as $14,032 in 2020. The payments tracked closely with oil prices over time, remaining high through 2014 before falling in subsequent years. This suggests that despite the growth of renewable power, oil and natural gas are still the predominant sources of energy payments. In fact, farm operators in counties with just oil and natural gas production were an estimated 4.5 percent to 5.6 percent more likely to receive payments than those in counties producing only wind energy.
Energy payments varied across regions as well. They were most common (7.4 percent of operations received payments) and largest ($39,087 on average) in the Plains States, consisting of Kansas, Nebraska, North Dakota, Oklahoma, South Dakota, and Texas. This region includes several States among the leaders in oil, natural gas, and wind energy production, including Texas, which leads in all three categories. Payments were least common (1.45 percent of operations received payments) in the South (Alabama, Arkansas, Florida, Georgia, Louisiana, Mississippi, and South Carolina) where there is less onshore oil and gas production and little potential for wind development. Average payments were smallest ($10,953) in the Midwest (Illinois, Indiana, Iowa, Michigan, Minnesota, Missouri, Ohio, and Wisconsin), where wind energy is more common than oil and gas production.
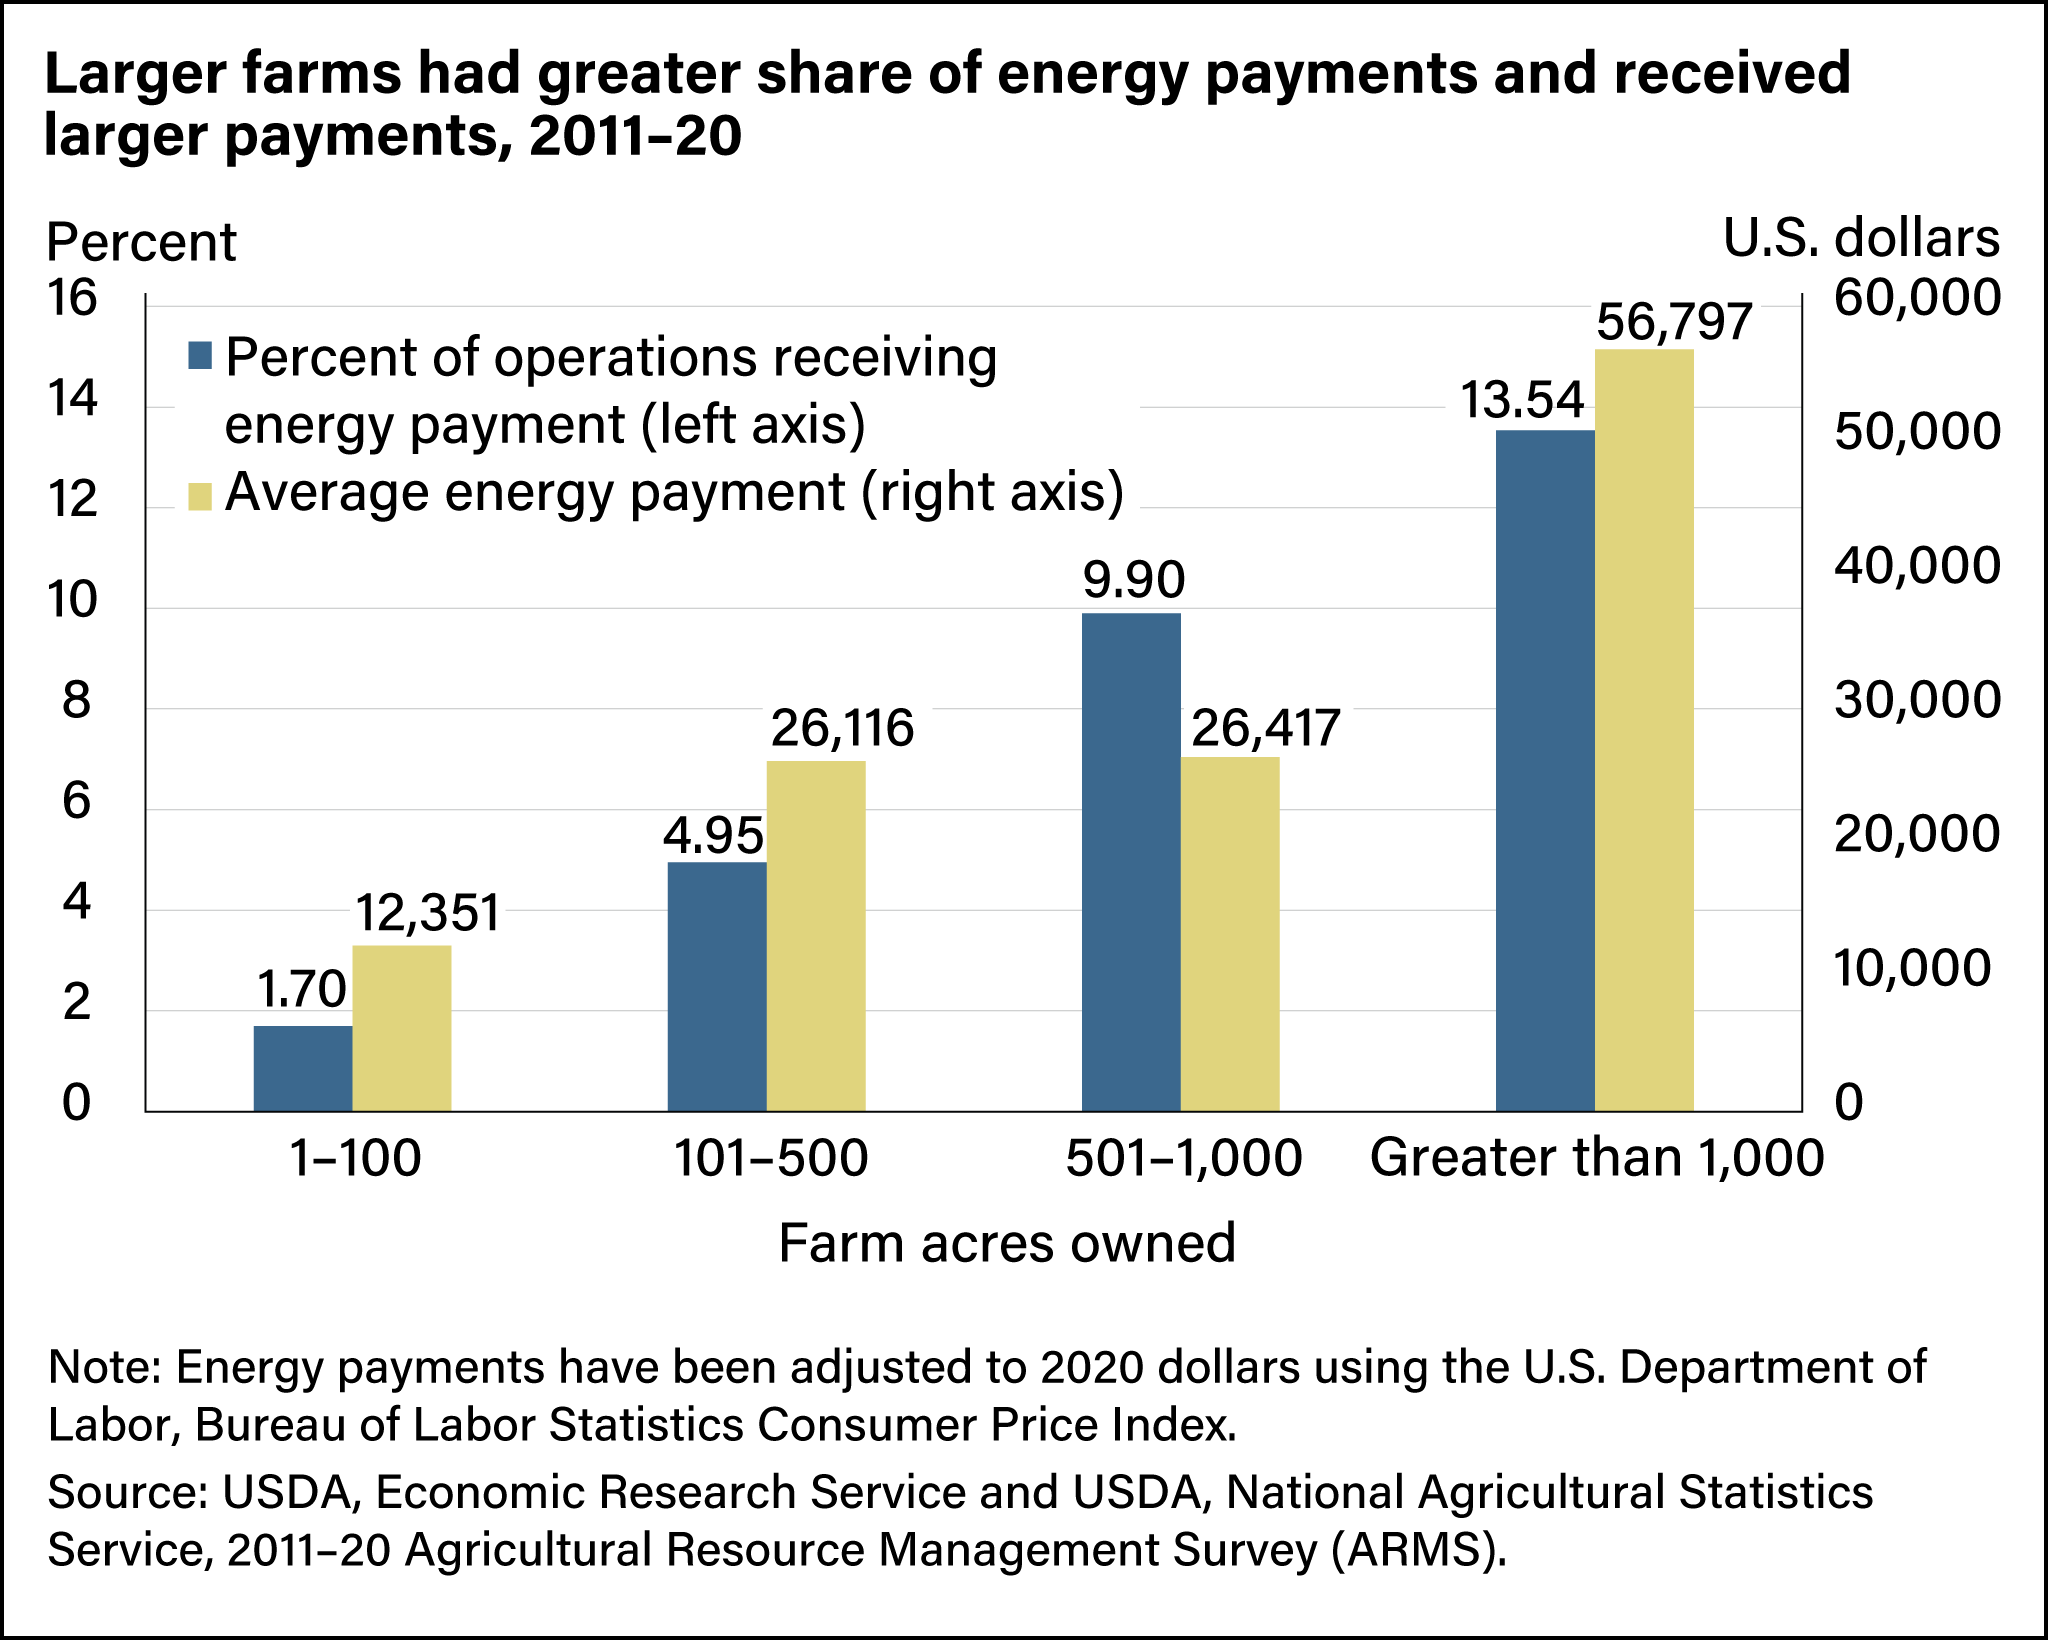
Energy income also differed by farm characteristics, with farm acreage being a key determinant of payments. More than 13 percent of operators who owned greater than 1,000 acres received energy income, compared with less than 2 percent of operators who owned 100 acres or fewer. Similarly, average payments were more than four times larger ($56,797 vs. $12,351) on farms with more than 1,000 acres compared with farms with 100 acres or fewer.
This article is drawn from:
- Winikoff, J.B. & Maguire, K. (2024). The Role of Commercial Energy Payments in Agricultural Producer Income. U.S. Department of Agriculture, Economic Research Service. EIB-271.
You may also like:
- Major Land Uses. (n.d.). U.S. Department of Agriculture, Economic Research Service.
- Natural Resources & Environment. (n.d.). U.S. Department of Agriculture, Economic Research Service.
We’d welcome your feedback!
Would you be willing to answer a few quick questions about your experience?


