
H-2A Temporary Agricultural Job Certifications Continued To Soar in 2022
- by Marcelo Castillo
- 3/13/2023
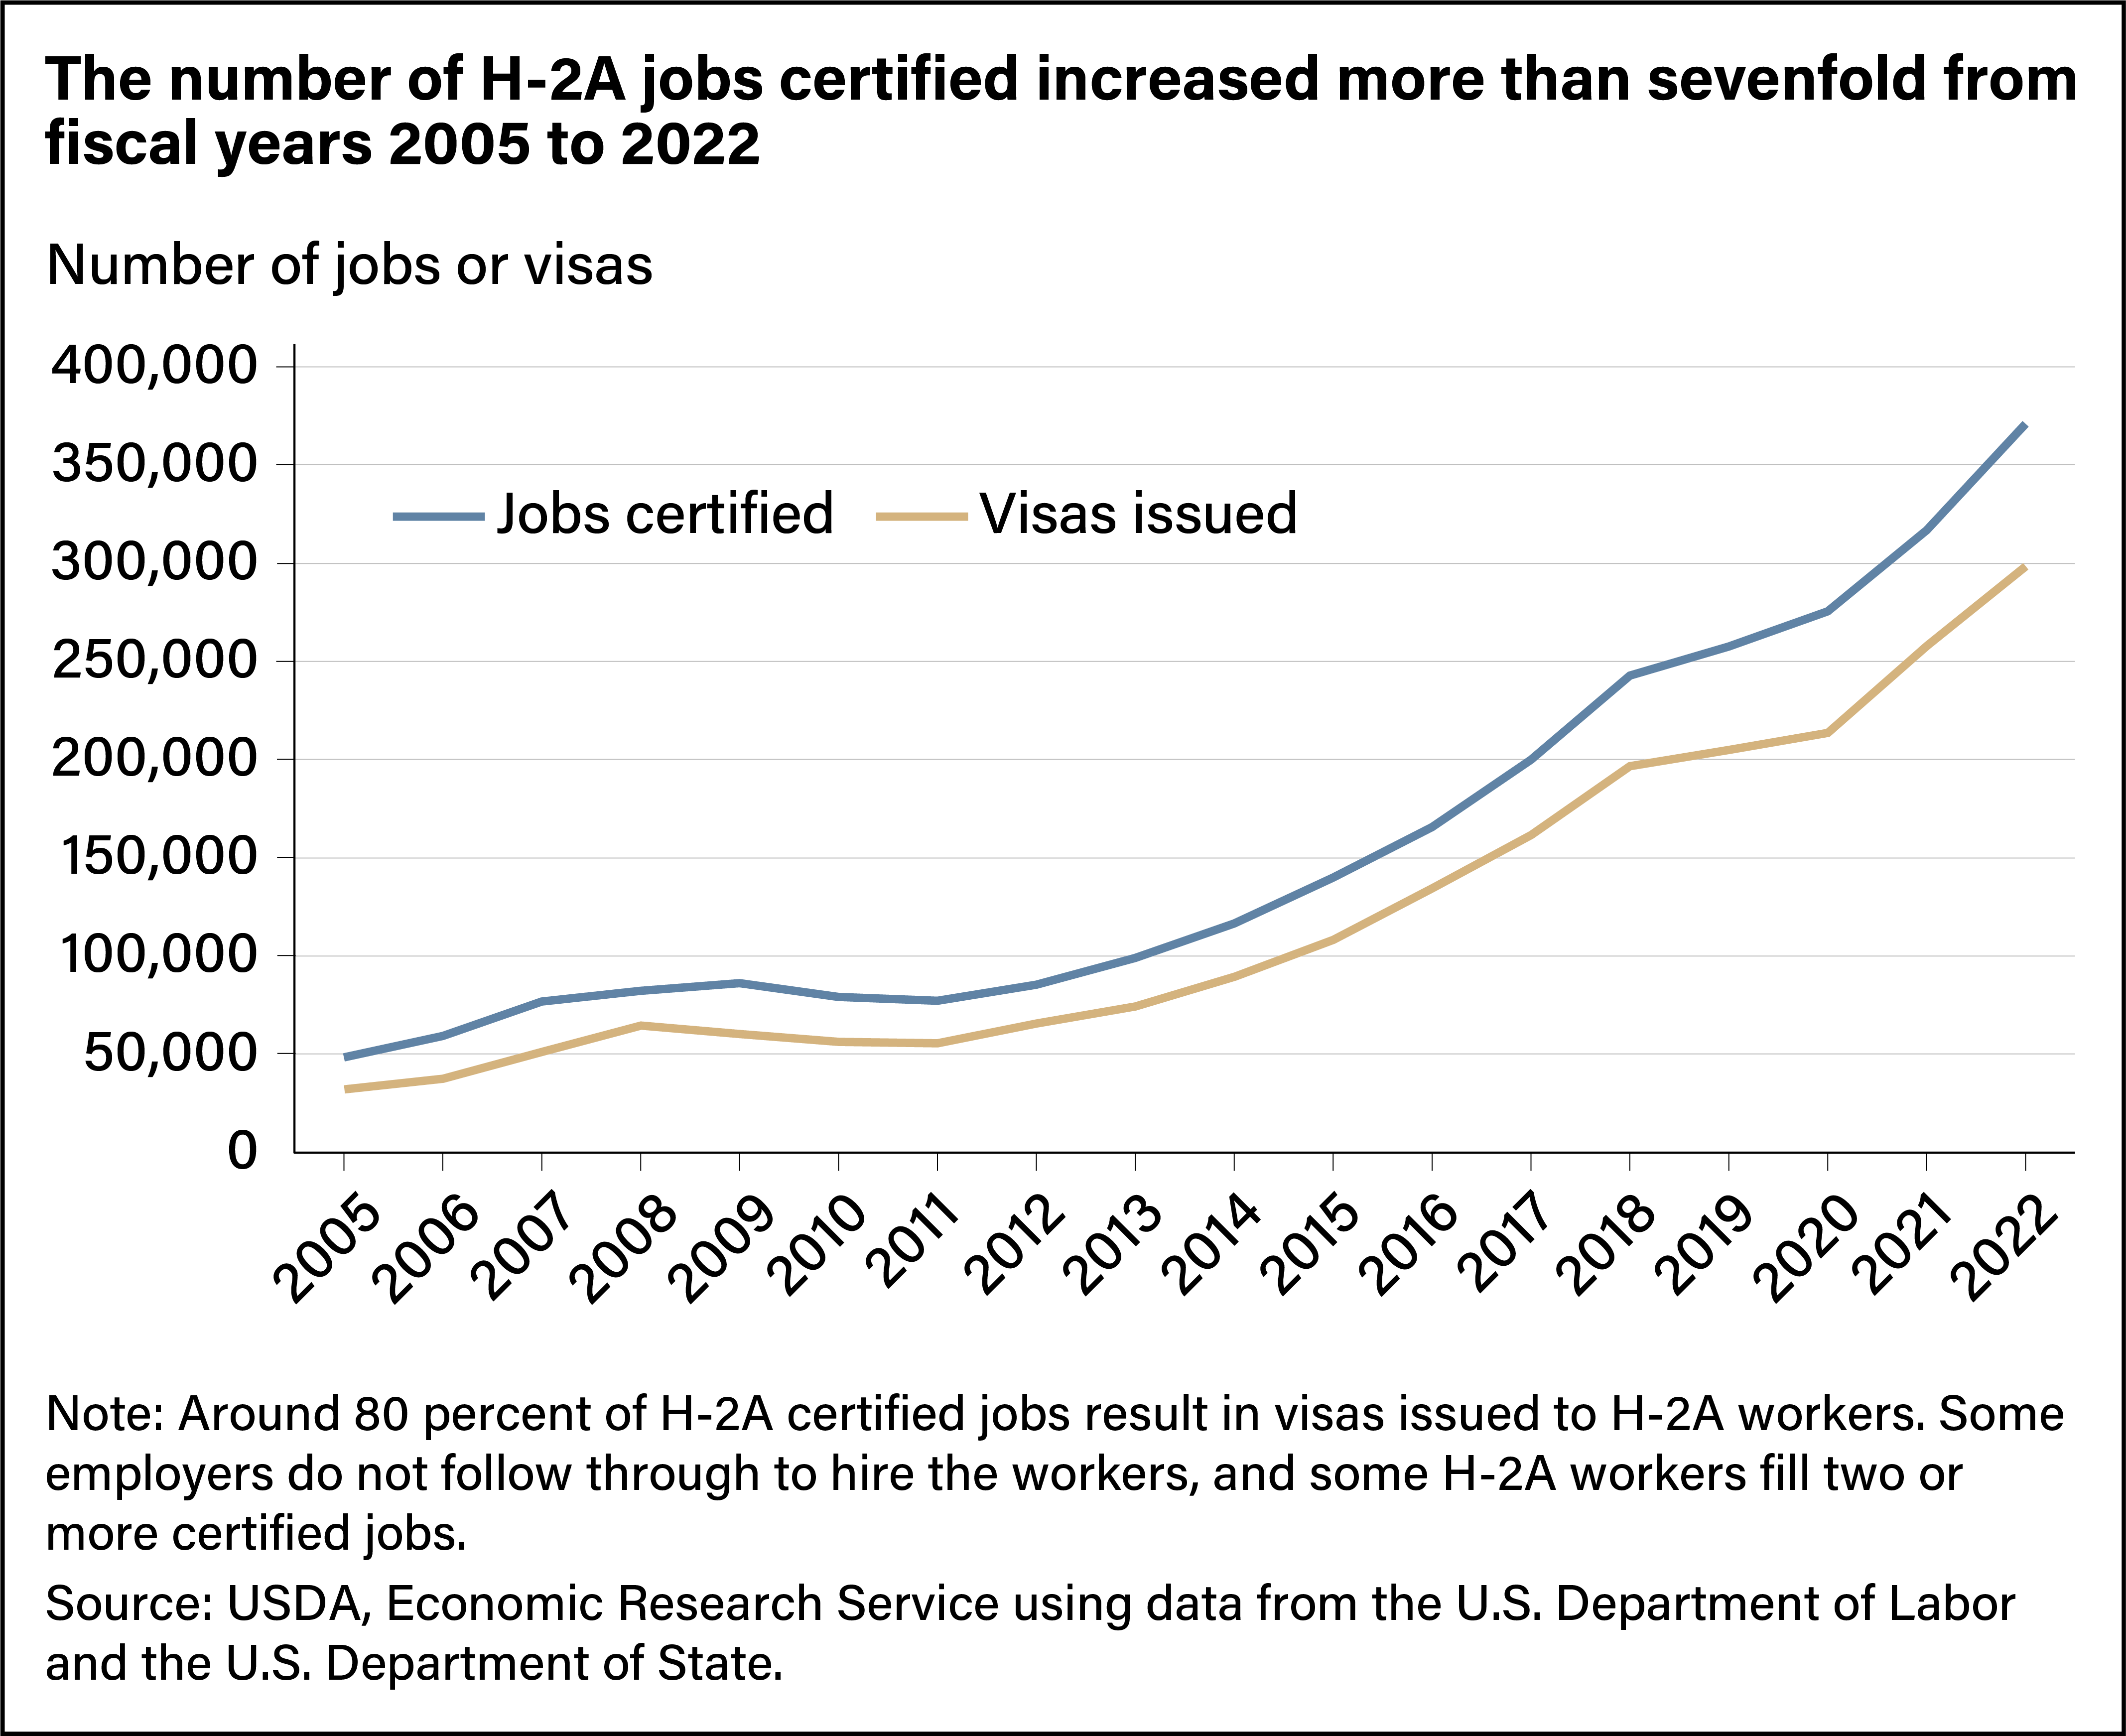
U.S. agricultural employers anticipating a shortage of domestic workers can fill seasonal farm jobs with temporary foreign workers through the H-2A visa program. The U.S. Department of Labor certified around 370,000 temporary jobs in fiscal year (FY) 2022 under the program, more than 7 times the number certified in 2005 and double the amount in 2016. A certified job does not necessarily result in the issuance of a visa; in fact, in recent years only about 80 percent of jobs certified as H-2A have resulted in visas. Under Department of Labor eligibility rules, employers must show that their efforts to recruit U.S. workers were not successful before a job can be certified. They also must pay H-2A workers no less than the Adverse Effect Wage Rate (AEWR), which is set at the region’s average hourly wage for crop and livestock workers in the previous year, as measured in USDA’s Farm Labor Survey. Even with these restrictions, the H-2A visa program has grown rapidly in recent years as U.S. domestic workers find jobs outside agriculture and fewer newly arrived immigrants seek agriculture jobs.
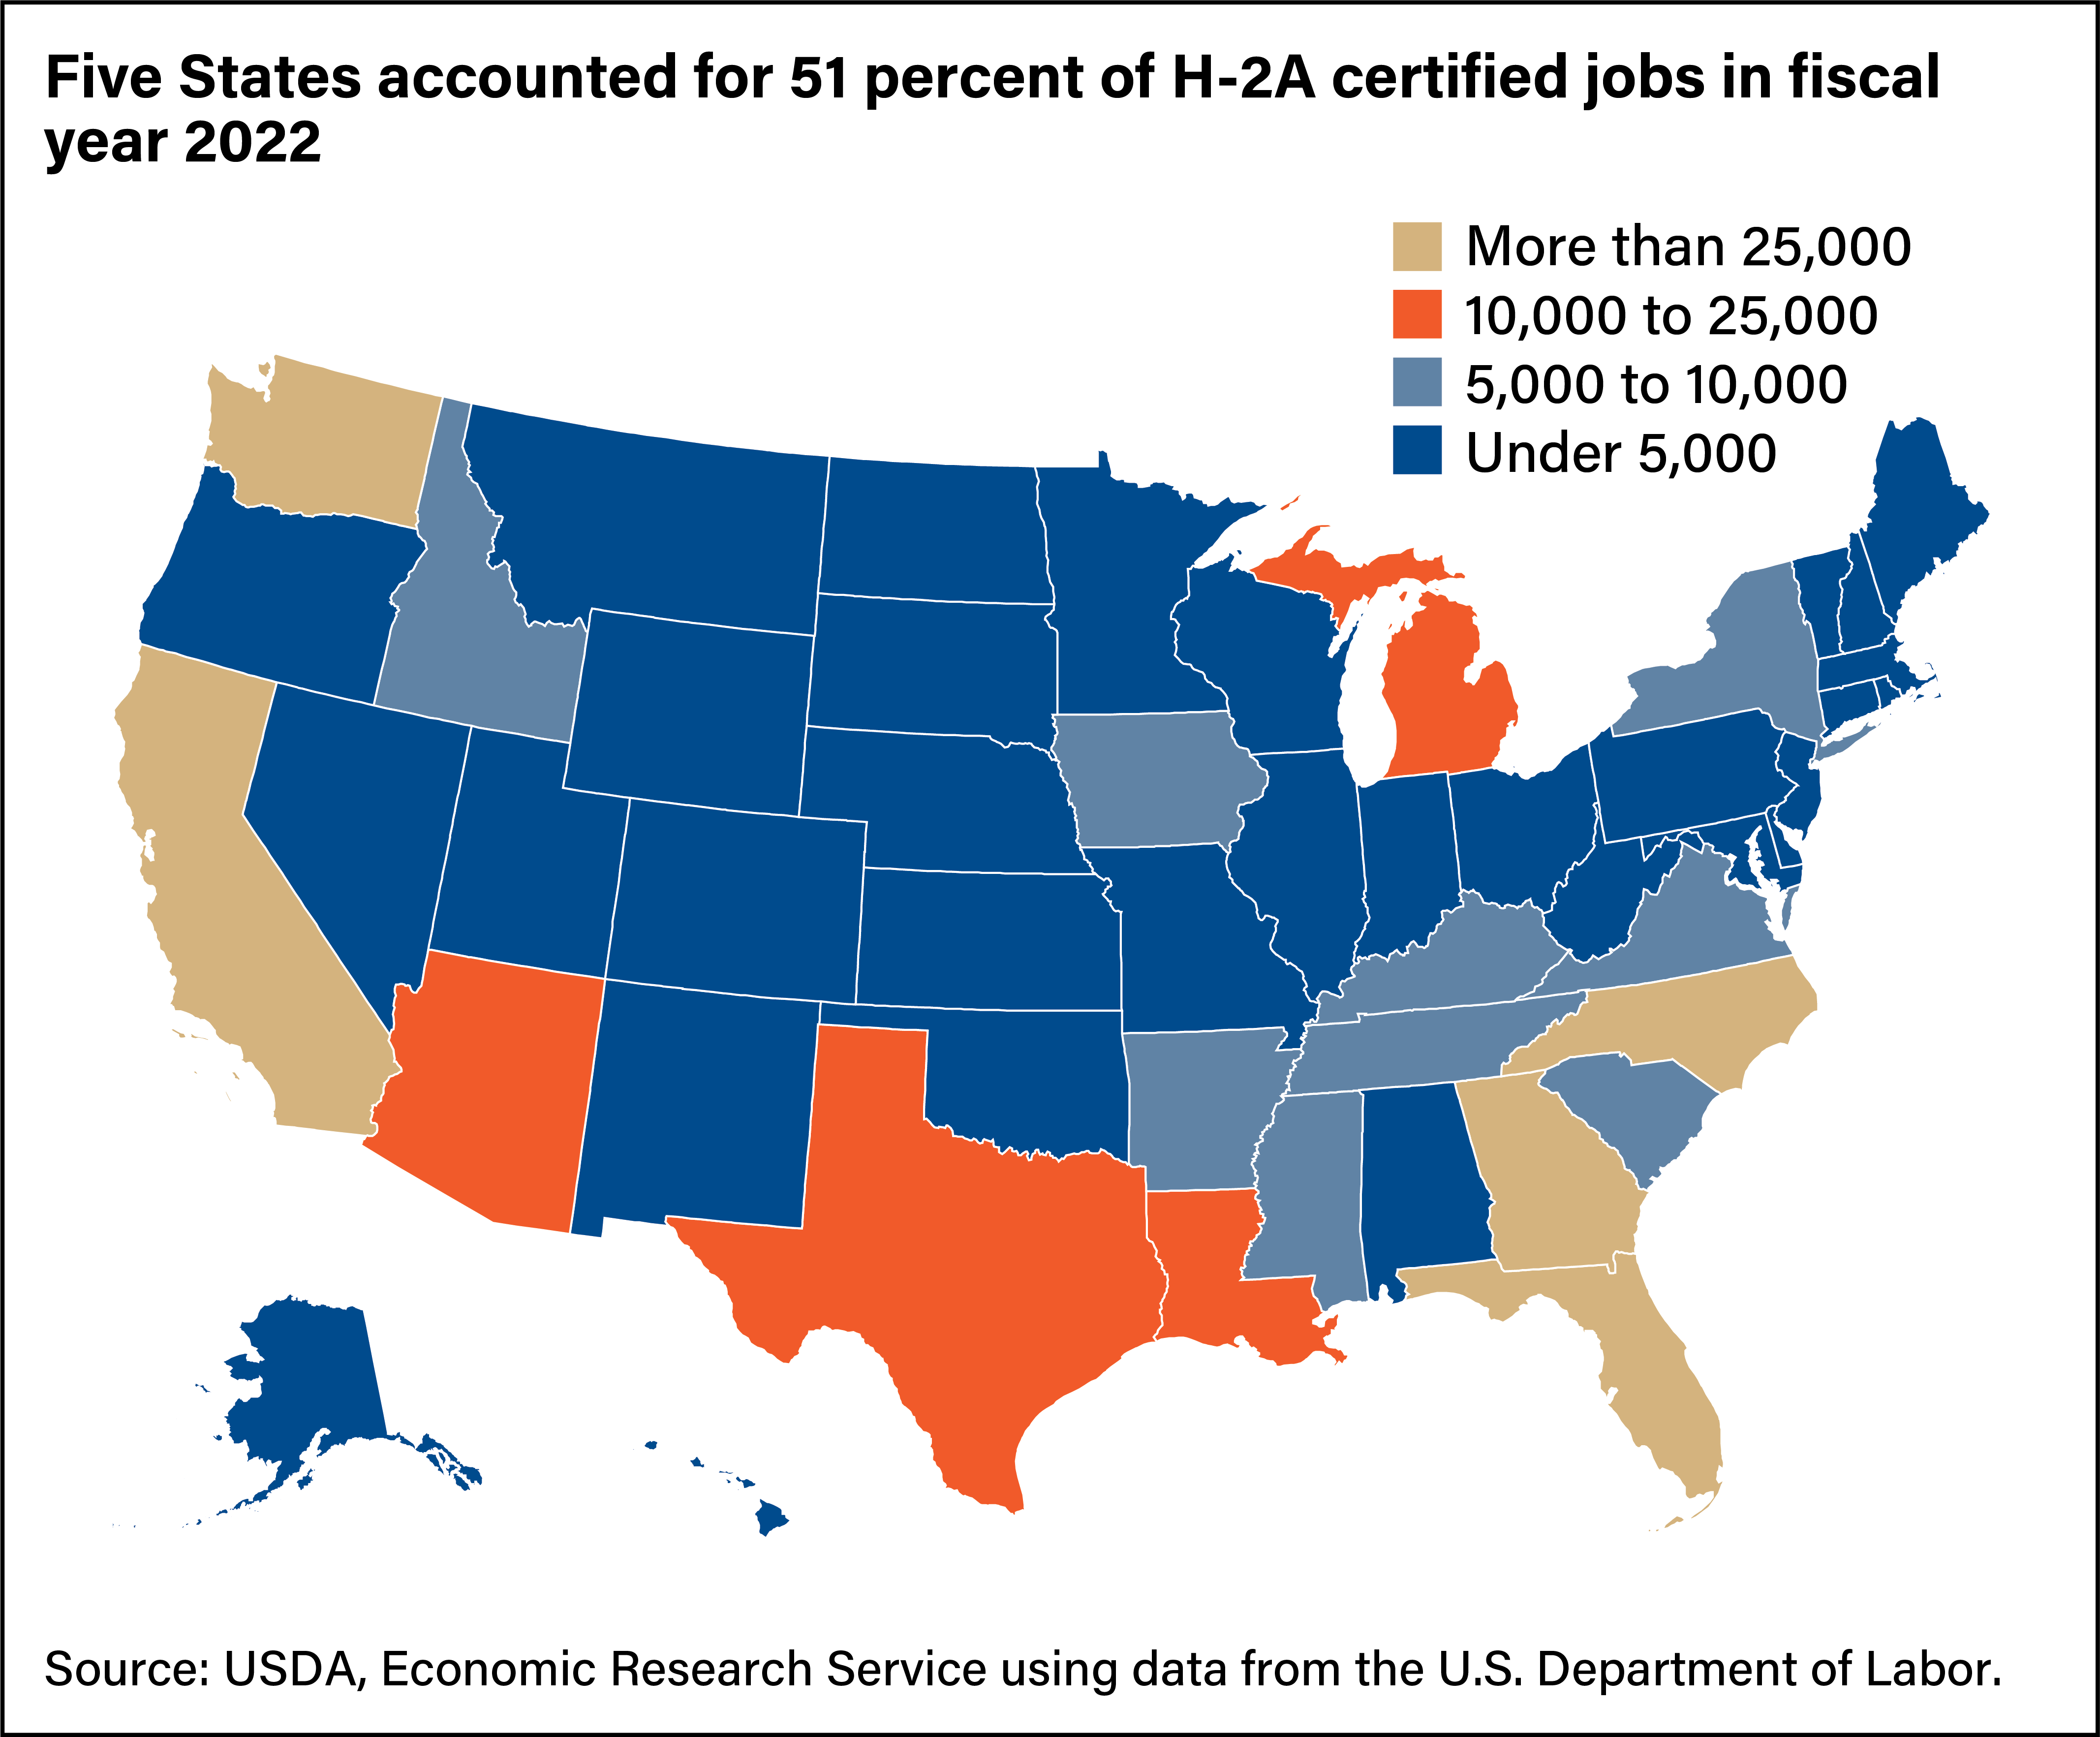
H-2A employment is concentrated in States with large and labor-intensive agricultural sectors. In 2022, the top 5 States, each of which had more than 25,000 certified jobs, were: Florida with 14 percent of total H-2A jobs certified, California with 12 percent, Georgia and Washington with around 9 percent each, and North Carolina with 7 percent. These five States accounted for around 51 percent of all H-2A certifications. The level of farm workers in a State does not always correspond with the number of H-2A hires made in that State. For example, Georgia and North Carolina have fewer farmworkers than Texas but hire more H-2A workers. As such, the H-2A share of total farm jobs is higher in Georgia and North Carolina, as well as in most Southeastern States, than in Texas.
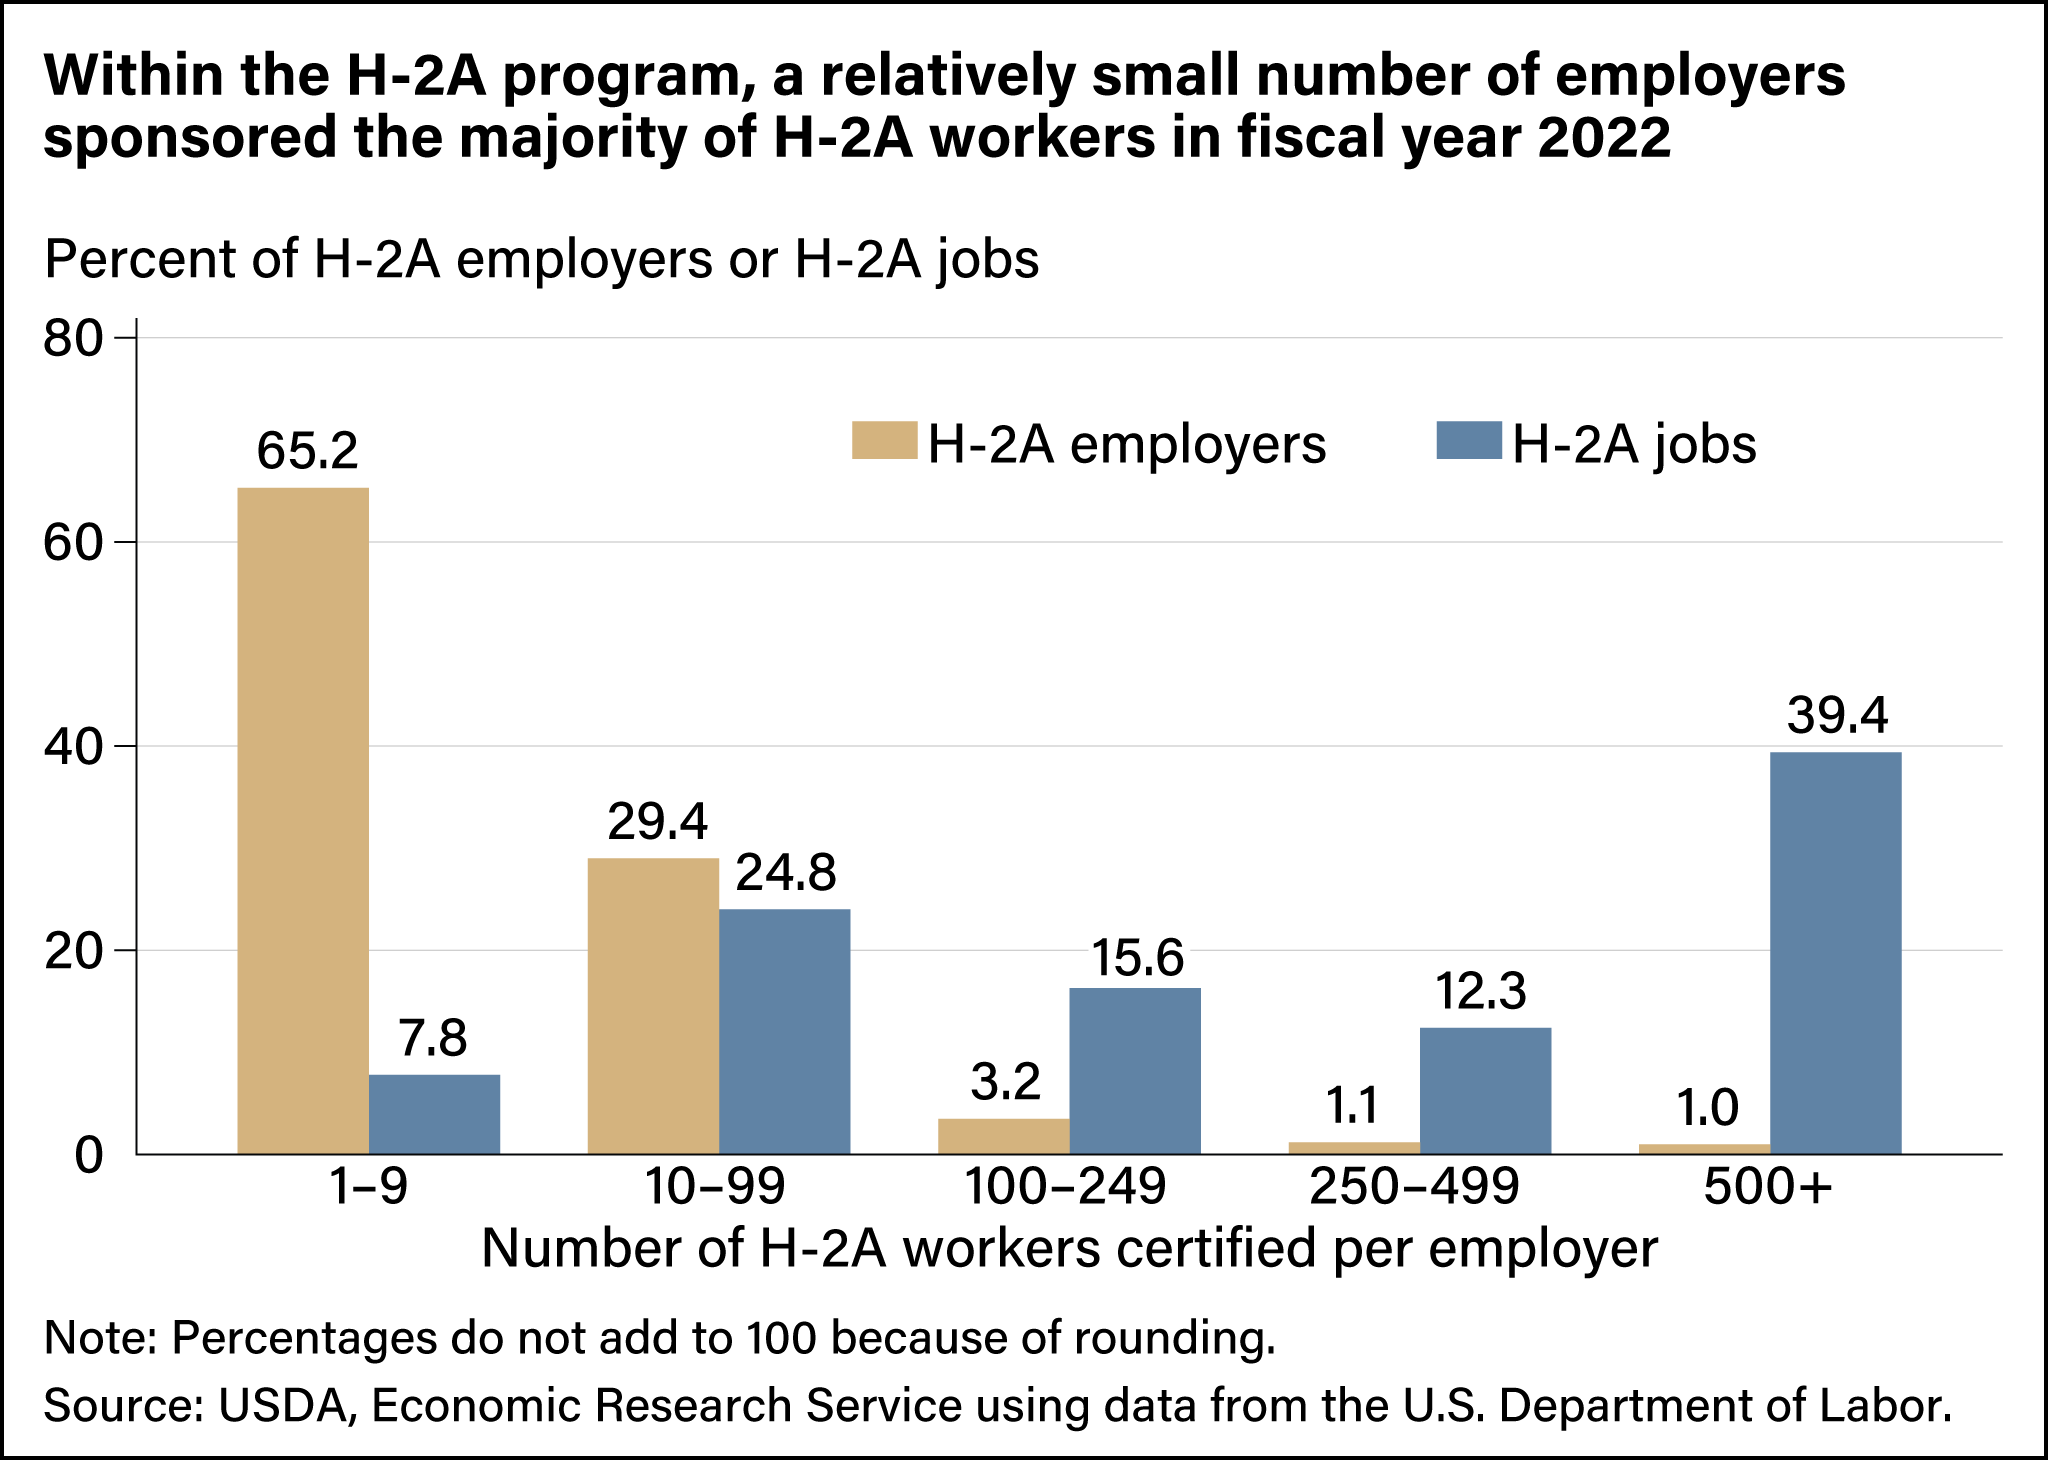
H-2A employment also is concentrated by employer size, and a relatively small number of employers sponsor the majority of H-2A workers. The chart below shows the share of H-2A employers and jobs certified by size category, defined by the number of H-2A workers certified. The tan bars denote the share of H-2A employers in each size category, and the blue bars show the share of H-2A workers certified to those employers. The top 5.3 percent of H-2A employers—those who employ more than 100 workers—accounted for more than two thirds of all certified jobs in FY 2022. The top 1 percent (the category of the largest employers, which is made up of about 110 employers) received almost 40 percent of all H-2A certifications. However, most employers request relatively few workers. About two-thirds request between 1 and 9 H-2A jobs, accounting for less than 8 percent of the national total.
One reason for the concentration of H-2A jobs by employer size is the prevalence of farm labor contractors (FLCs) in the program. Employers eligible to request H-2A workers fall into three main types: individual employers; growers associations; and FLCs, who are brokers who hire farmworkers and lease their services to individual farmers. FLCs often provide H-2A workers to multiple farmers, which partly explains why they tend to be some of the larger employers in the program. In FY 2022, around 51 percent of all H-2A jobs certified were for employment by individual employers, followed by FLCs with 44 percent and growers associations (and their individual members acting as joint employers) with 5 percent.
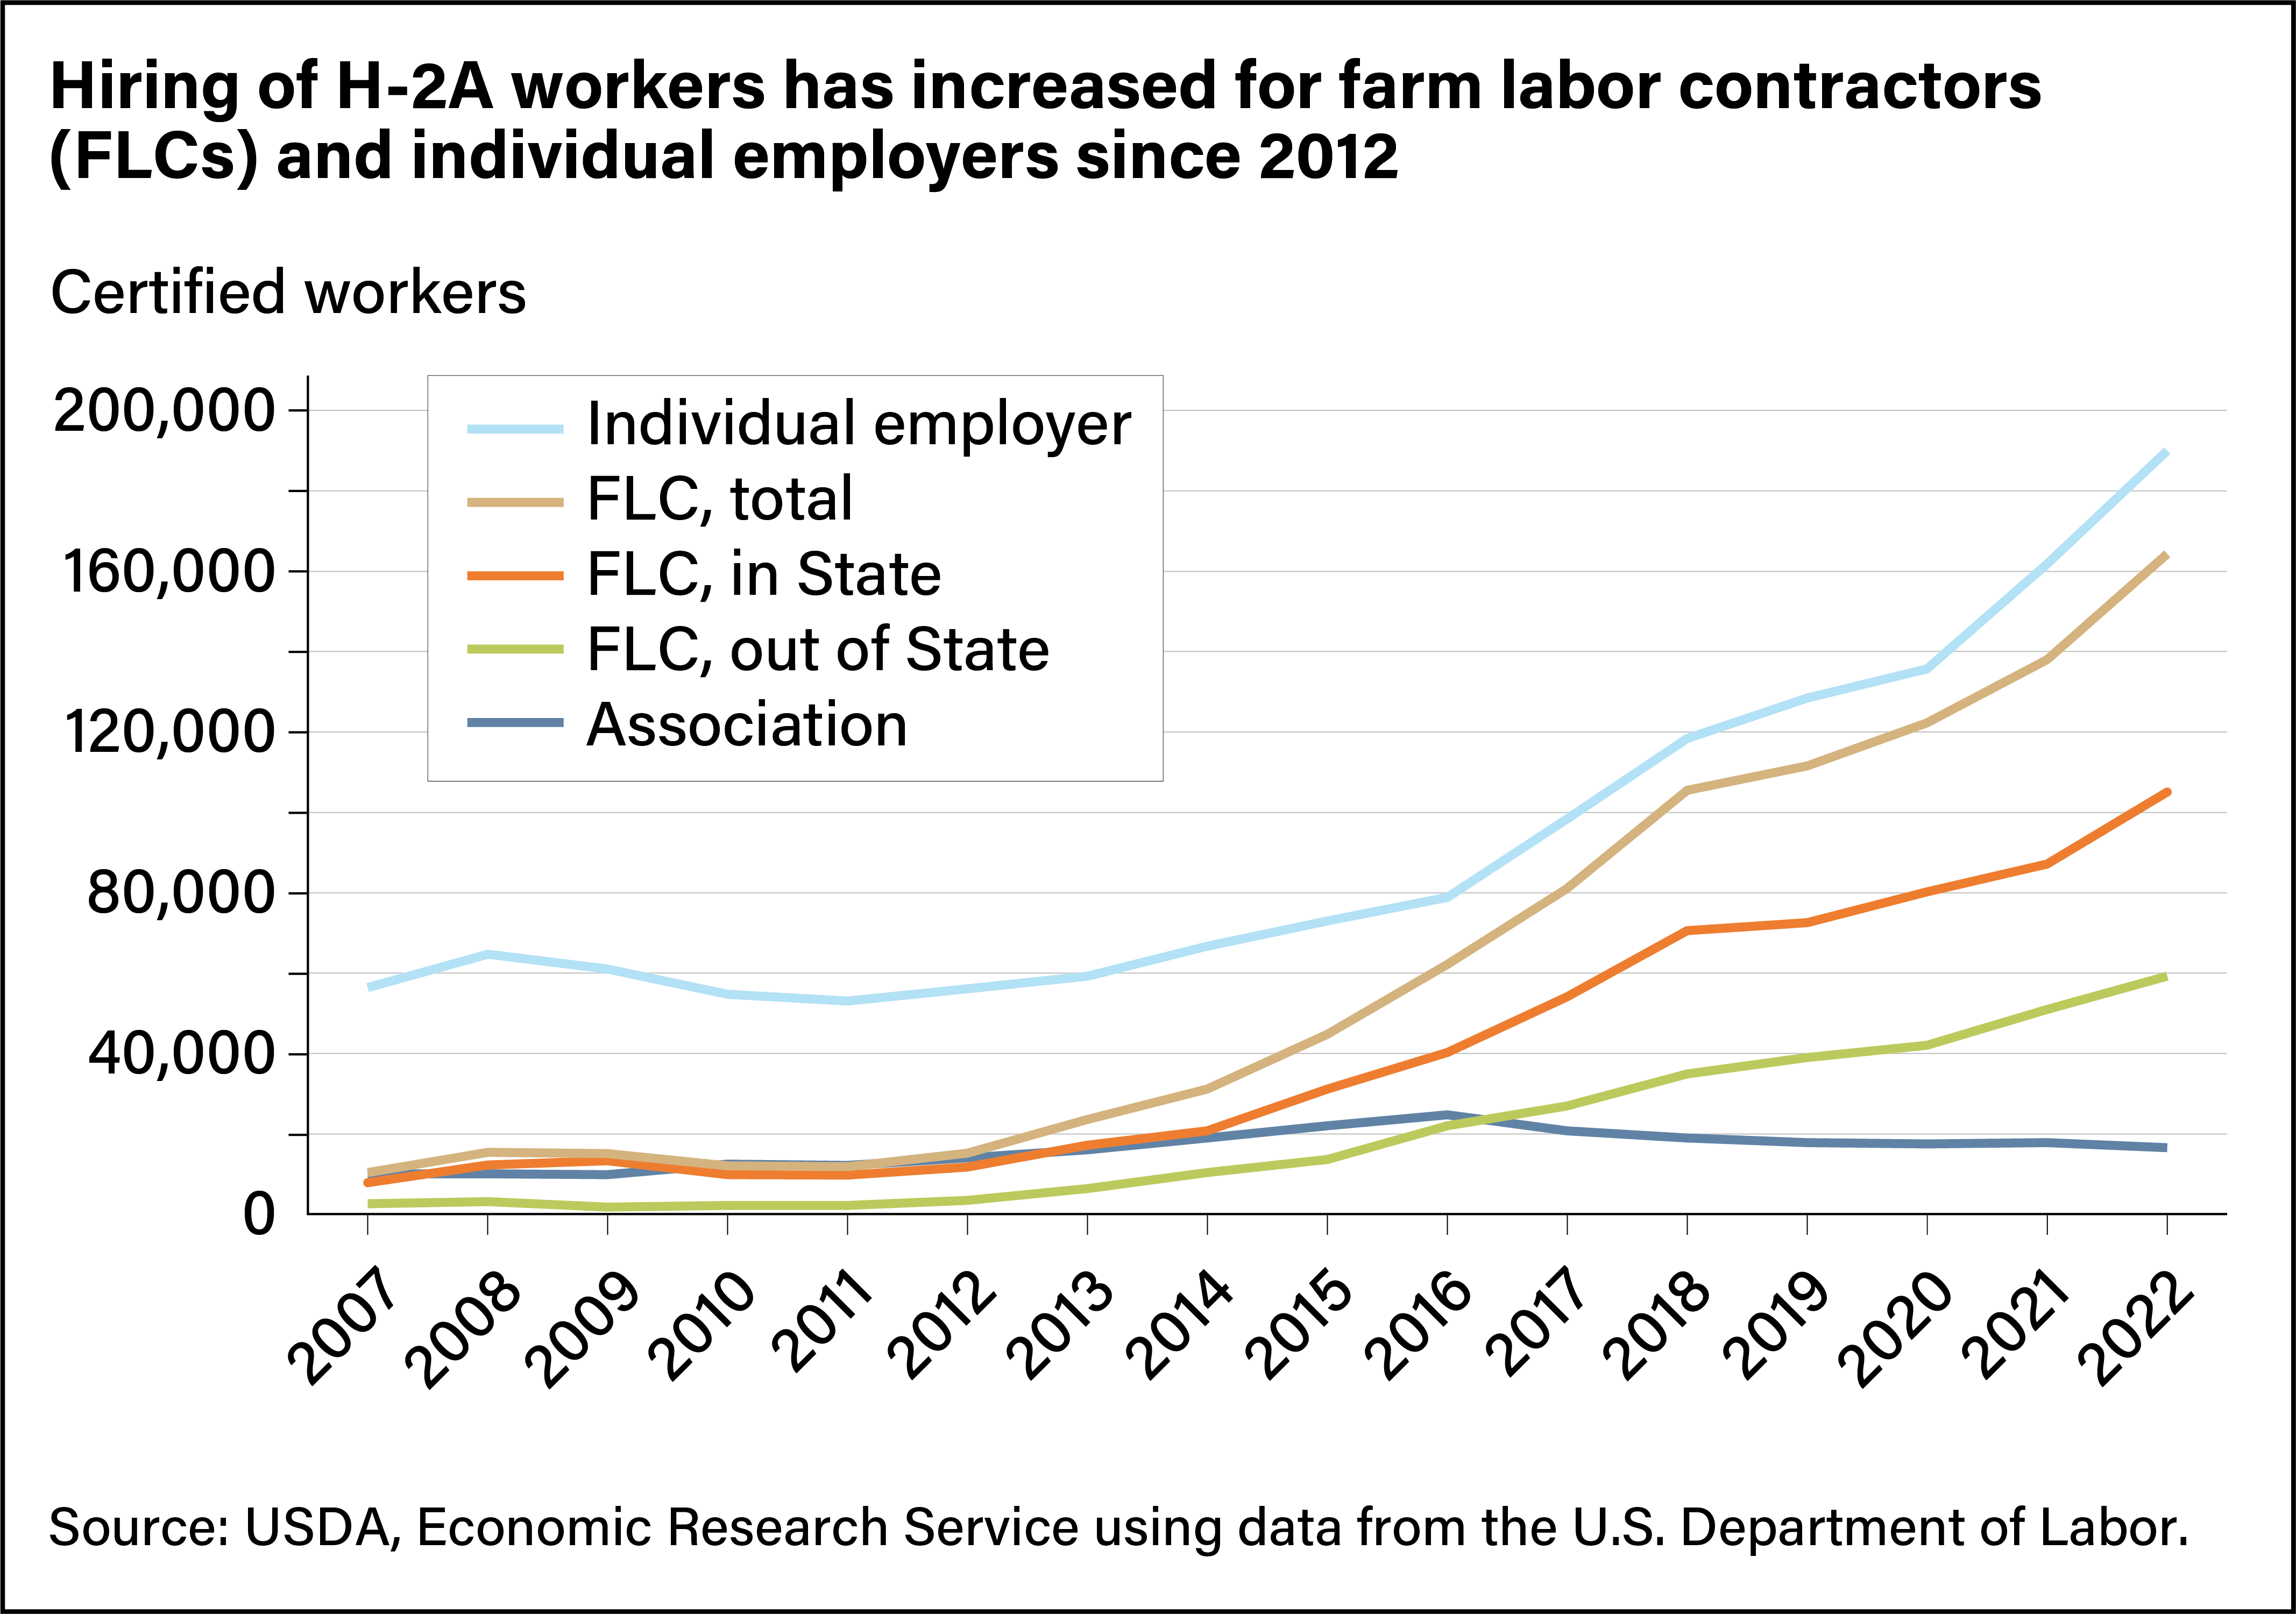
The chart below shows that strong FLC participation in the program is a relatively new phenomenon. While individual employers obtained most of the H-2A certifications between 2007 and 2022, the gap between them and FLCs narrowed, and now more than half the recent growth in H-2A certifications comes from FLCs. The FLC share of H-2A jobs increased from 13 percent in FY 2007 to 44 percent in FY 2022.
Agricultural employers based in one State may put in a request to employ H-2A workers in a different State. The chart below shows that many FLC H-2A jobs are outside the State where the FLC is based. In FY 2022, around 36 percent of FLC H-2A employment was for out-of-State employers and worksites. Florida-based FLCs accounted for around 50 percent of all FLC-sponsored out-of-State H-2A jobs, and California-based FLCs accounted for an additional 14 percent. FLCs based in Florida and California accounted for 40 percent and 24 percent, respectively, of all H-2A jobs sponsored by FLCs.
This article is drawn from:
- Castillo, M., Martin, P. & Rutledge, Z. (2022). The H-2A Temporary Agricultural Worker Program in 2020. U.S. Department of Agriculture, Economic Research Service. EIB-238.
You may also like:
- Farm Labor. (n.d.). U.S. Department of Agriculture, Economic Research Service.
- Castillo, M., Simnitt, S., Astill, G. & Minor, T. (2021). Examining the Growth in Seasonal Agricultural H-2A Labor. U.S. Department of Agriculture, Economic Research Service. EIB-226.
- Calvin, L., Martin, P. & Simnitt, S. (2022). Adjusting to Higher Labor Costs in Selected U.S. Fresh Fruit and Vegetable Industries. U.S. Department of Agriculture, Economic Research Service. EIB-235.