Persistently Poor Rural Counties Experienced Lower Employment Impacts From the Coronavirus (COVID-19) Pandemic but Have Higher Cumulative COVID-19 Case Rates
- by Elizabeth A. Dobis, Thomas Krumel and Austin Sanders
- 2/7/2022
The Coronavirus (COVID-19) pandemic resulted in more than 71 million cases across the United States and 860,000 deaths nationwide by late January 2022, according to the Centers for Disease Control and Prevention. Beyond both cases and deaths, the pandemic prompted significant restrictions on business and government activities, broad changes across industries, and lifestyle shifts for many. The effects of the pandemic varied by location, and differences can be seen when comparing the impact of the disease on communities in rural (nonmetro) and urban (metro) areas of the United States, as well as when looking at counties with persistent poverty.
Counties are defined as persistently poor if the poverty rate was 20 percent or more during four consecutive U.S. Census measurements dating back to 1980. Persistent poverty counties may have been more susceptible to the effects of the pandemic because they often have fewer resources for weathering economic and social stress.
COVID-19 case rates provide a tool for comparing the effects of the pandemic, as they frequently drove policies and recommendations related to health behaviors (e.g., wearing masks, social distancing) and location closures (e.g., business shutdowns, school closures). These policies, along with pandemic-driven changes to consumption of goods and services, affected employment and labor force participation throughout the Nation.
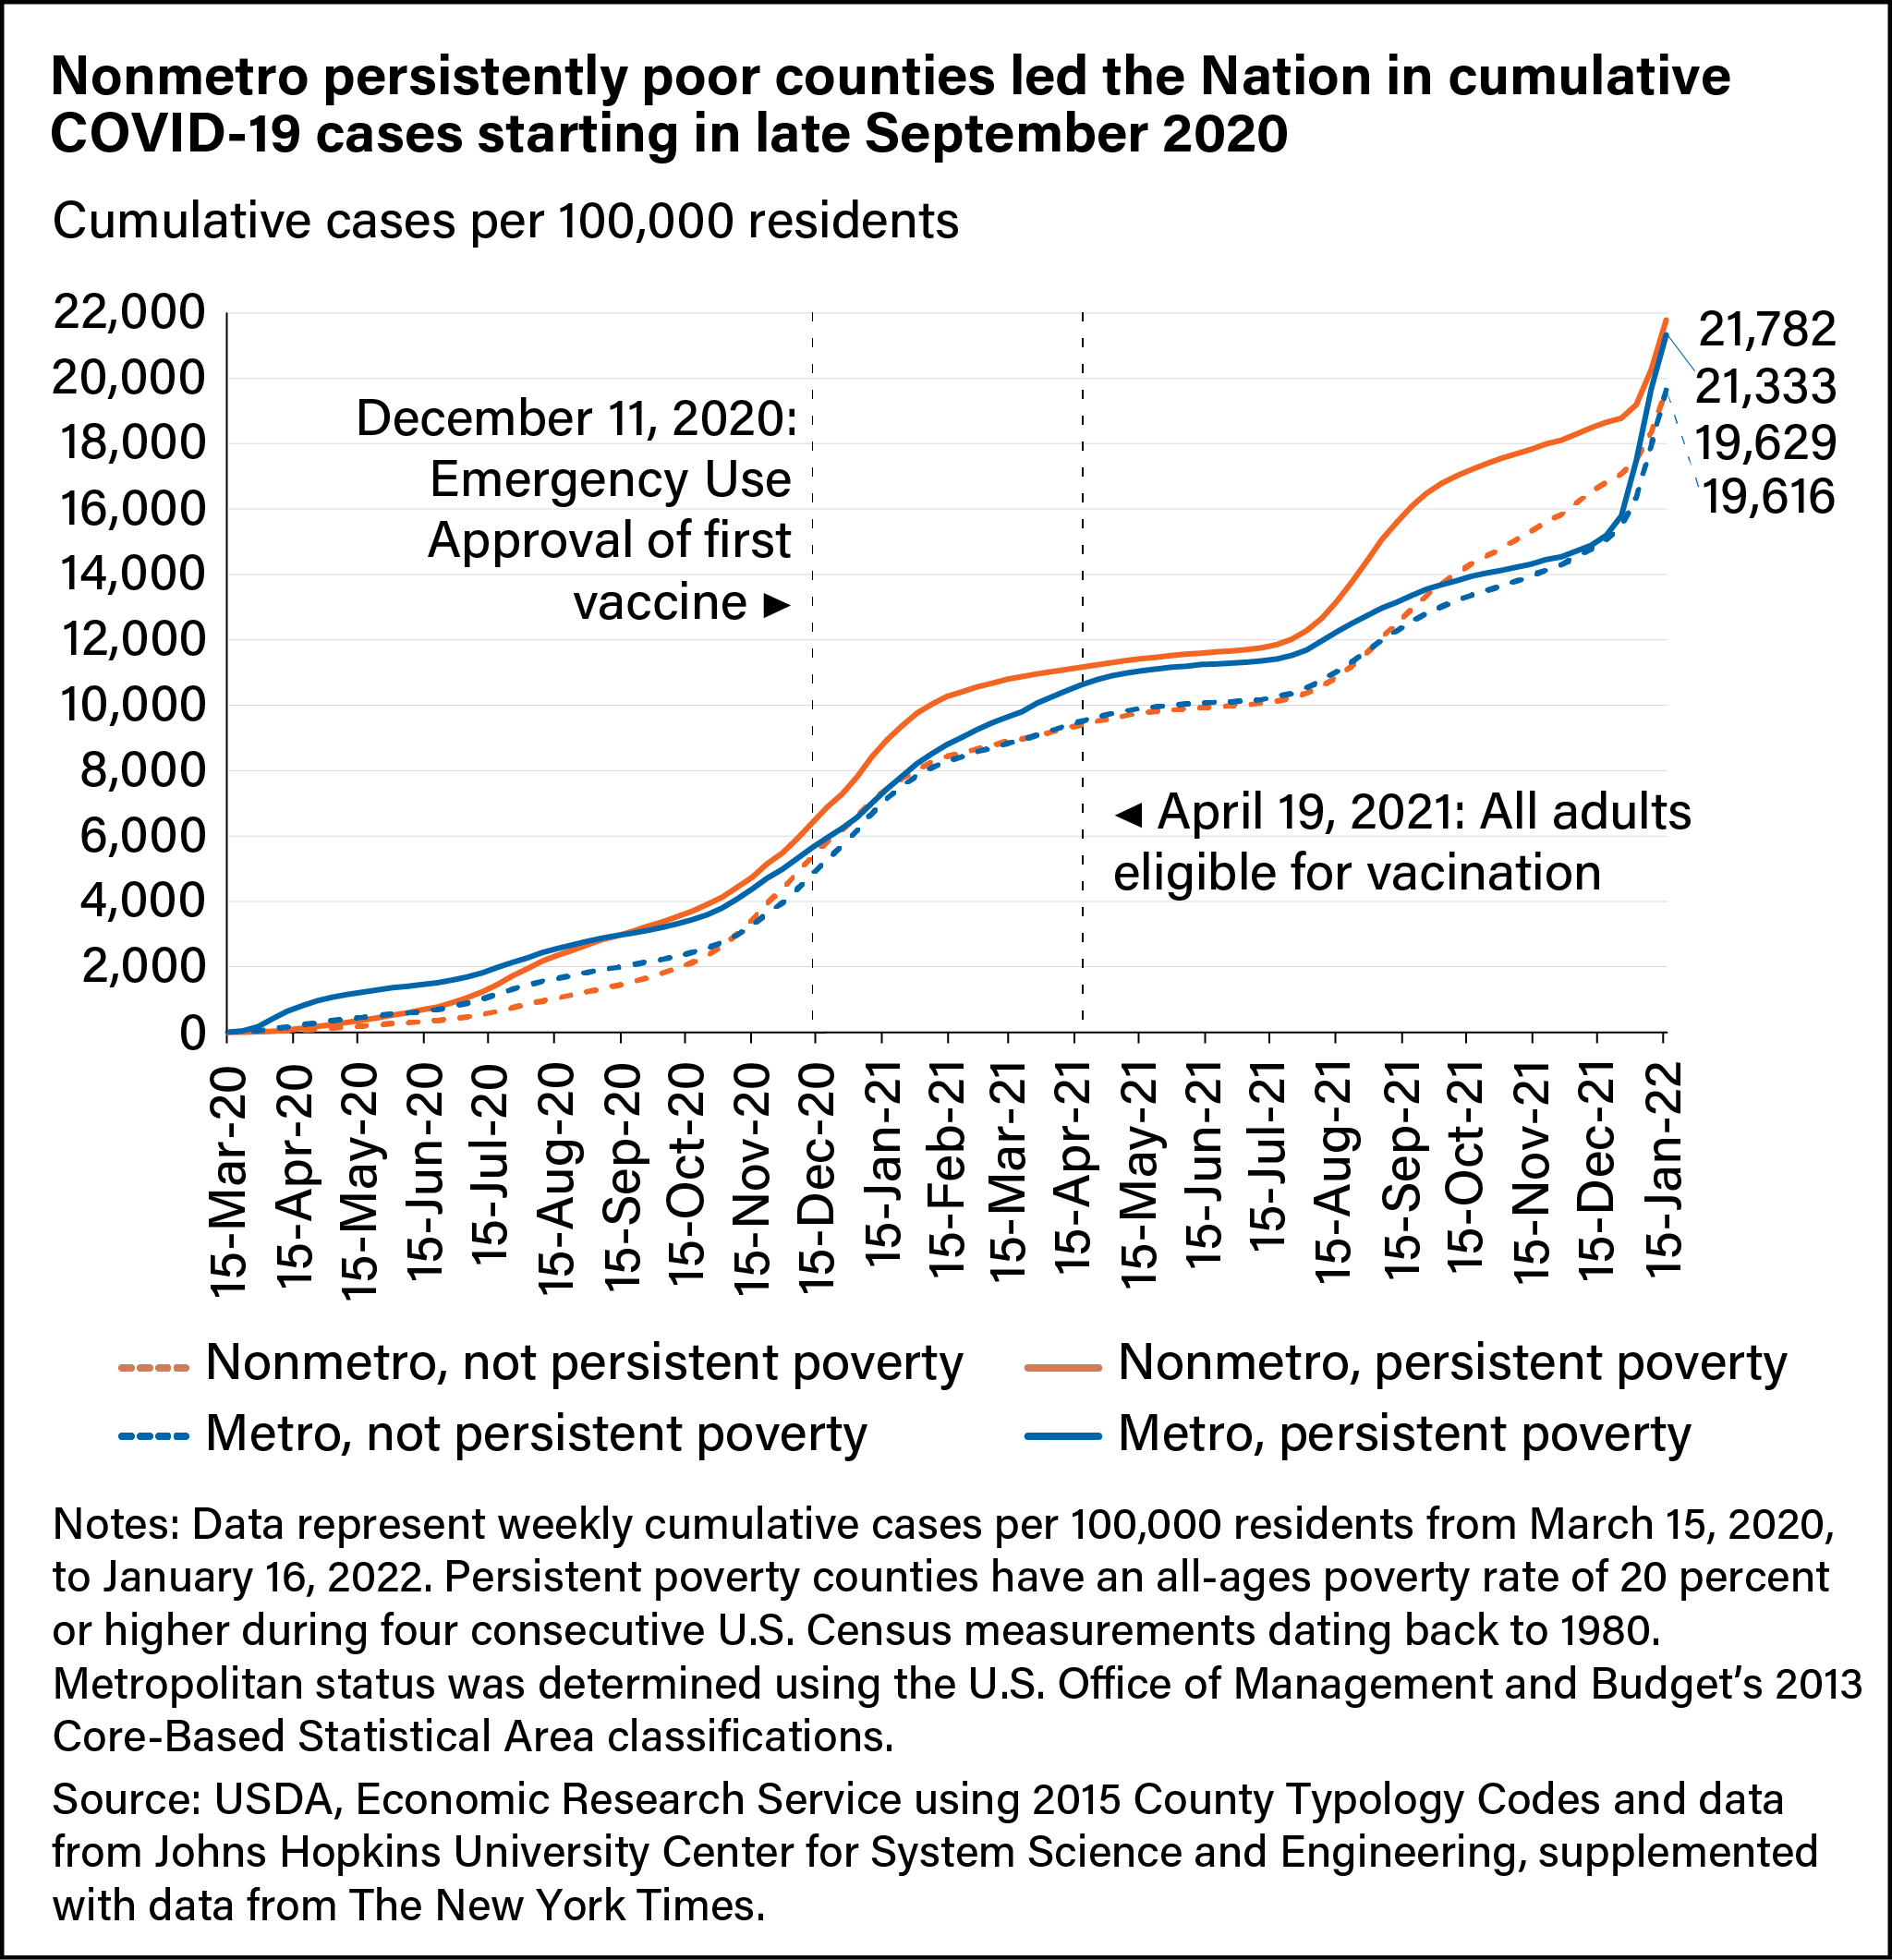
The first surge, from March to May 2020, primarily affected large metropolitan areas, with persistently poor urban counties leading new case rates throughout the surge. The pandemic spread to rural areas during the second surge in July and August 2020, and persistently poor rural counties led new case rates, gradually closing the gap with the cumulative case rate in persistently poor urban counties. By late September 2020, rural persistently poor counties led the Nation in cumulative cases per 100,000 residents.
The entire country experienced high weekly rates of new COVID-19 cases throughout the third surge, which started in late September 2020. No county type led the surge. The third surge ended after a steep decline in new infections in late January and February 2021, and cumulative cases leveled out with the help of vaccines. The fourth surge began in July 2021 with the spread of the Delta variant. Rural counties were most affected by this surge, with rural persistently poor counties again leading new infections through much of the surge. In early September 2021, the disparity in cumulative case rates between rural persistently poor counties and all other counties reached its highest level, while the cumulative case rate of not persistently poor rural counties surpassed the rate of persistently poor urban counties for the first time since the pandemic began.
A fifth, ongoing, surge started in November 2021 but accelerated in late December with the spread of the highly infectious Omicron variant. This surge is led by urban counties, particularly persistently poor urban counties, resulting in a sharp increase in cumulative cases. Despite these gains, as of mid-January 2022, persistently poor rural counties continued to lead the country in cumulative COVID-19 cases per 100,000 residents.
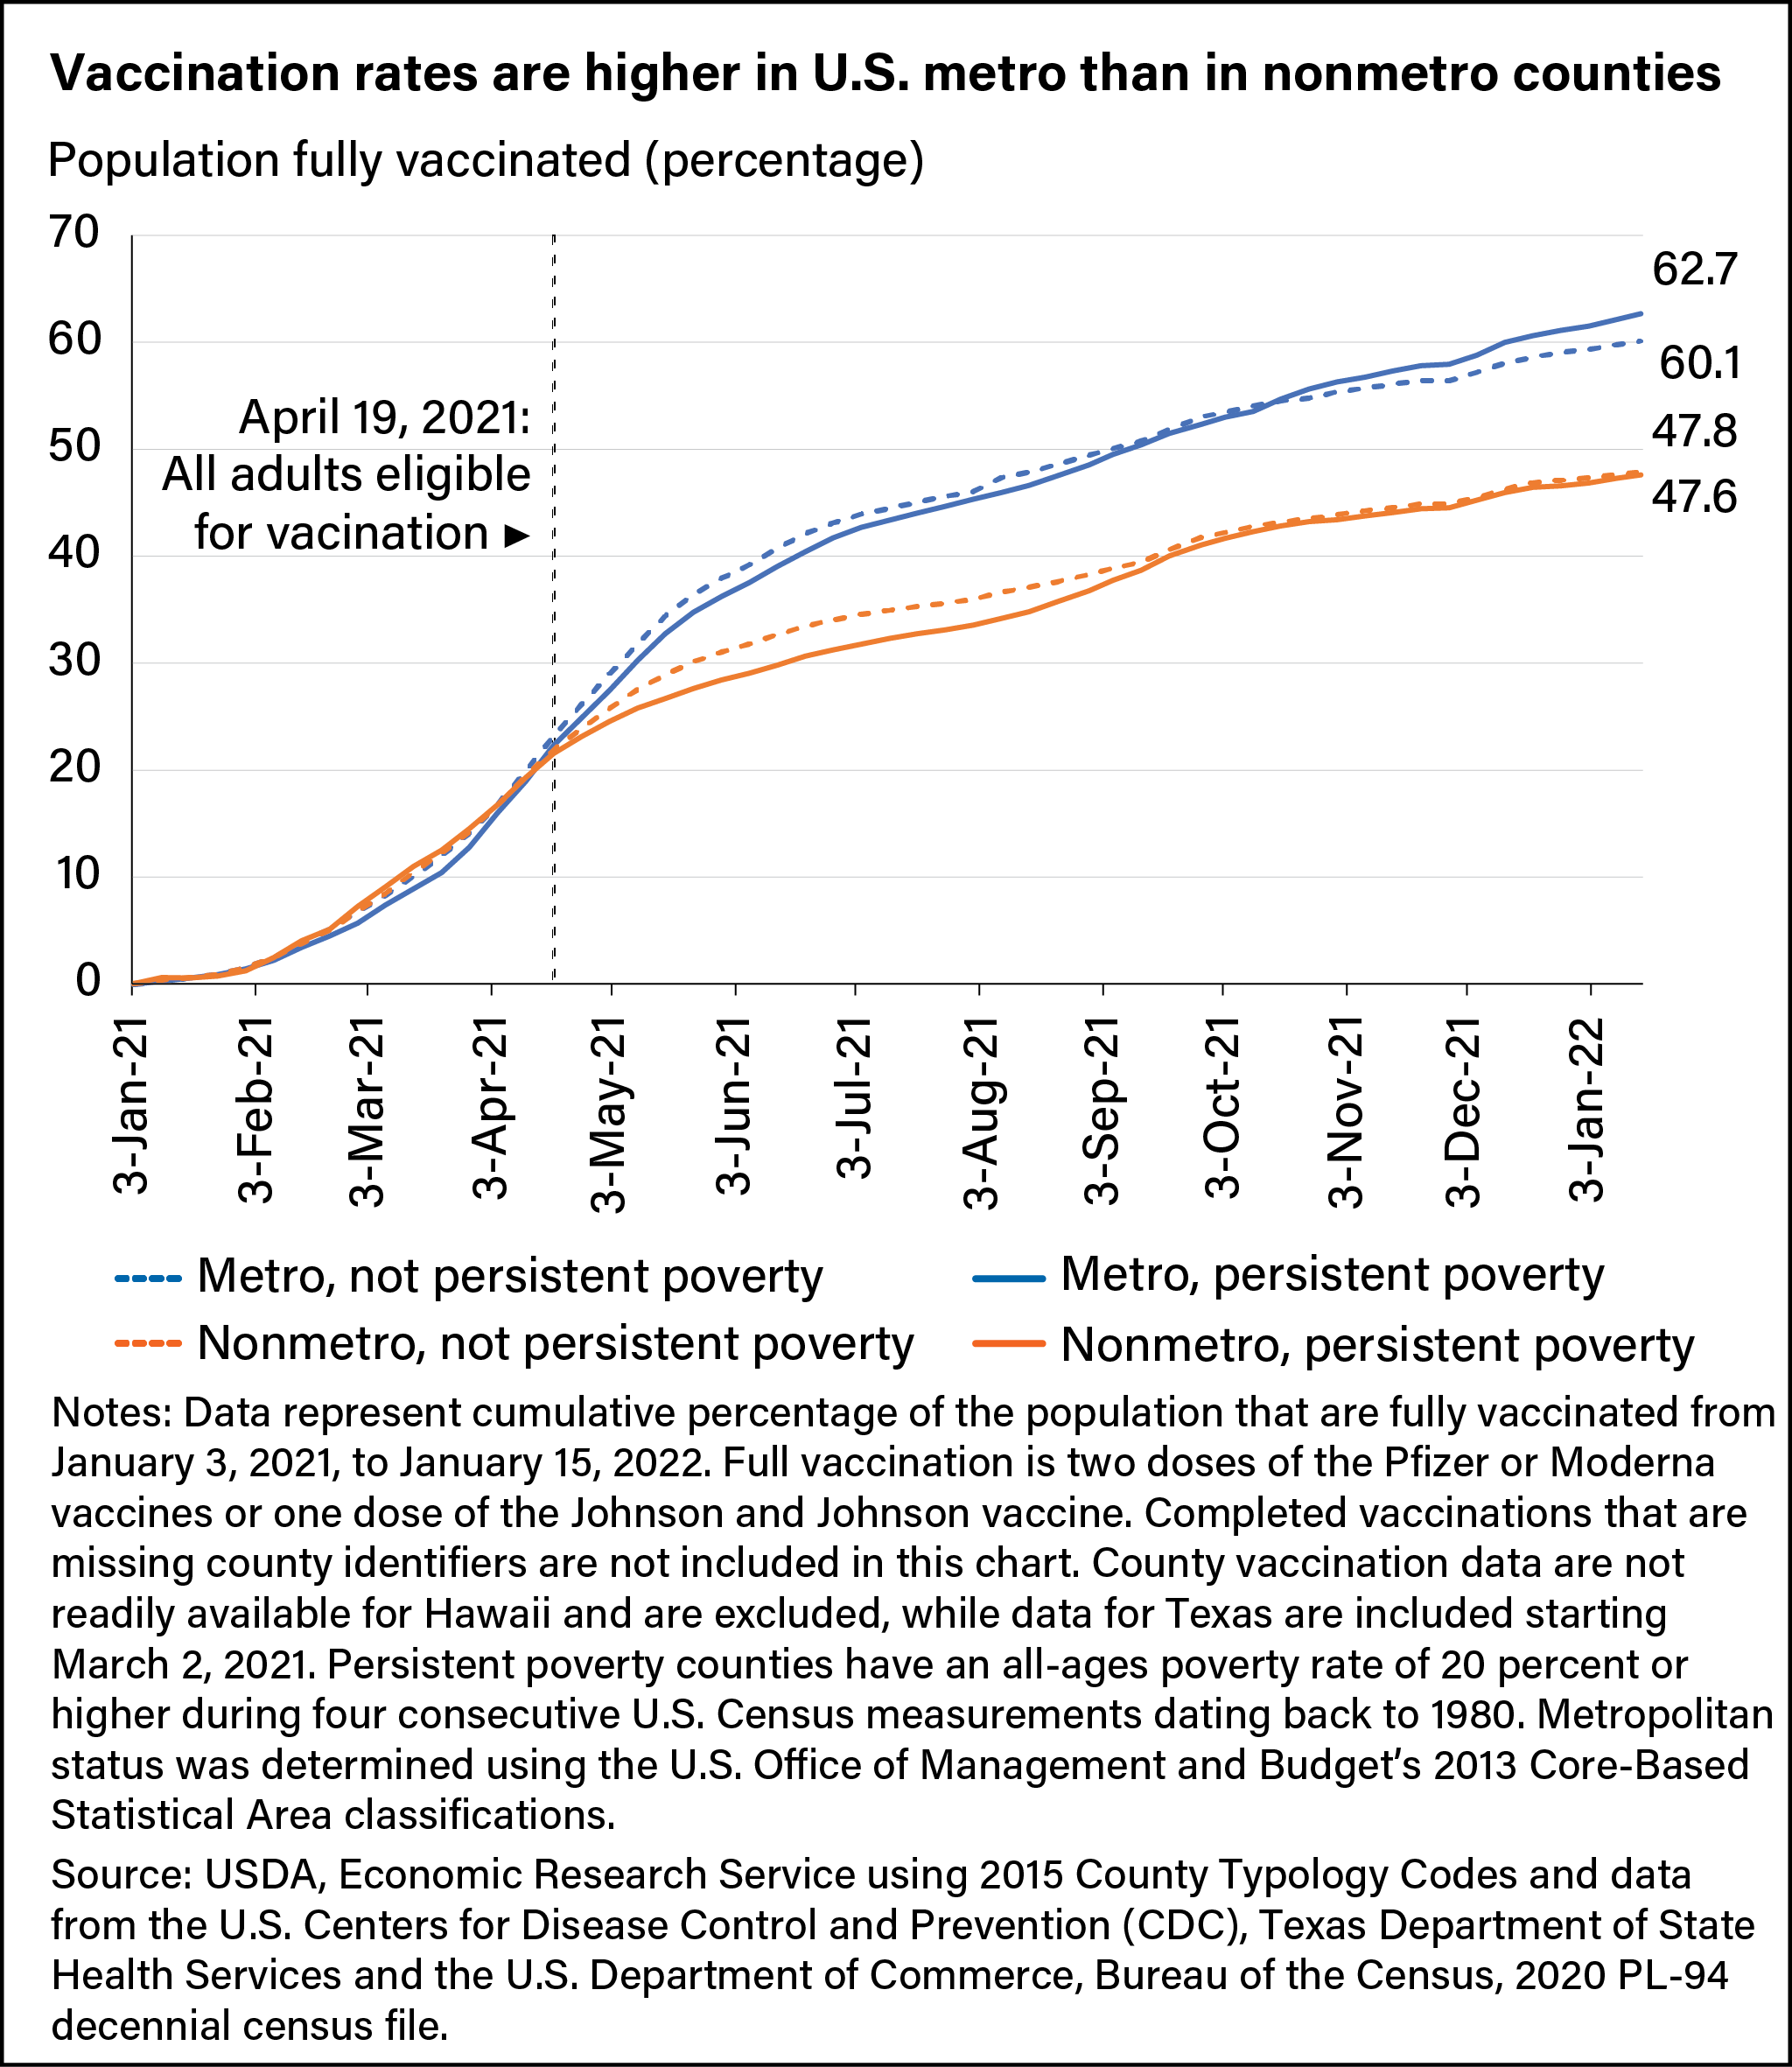
Vaccinations started in mid-December 2020 during the peak of the third surge in COVID-19 cases. Vaccinated people are less likely to contract or spread the disease and less likely to have a severe case if they do, allowing them to safely resume many pre-pandemic activities, like returning to work in-person. During the early phases of vaccination, eligibility was restricted to frontline health care workers, adults ages 65 and over, individuals with high-risk medical conditions, and essential workers. At that time, the percentage of fully vaccinated people increased at roughly the same rate throughout the United States, and, by mid-April 2021, vaccination rates were slightly above 20 percent.
After April 19, 2021, when all adults became eligible for vaccinations nationwide, the share of fully vaccinated residents increased faster in urban counties than in rural counties, but the vaccination rate was slightly lower in persistently poor counties than in other counties. The gap in vaccination rates between persistently poor and other counties started to close in mid-August, and in mid-October 2021 vaccination rates in persistently poor urban counties surpassed rates in urban counties that were not persistently poor. However, the rural-urban vaccination gap persists. In mid-January 2022, the urban vaccination rate was more than 60 percent, while the rural vaccination rate was nearly 48 percent, and about 39 percent of fully vaccinated people had received a booster shot in both urban and rural counties.
While the higher case rates in persistently poor rural counties stem from a complex set of economic, social, and demographic factors, in some cases, the mix of jobs across industries played a direct role. For example, meatpacking industry jobs, which are located disproportionately in persistently poor counties, acted as a catalyst for COVID-19 outbreaks during the pandemic’s early months. These outbreaks were likely attributable to the nature of the work and the fact that meatpacking employees continued to work as outbreaks were occurring. Ultimately, meatpacking plants functioned as the primary vectors of spread in their communities.
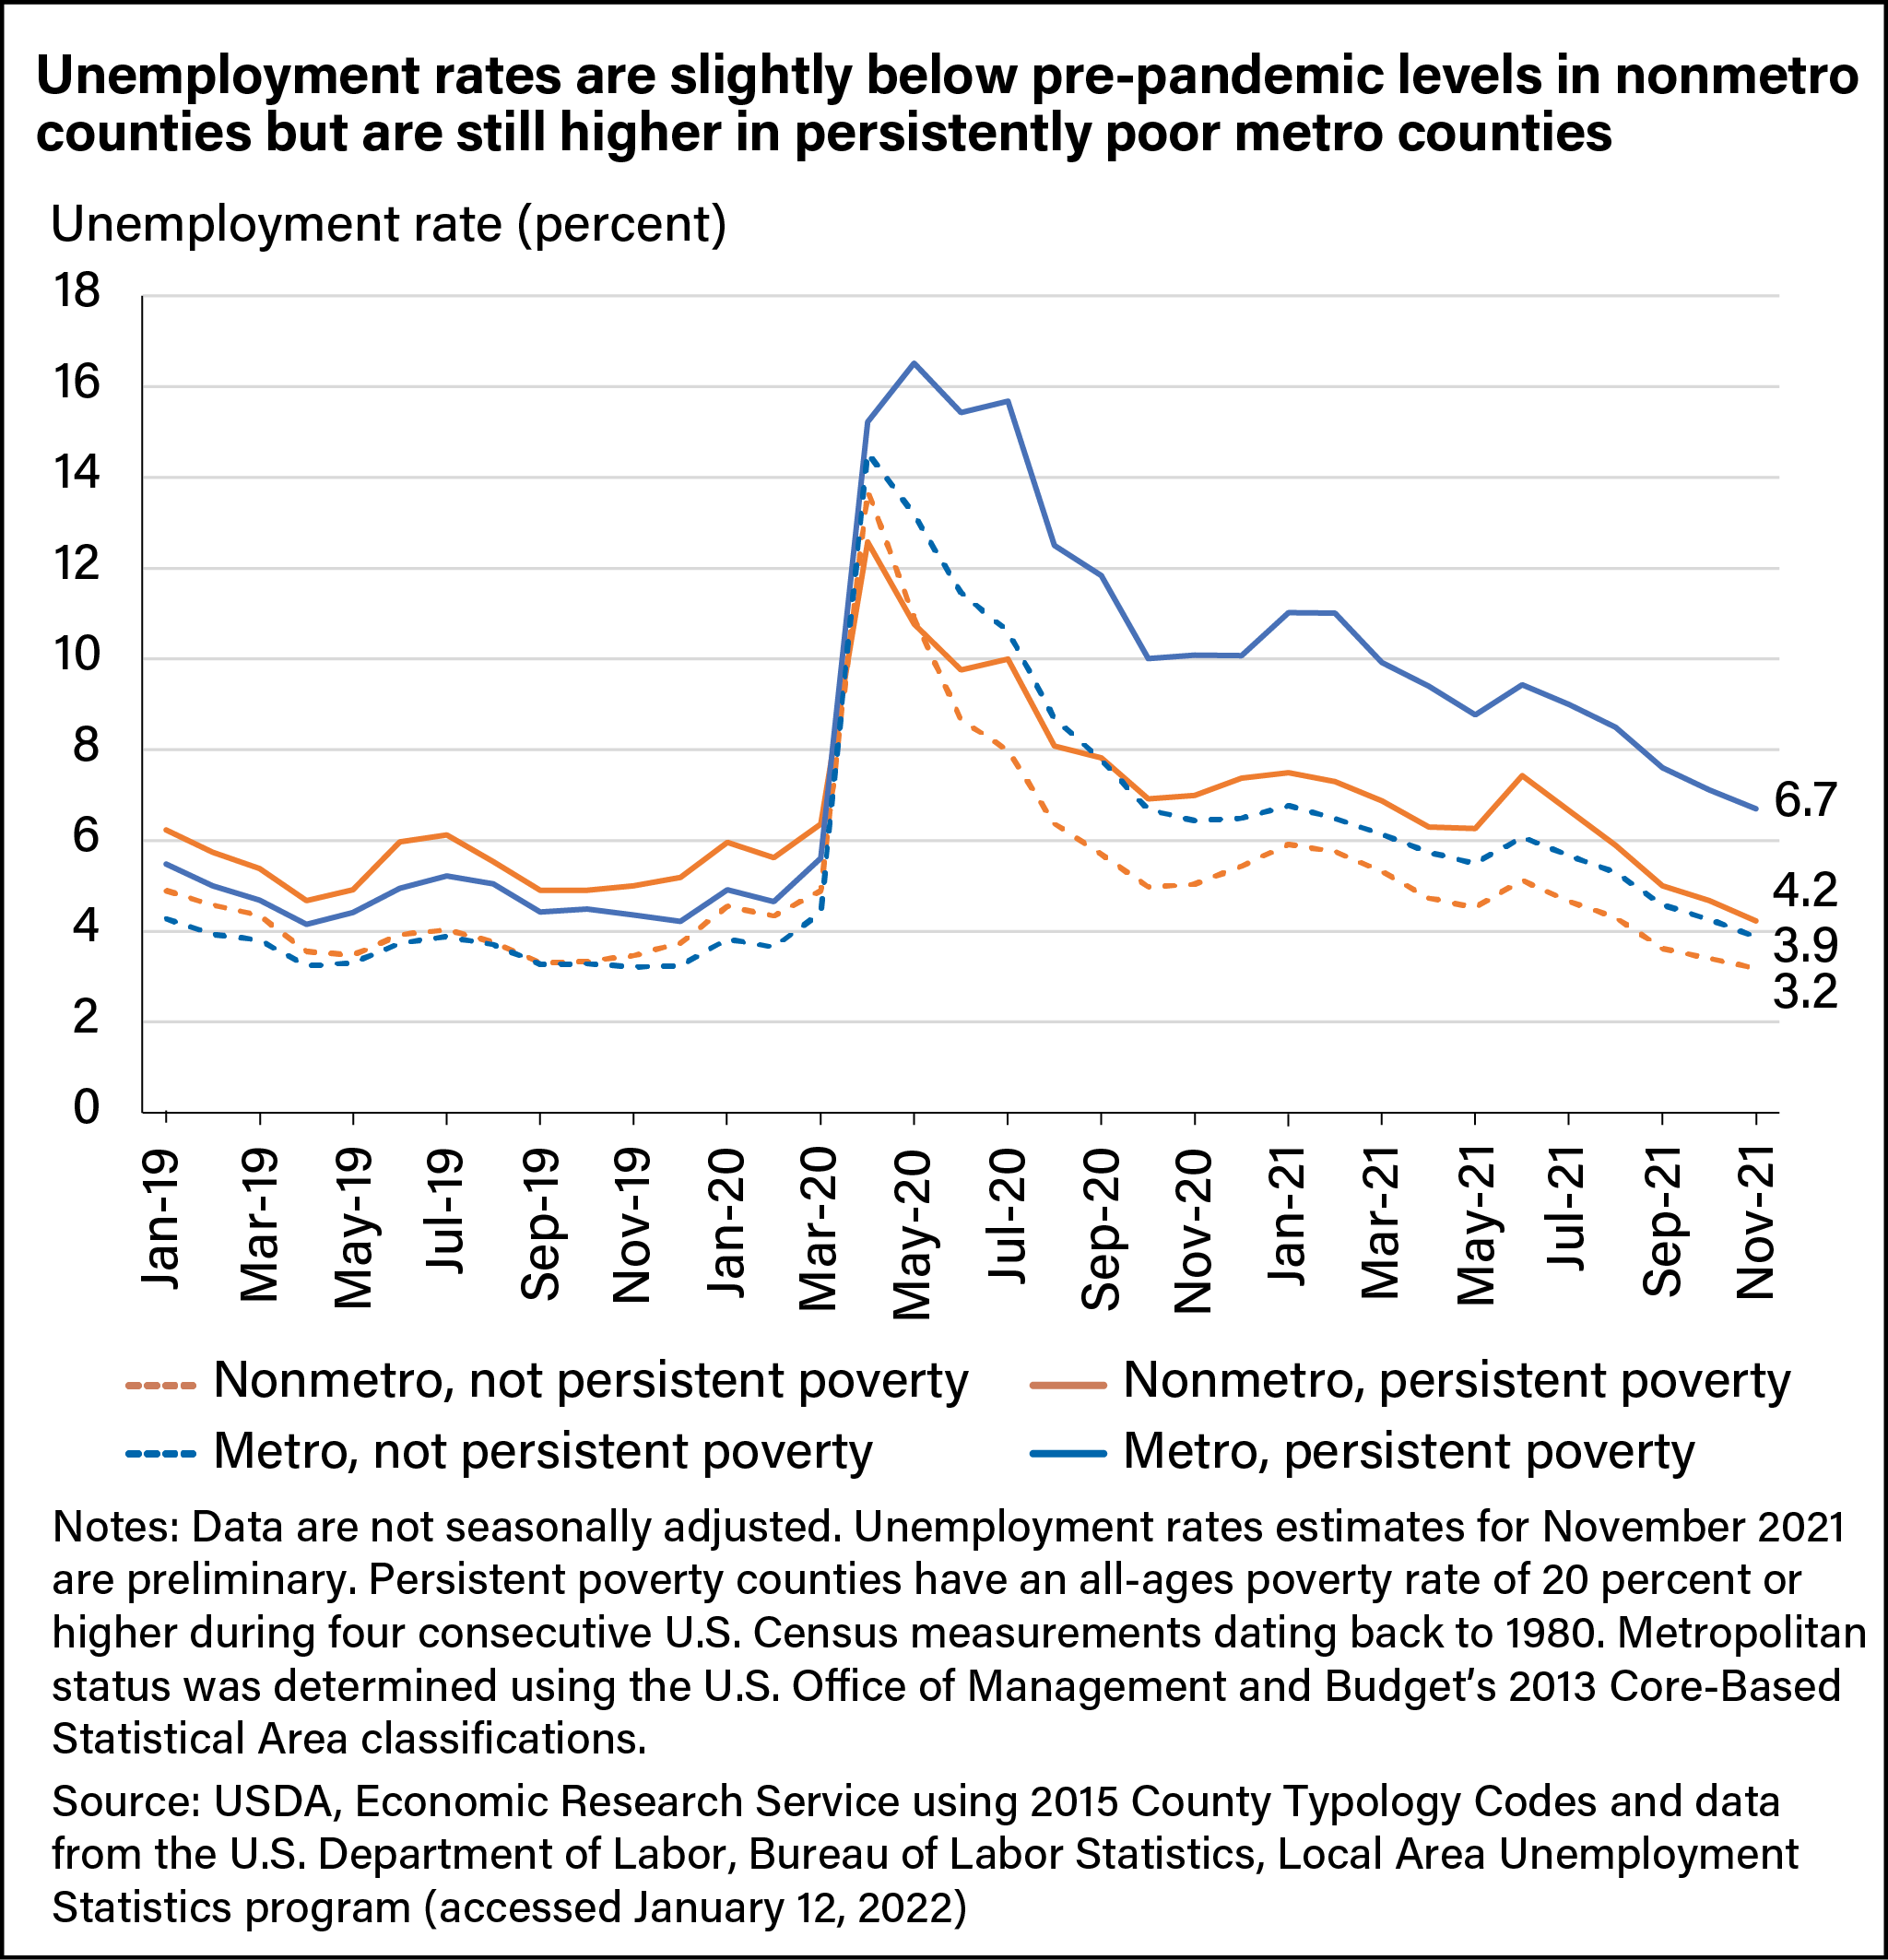
Generally, employment in persistently poor rural counties was less affected by the pandemic-driven economic downturn in the spring of 2020 compared with not persistently poor counties. While persistently poor rural counties had a higher unemployment rate than other rural counties before the pandemic-driven economic downturn (6 percent versus 4.6 percent in January 2020), they experienced the smallest increase in unemployment rates during the recession. By April 2020, the unemployment rate in persistently poor rural counties had more than doubled to peak at 12.6 percent, while the unemployment rate in not persistently poor rural counties more than tripled, surpassing persistently poor rural counties to peak at 13.7 percent. Urban areas also experienced a larger increase in unemployment rates in not persistently poor counties than in persistently poor counties, suggesting that the employment shock at the start of the pandemic was not as large in persistently poor counties when compared with other counties.
The initial employment recovery appeared stronger in rural counties than in urban counties, with the unemployment rate in not persistently poor rural counties returning to a rate below that of persistently poor rural counties in June 2020. As of November 2021, unemployment rates in rural counties were slightly below pre-pandemic levels, with the lowest rate in not persistently poor counties (3.2 percent), while the unemployment rate remained elevated in persistently poor urban counties (6.7 percent).
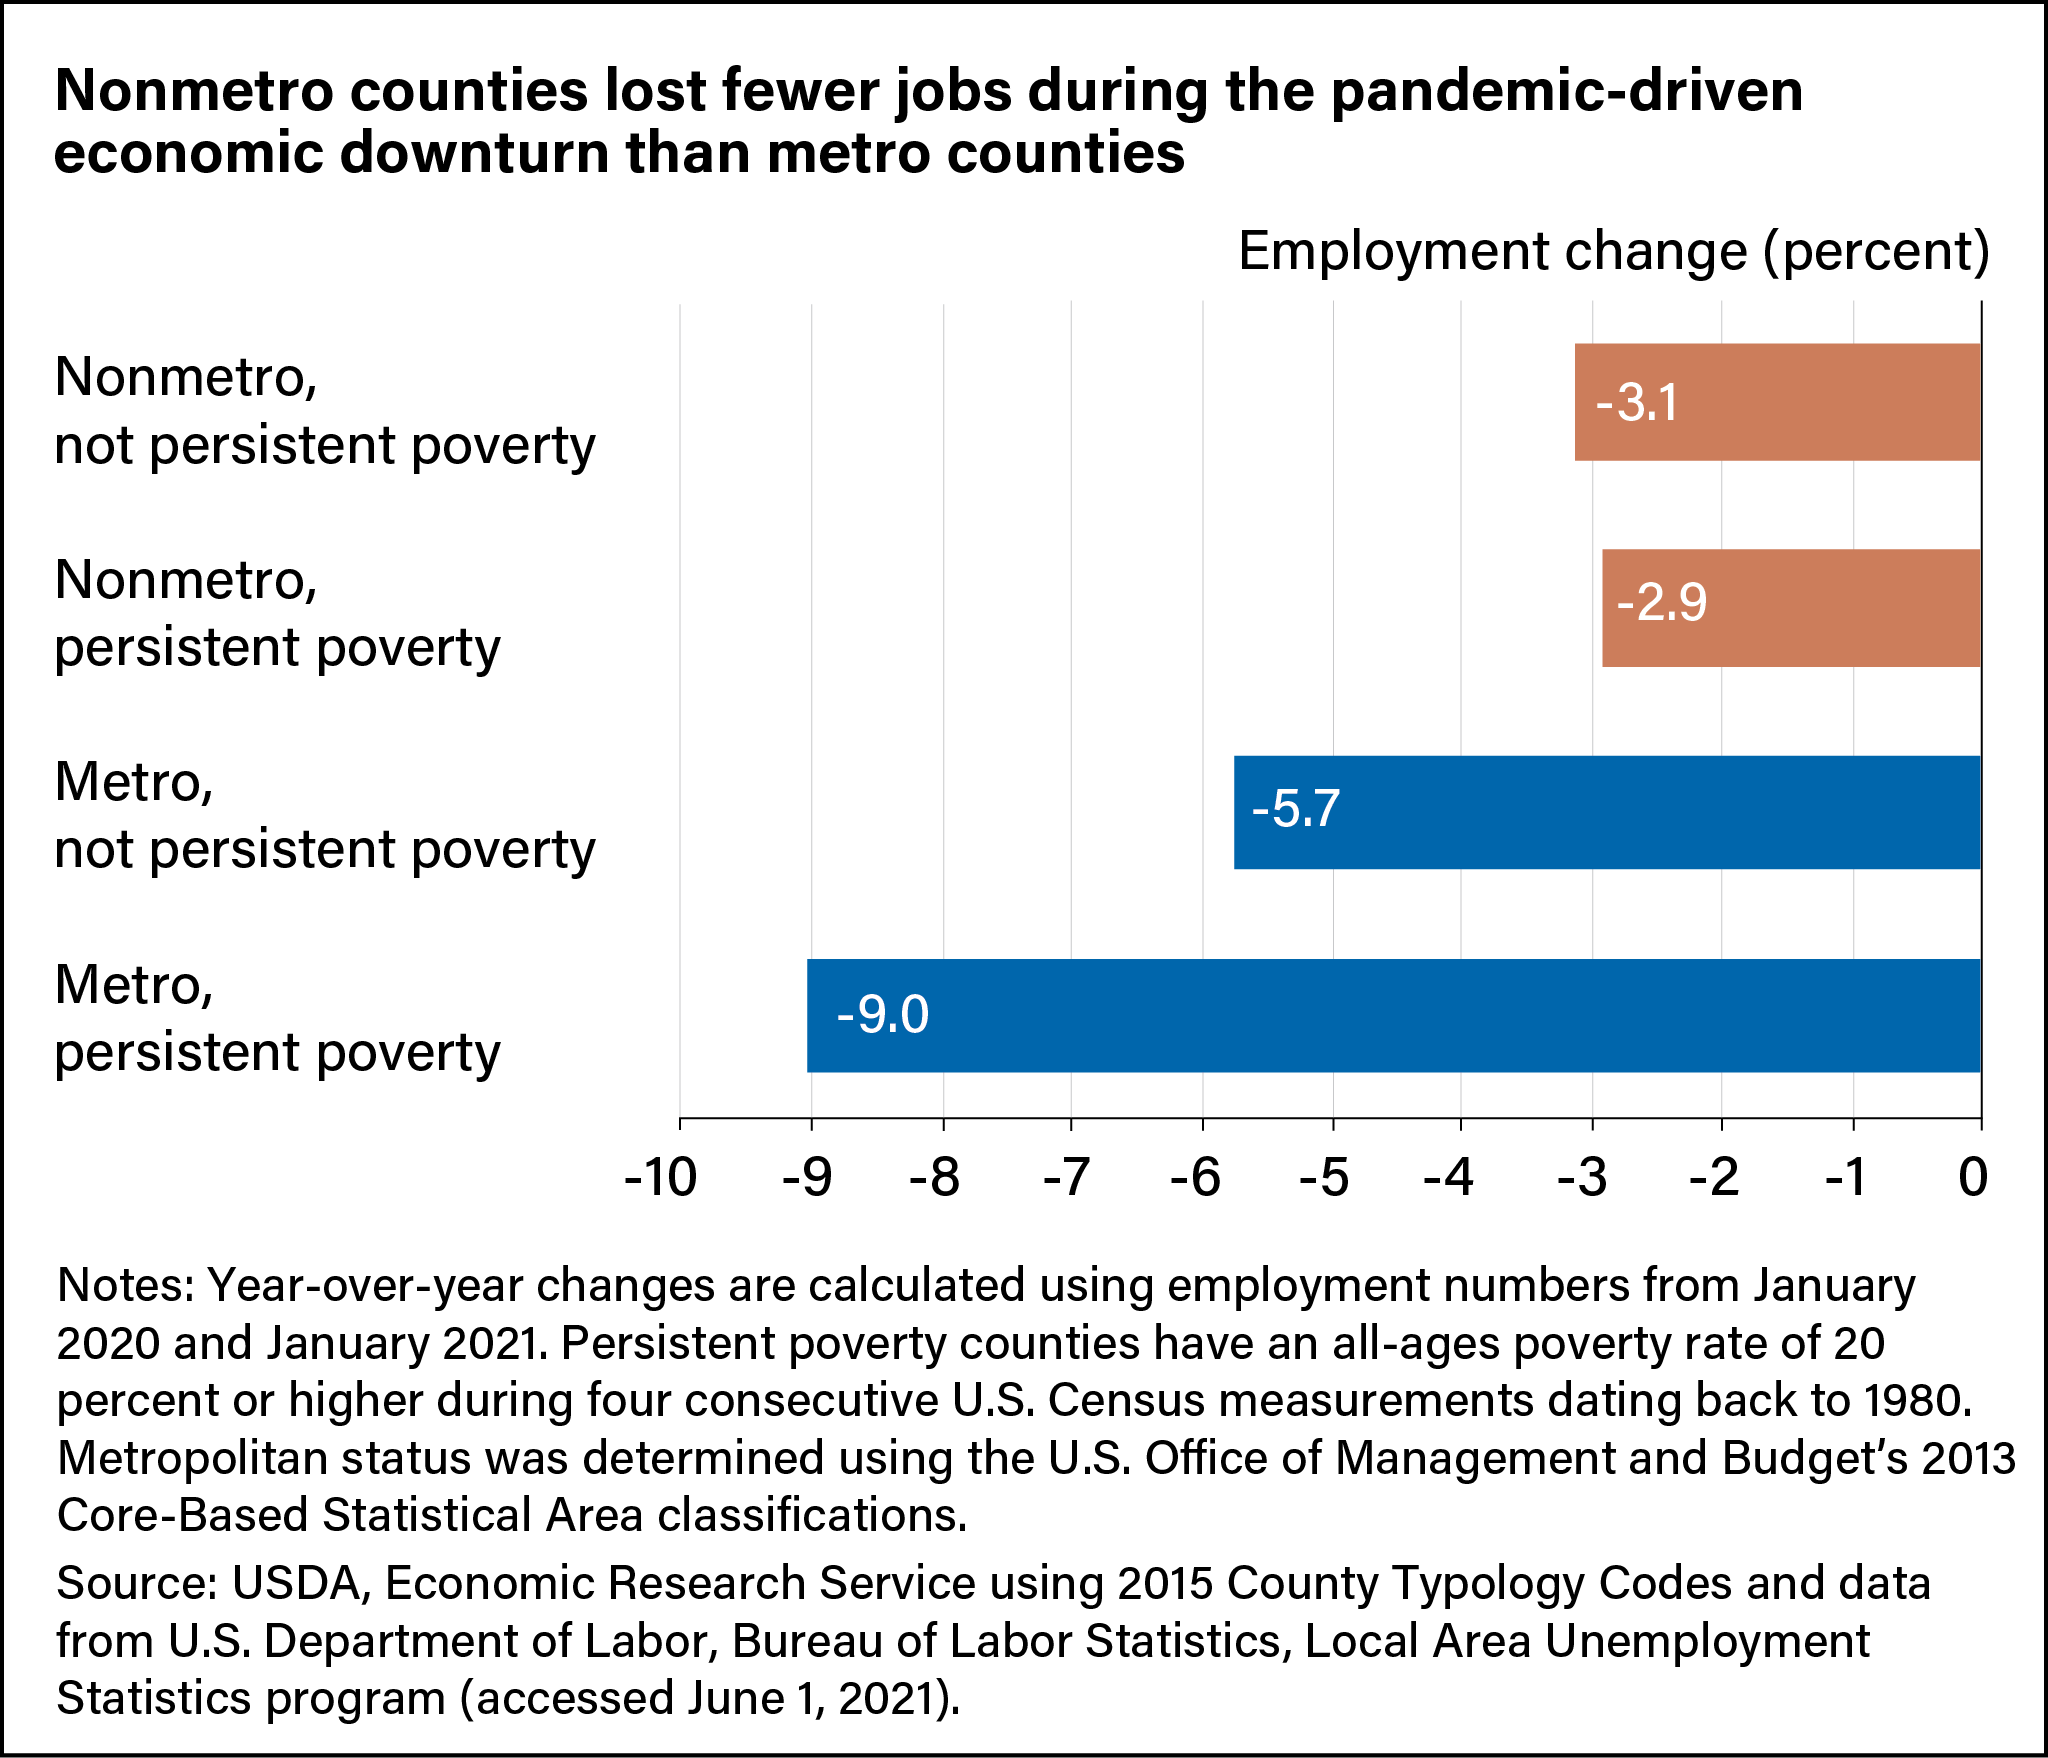
Looking at changes in employment provides another perspective on the pandemic’s economic impact. The decrease in employed workers was smaller in rural counties than urban counties between January 2020 and January 2021, with rural persistent poverty counties having the smallest loss in employment (–2.9 percent). Urban persistent poverty counties had the most significant decrease in employment (–9 percent), consistent with the elevated unemployment rates that continue in these counties.
This article was drawn from the Rural America at a Glance: 2021 Edition, and some of the data in the article has been updated since the publication of that report.
This article is drawn from:
- Dobis, E.A., Krumel, T., Cromartie, J., Thomas (Conley), K.L., Sanders, A. & Ortiz, R. (2021). Rural America at a Glance: 2021 Edition. U.S. Department of Agriculture, Economic Research Service. EIB-230.
- Krumel, T. & Goodrich, C. (2021). COVID-19 Working Paper: Meatpacking Working Conditions and the Spread of COVID-19. U.S. Department of Agriculture, Economic Research Service. AP-092.
You may also like:
- Farrigan, T. (2021, August 9). Rural Poverty Has Distinct Regional and Racial Patterns . Amber Waves, U.S. Department of Agriculture, Economic Research Service.
- Dobis, E.A. & McGranahan, D. (2021, February 1). Rural Residents Appear to be More Vulnerable to Serious Infection or Death From Coronavirus COVID-19. Amber Waves, U.S. Department of Agriculture, Economic Research Service.
- Rural Poverty & Well-Being. (n.d.). U.S. Department of Agriculture, Economic Research Service.
- Rural America. (n.d.). U.S. Department of Agriculture, Economic Research Service.
- Atlas of Rural and Small-Town America. (n.d.). U.S. Department of Agriculture, Economic Research Service.
We’d welcome your feedback!
Would you be willing to answer a few quick questions about your experience?


