Net Cash Farm Income Trends Over the Past Decade Have Varied By State
- by Greg Lyons and Carrie Litkowski
- 10/1/2019
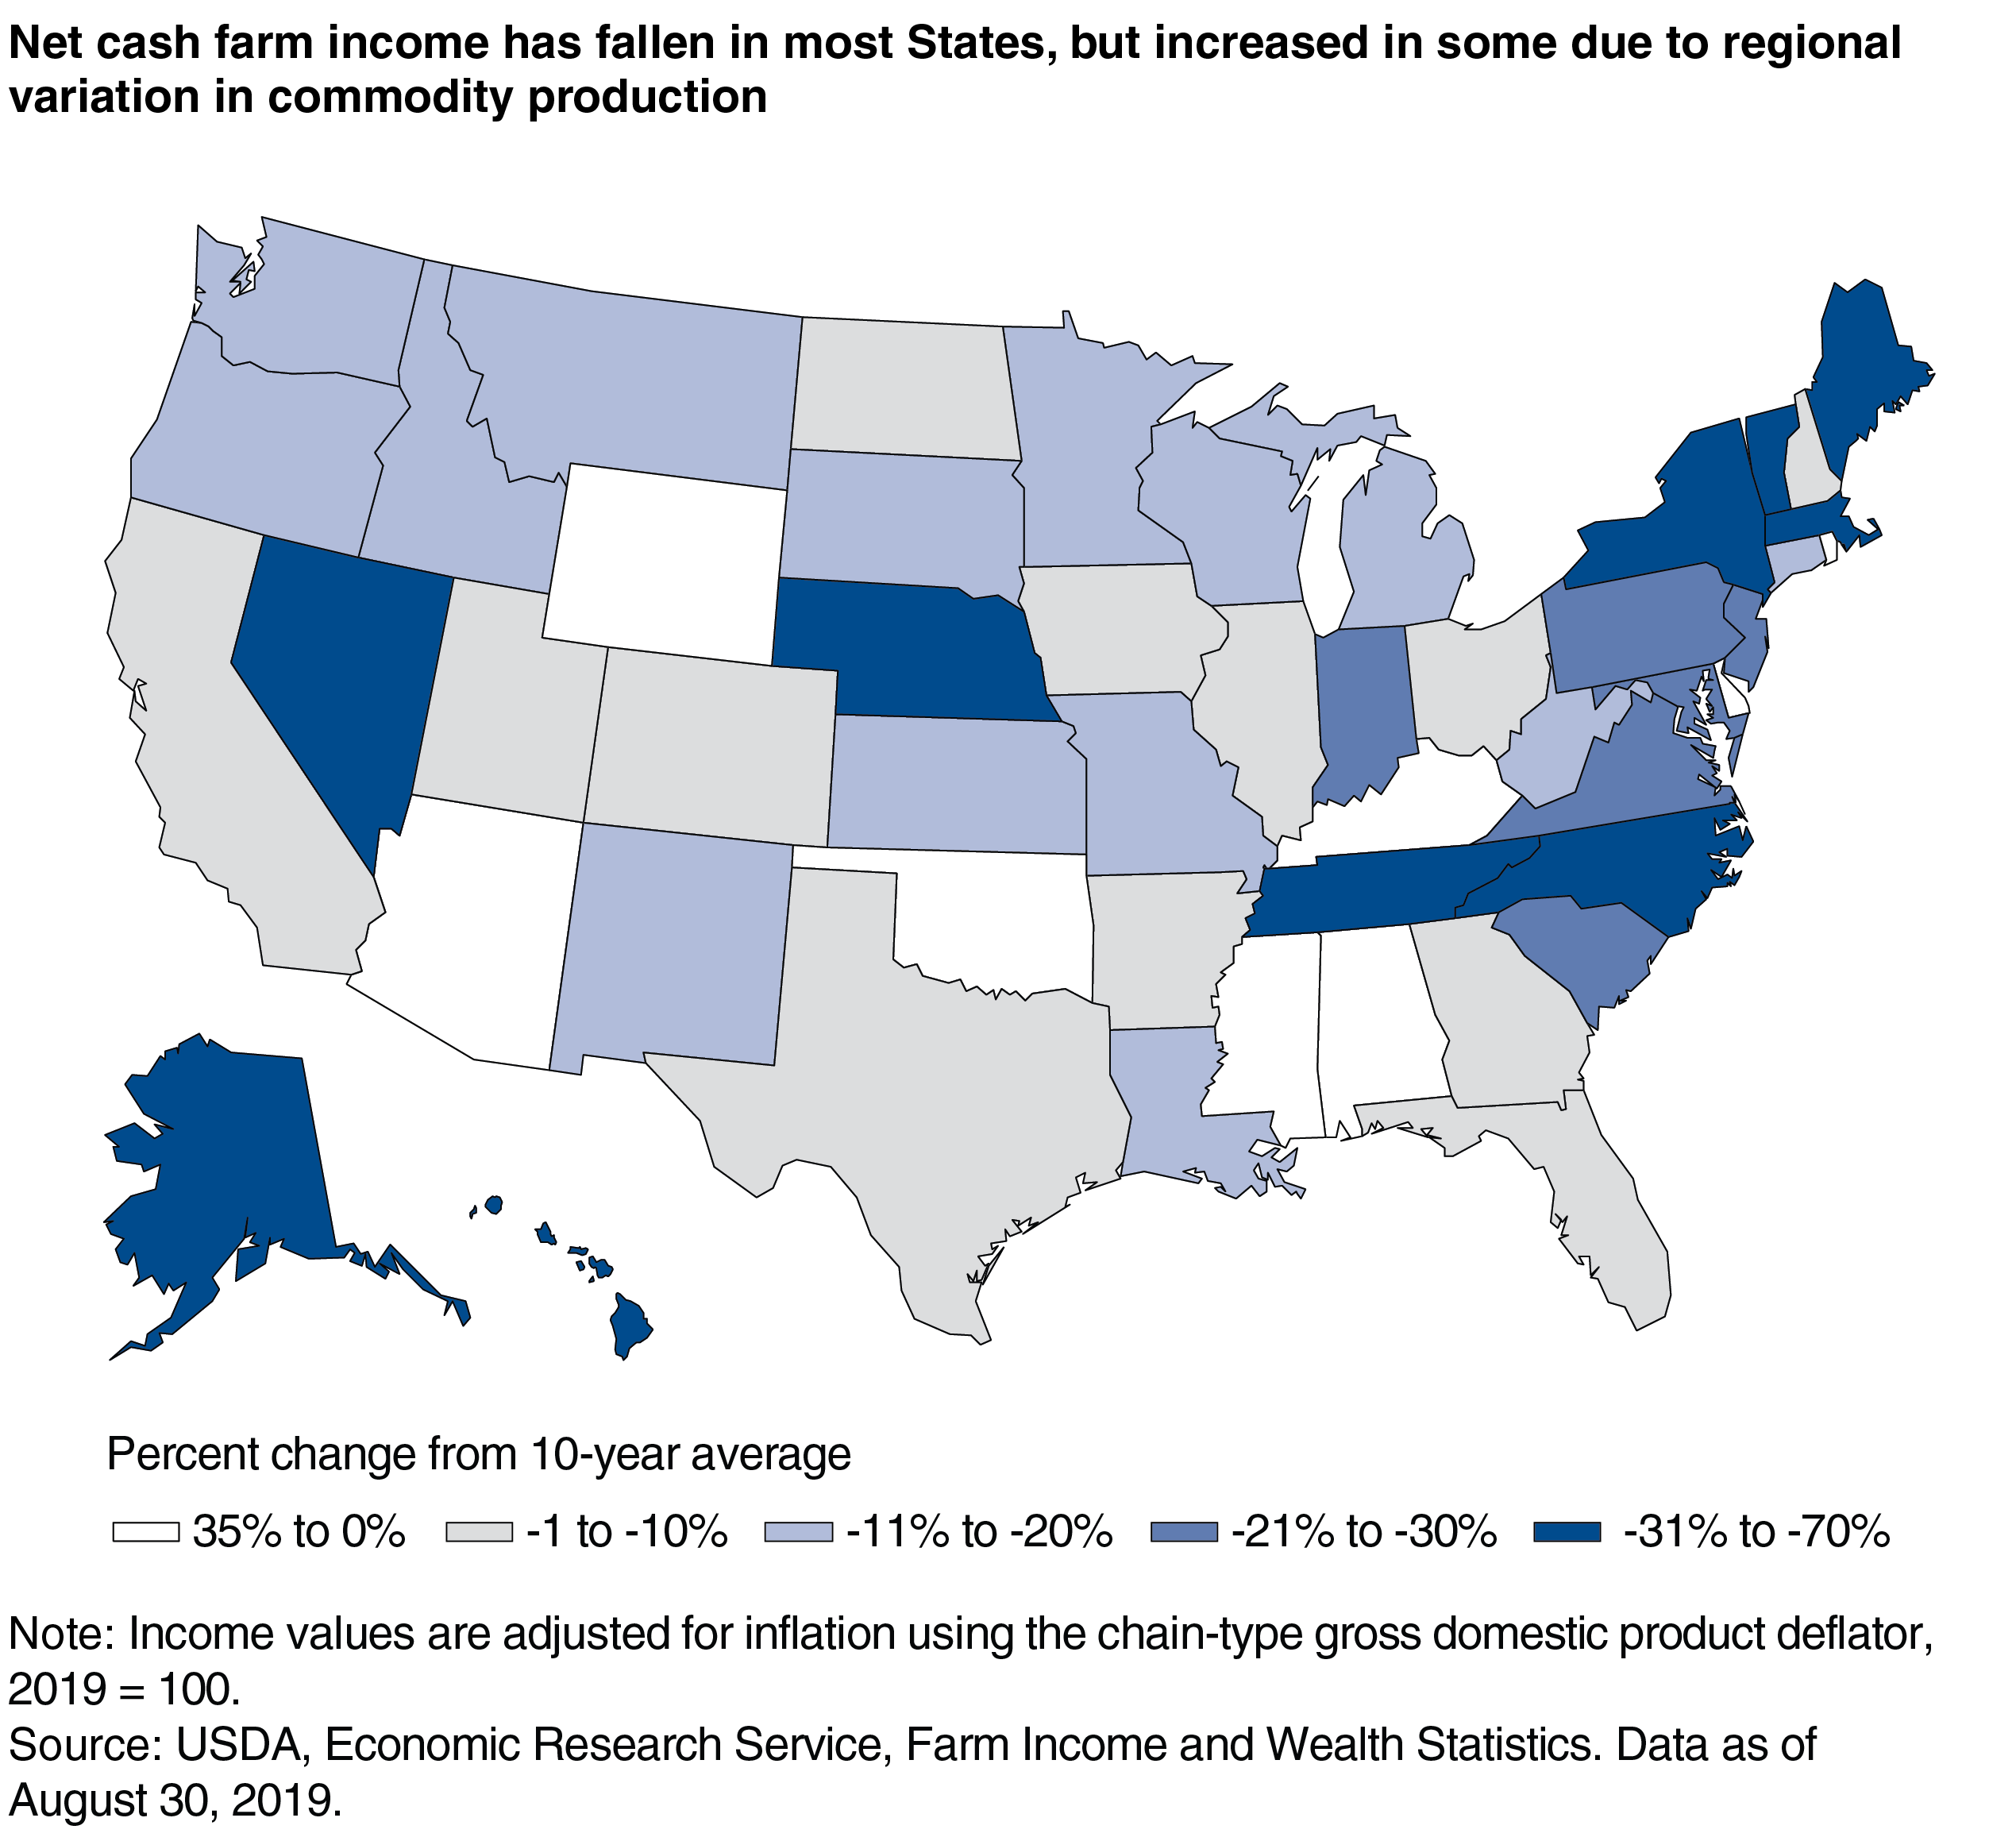
ERS estimates that U.S. net cash farm income (NCFI) was $106.9 billion in 2018, which was 12 percent below its 10-year average of $121.0 billion when adjusted for inflation. NCFI is a measure of farm-sector earnings that includes cash receipts from farming as well as farm-related income, including government payments, minus cash expenses. In other words, it is a measure of the profitability of farming and, hence, the ability of farmers to continue production, invest in new machinery, expand their operations, meet their loan obligations, and provide for family living expenses. Strong commodity prices and agricultural exports from 2011 to 2014 resulted in high U.S. NCFI during that period. Since then, U.S. NCFI income has trended lower. Relative to their 10-year averages, receipts for grains are notably lower in 2018 and contribute to lower U.S. NCFI in 2018. While U.S. NCFI in 2018 remains below average, declines from these recent highs have not been experienced uniformly by all States.
Most States’ NCFI declined in 2018 relative to their 10-year averages, but eight States saw NCFI increase. These States were Delaware, Mississippi, Rhode Island, Arizona, Kentucky, Wyoming, Alabama, and Oklahoma. In contrast, Tennessee, Nebraska, and North Carolina saw some of the largest declines. Regional variation in commodity production and expenses contributed to these differences. For example, lower dairy receipts in 2018 contributed to lower NCFI for several States, including Vermont, Pennsylvania, and Wisconsin.
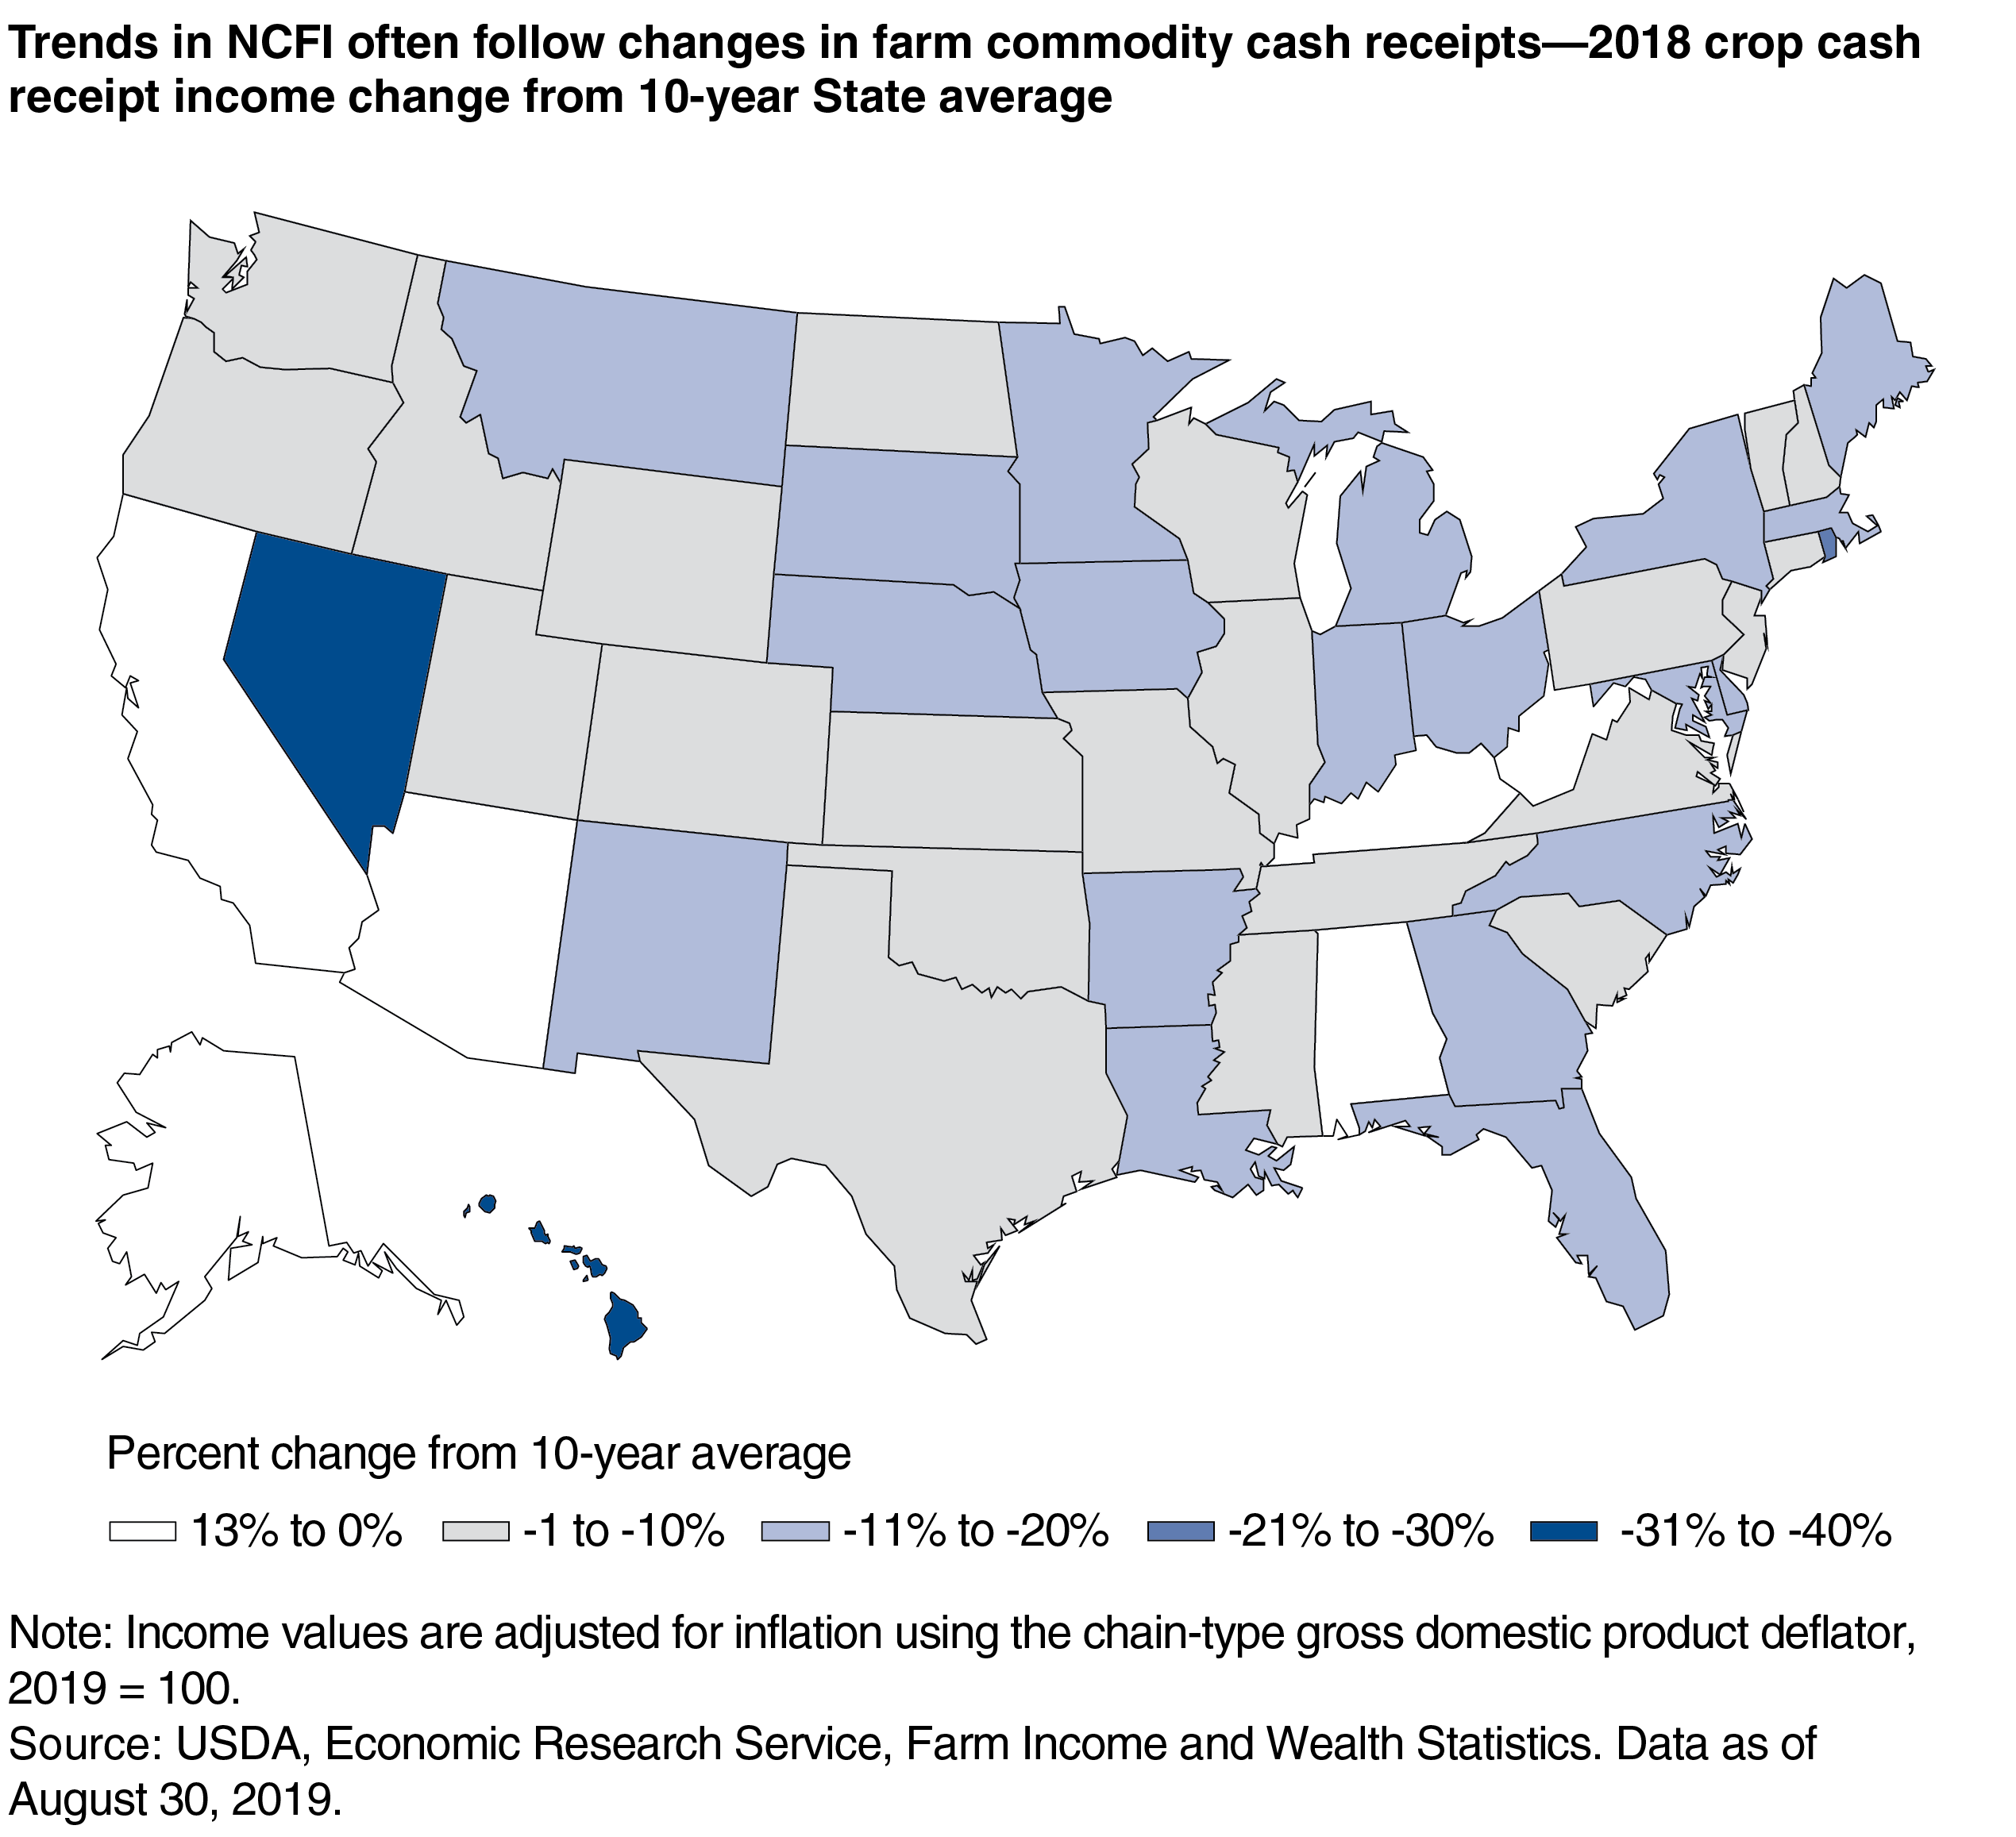
Receipts from commodity production account for about 90 percent of farm-sector income before subtracting expenses. Trends in NCFI often follow changes in cash receipts from crops, as well as animals and animal products. The regional pattern of changes in crop cash receipts shows some similarities to that of net cash farm income overall. However, additional drivers and trends arise due to regional crop commodity specialization. Six States saw crop cash receipts increase in 2018 relative to their averages. Of those States, California and Arizona saw the largest dollar increases following higher fruit and nuts receipts in California and vegetable and melons receipts in Arizona. States where corn and soybeans account for a large share of total crop cash receipts, such as Iowa, Illinois, Indiana, and Nebraska, saw some of the largest declines in crop cash receipts following declines in prices.
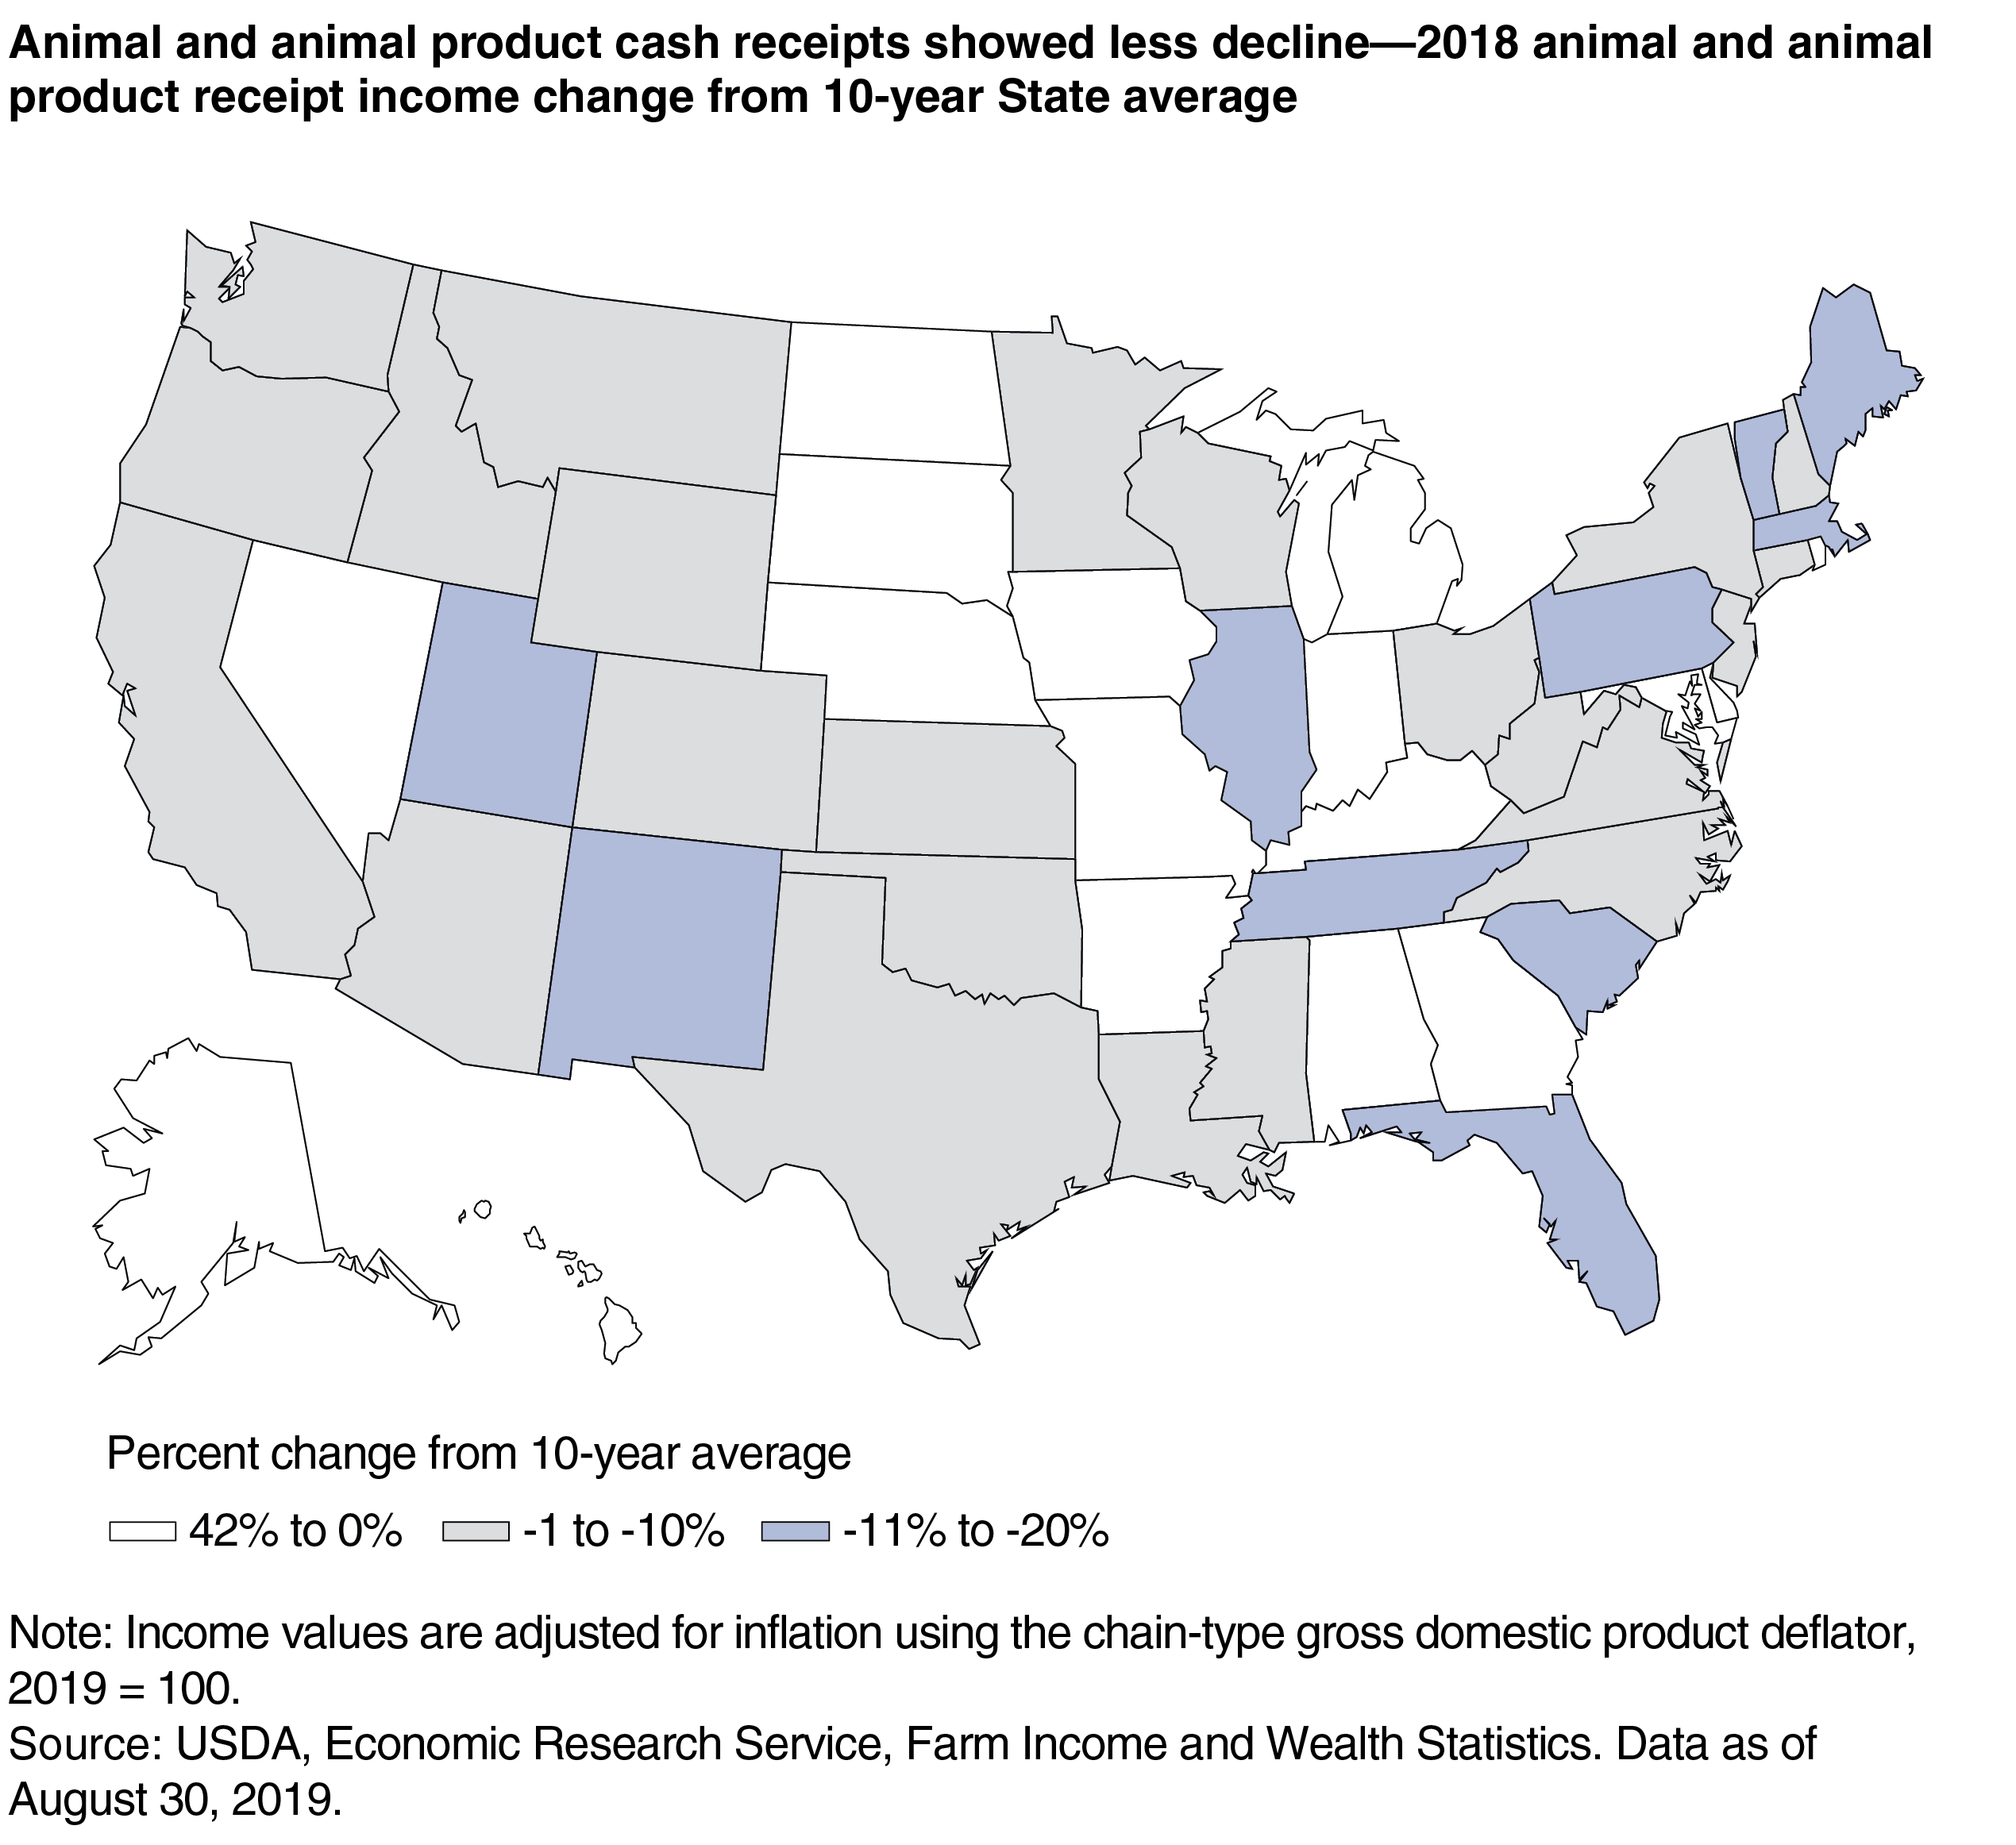
Animal and animal product cash receipts saw regional patterns that were almost opposite to crop cash receipts. Seventeen States saw animal and animal product cash receipts increase in 2018 relative to their averages. Of those States, several benefited from higher receipts for poultry and eggs, including Delaware, Arkansas, and Georgia. Receipts from hogs contributed to declines in total animal and animal product receipts for Utah and Illinois, but contributed to higher receipts for Iowa. Lower dairy receipts in 2018 impacted several States in the Northwest.
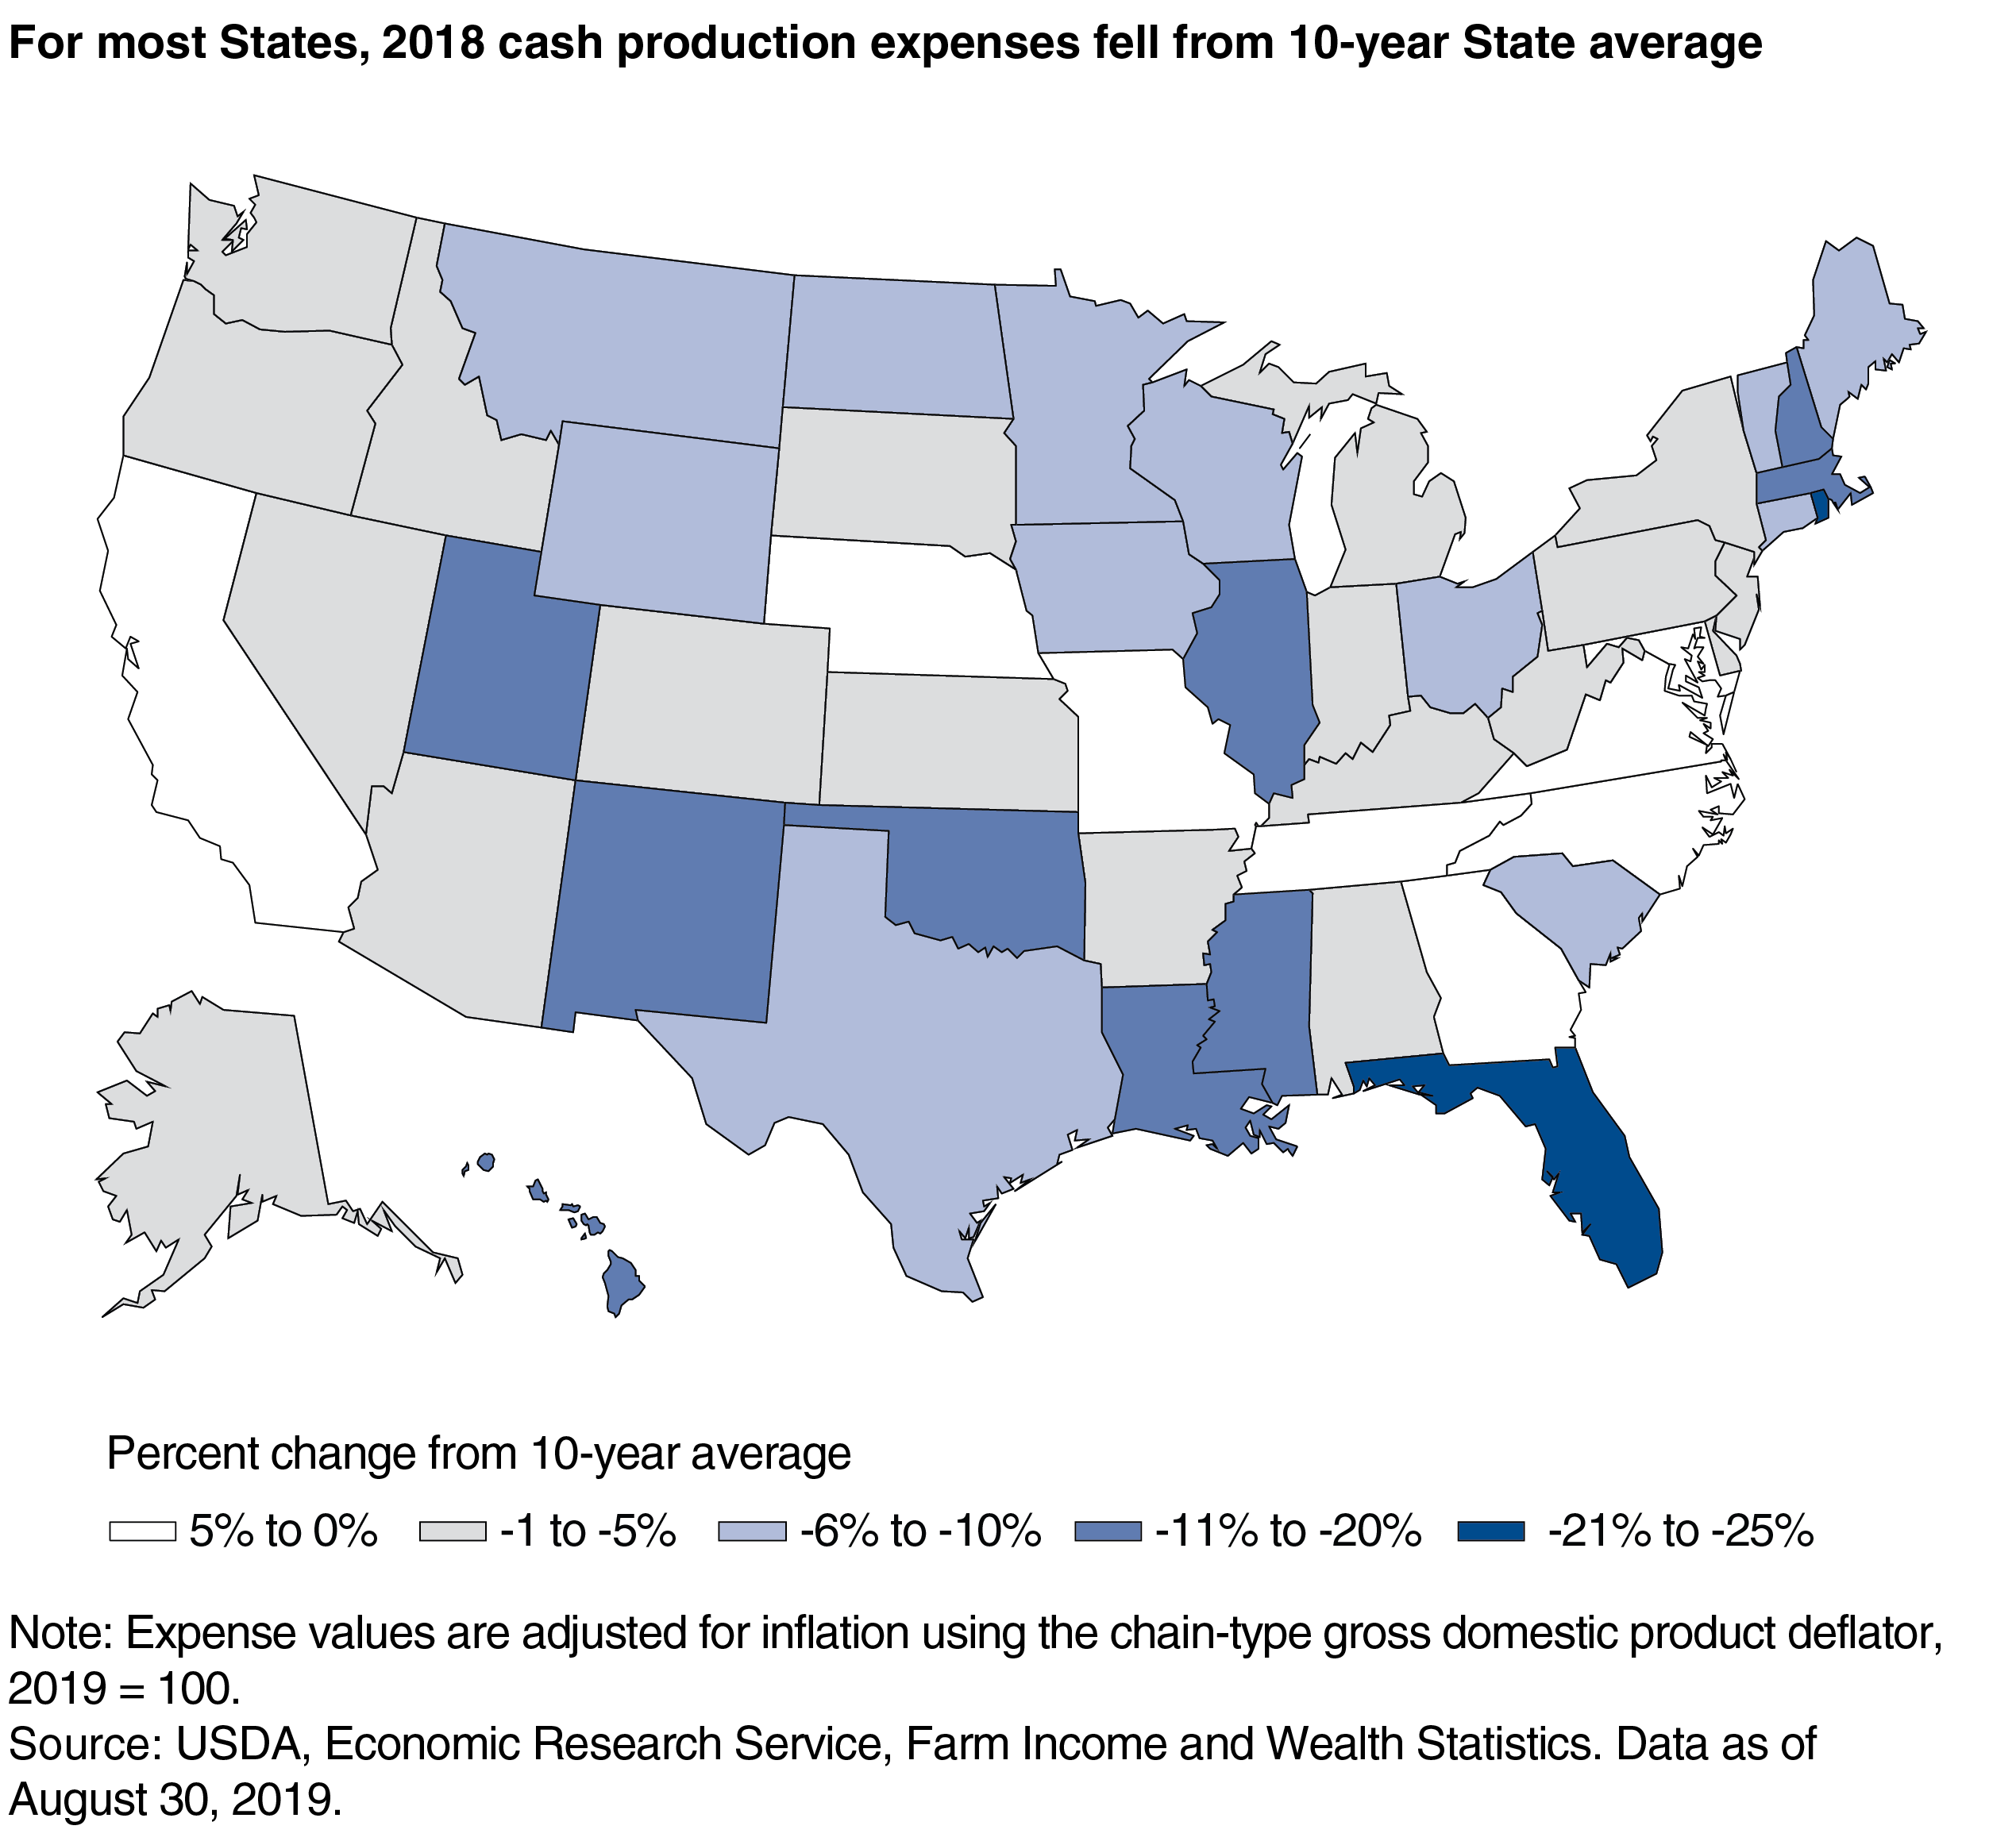
While most States saw total cash receipts decline in 2018, most also saw cash expenses decline in 2018. Only eight States saw cash expenses increase in 2018 relative to their averages. For Missouri, Nebraska, North Carolina, and Tennessee, higher spending on livestock and poultry purchases contributed to higher cash expenses. Spending on feed contributed to overall lower cash expenses in New Mexico, Mississippi, and Utah.
While cash expenses declined for most States, these declines were not enough to offset declines in cash receipts. As a result, NCFI in 2018 for the entire United States and most single States is below their 10-year averages. However, for some States, including Mississippi, Oklahoma, and Wyoming, lower expenses more than made up for lower cash receipts, resulting in higher NCFI in 2018 relative to their averages. Differences among the States were due largely to commodity specializations.
This article is drawn from:
- Farm Income and Wealth Statistics. (n.d.). U.S. Department of Agriculture, Economic Research Service.
You may also like:
- Corn and Other Feed Grains. (n.d.). U.S. Department of Agriculture, Economic Research Service.
- Farm Sector Income & Finances. (n.d.). U.S. Department of Agriculture, Economic Research Service.
- Land Use, Land Value & Tenure. (n.d.). U.S. Department of Agriculture, Economic Research Service.
- Farm Household Well-being. (n.d.). U.S. Department of Agriculture, Economic Research Service.
- Soybeans and Oil Crops. (n.d.). U.S. Department of Agriculture, Economic Research Service.
We’d welcome your feedback!
Would you be willing to answer a few quick questions about your experience?


