

County-Level Data Show Changes in the Number and Concentration of Food Stores
- by Alana Rhone
- 5/7/2018
ERS’s Food Environment Atlas assembles statistics on over 275 food environment indicators at the county or State level that provide a spatial overview of factors that can influence food choices and diet quality. One set of indicators focuses on the number and density of different types of stores that sell food. The Atlas provides a county-level count—both in total and on a per capita basis—of four types of stores. Understanding the geographic distribution of different types of food stores in a county, and whether that distribution has changed over time, is important to the economic well-being of communities for reasons related to employment opportunities, tax revenues, as well as business development.
This county-level picture of the food retailing landscape also provides a starting point for measuring access to healthy, affordable food—a measure explored in more detail in another ERS mapping tool, the Food Access Research Atlas. The Food Access Research Atlas allows users to investigate multiple measures of access at the census tract level. These measures include a population’s distance from residence to a large grocery store, supermarket, or supercenter; household availability of a vehicle to drive to the stores; and the poverty rate and median family income for census tracts.
The four types of stores mapped in the Food Environment Atlas are:
- Grocery stores (supermarkets), which include a full line of major food departments such as canned and frozen foods, fresh fruits and vegetables, and fresh and prepared meats, fish, and poultry.
- Supercenters and warehouse club stores, which have a full line of major food departments, along with a wide variety of general merchandise, such as apparel, furniture, and appliances.
- Convenience stores, which sell a limited line of nonfood goods and limited foods, such as milk, bread, soda, and snacks.
- Specialized food stores, which include retail bakeries, meat and seafood markets, dairy stores, and produce markets.
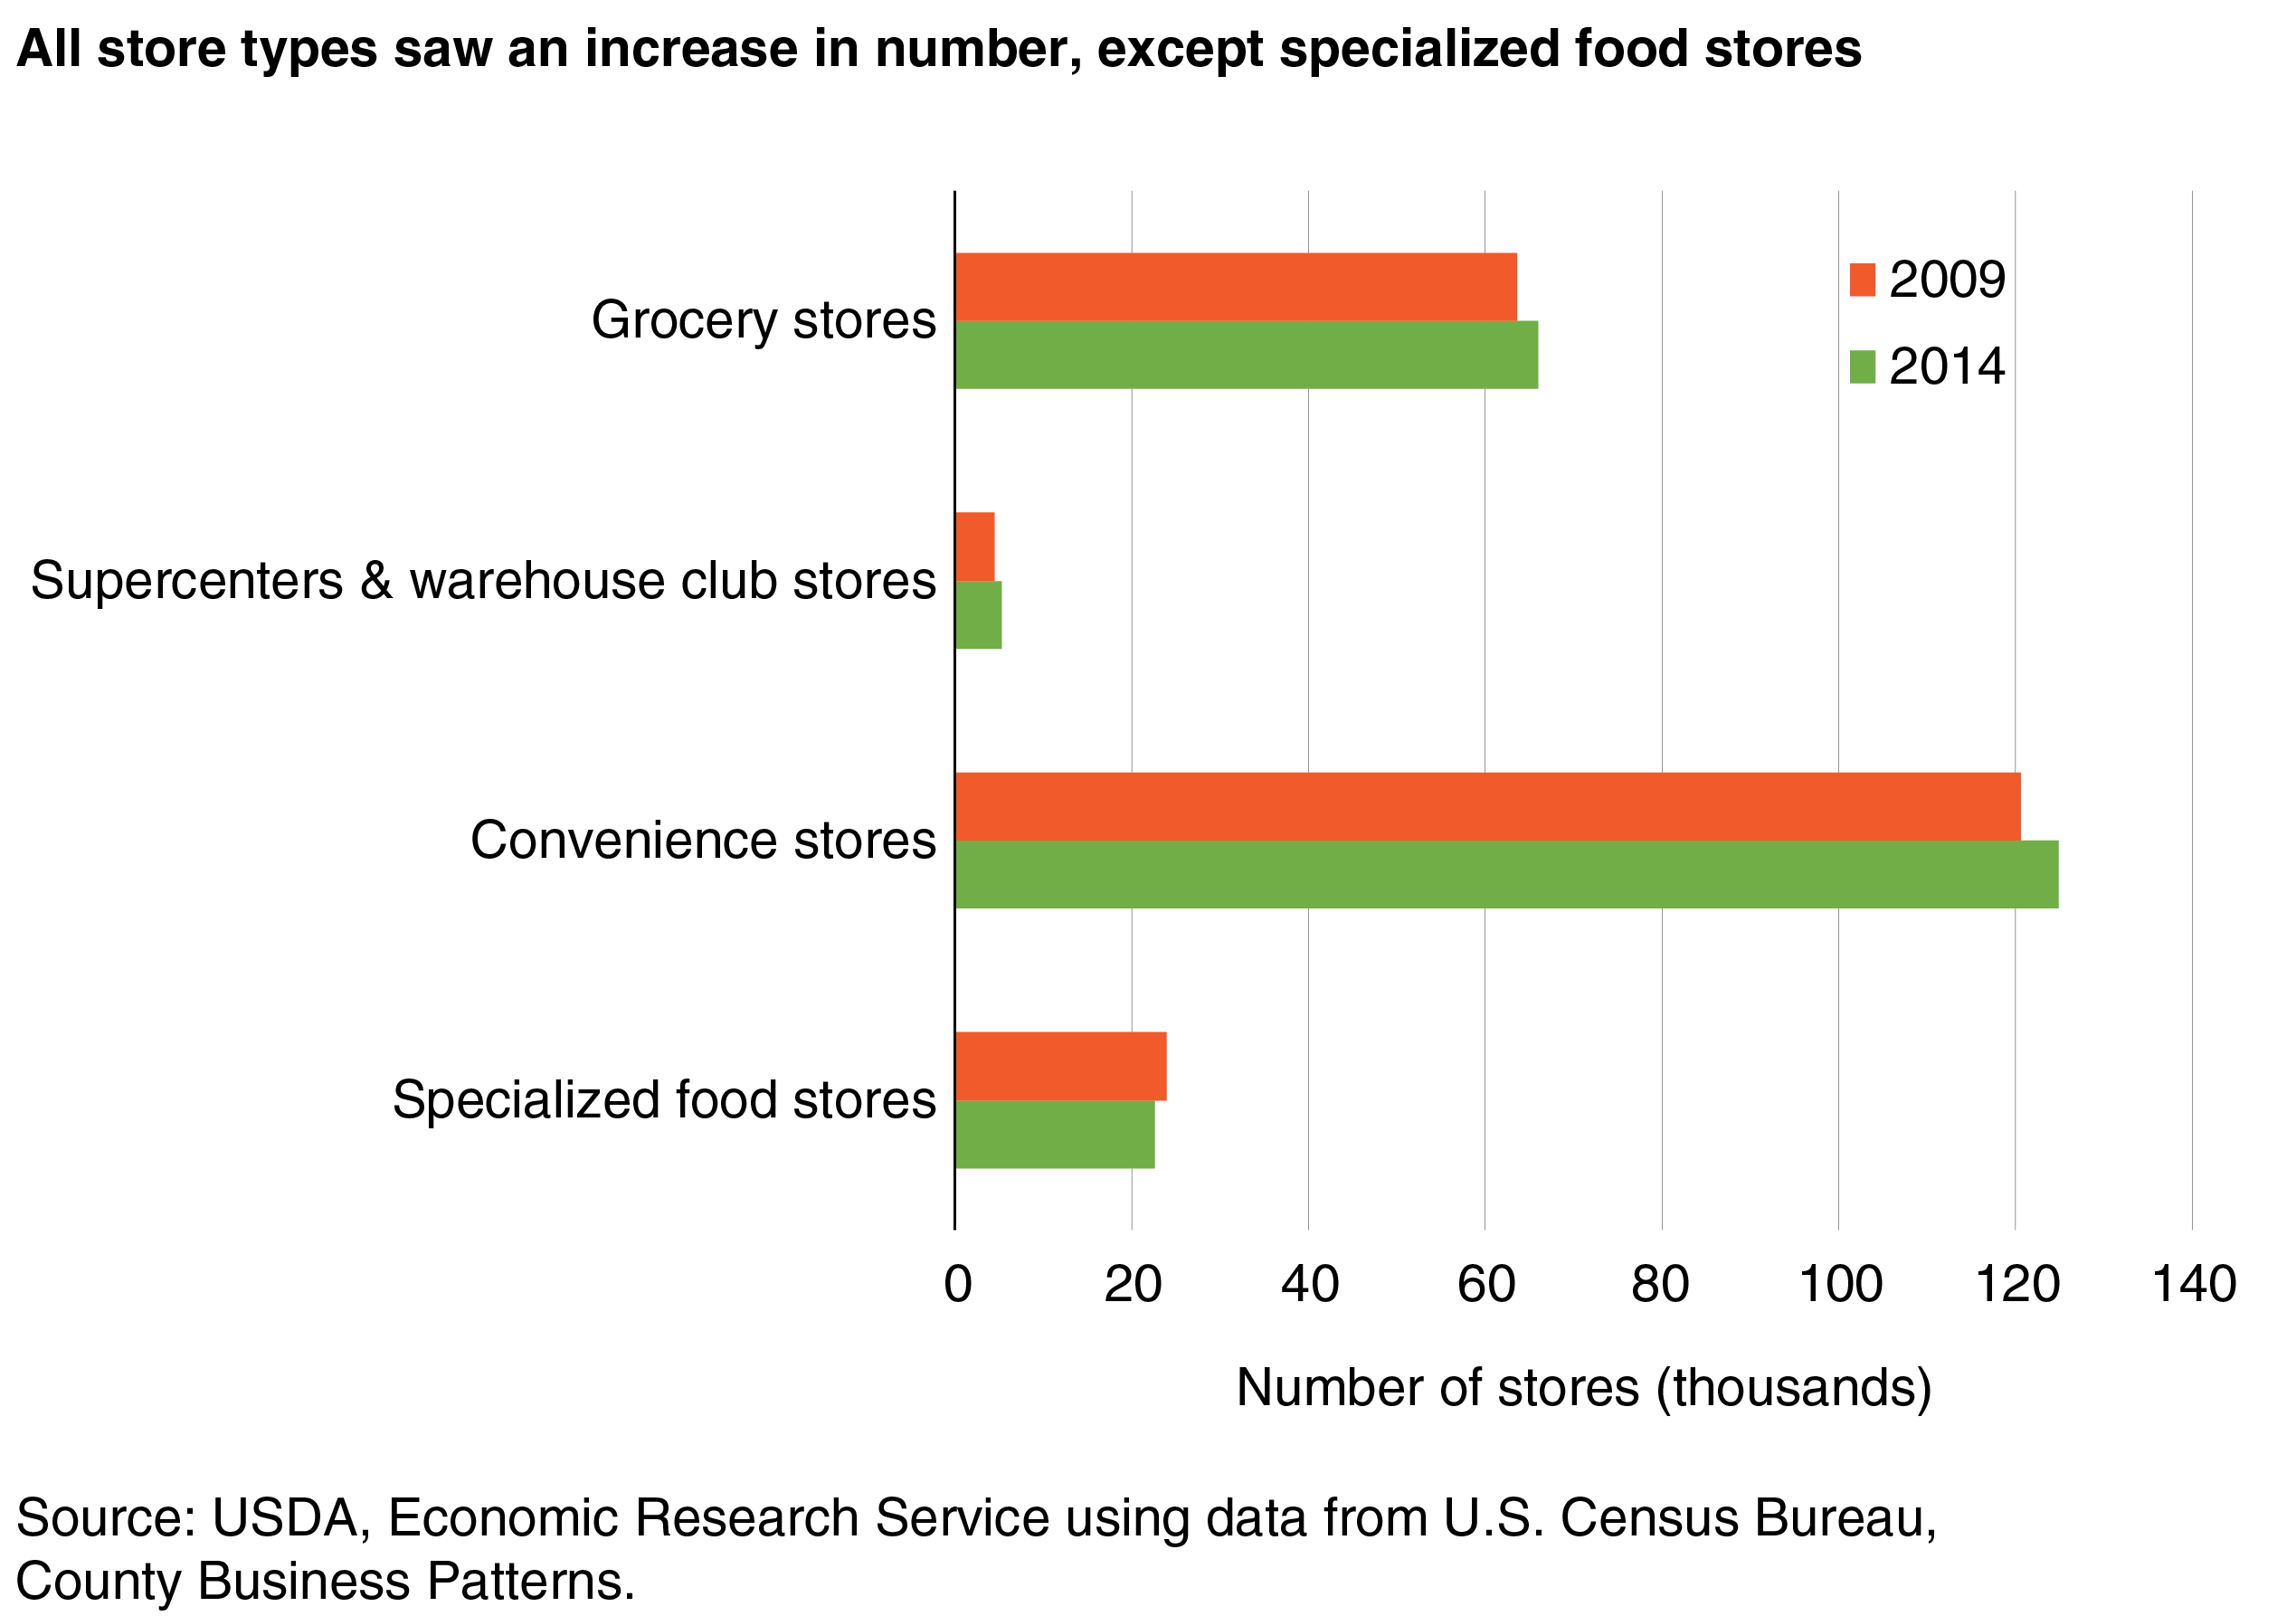
Between 2009 and 2014, the number of grocery stores in the United States grew from 63,619 to 65,975, an increase of 4 percent. The number of convenience stores grew by 4 percent as well, but their numbers rose from 120,581 to 124,879. The greatest percentage jump in the types of stores available to consumers was for supercenters and warehouse club stores. These stores saw an 18-percent increase in their numbers between 2009 and 2014 but still totaled only 5,307 stores in 2014. Specialized food stores saw a 6-percent decline in store numbers over this period. Preference for one-stop shopping by some consumers may be playing a role in the increase in supercenters and warehouse club stores and the decline in specialized food stores.
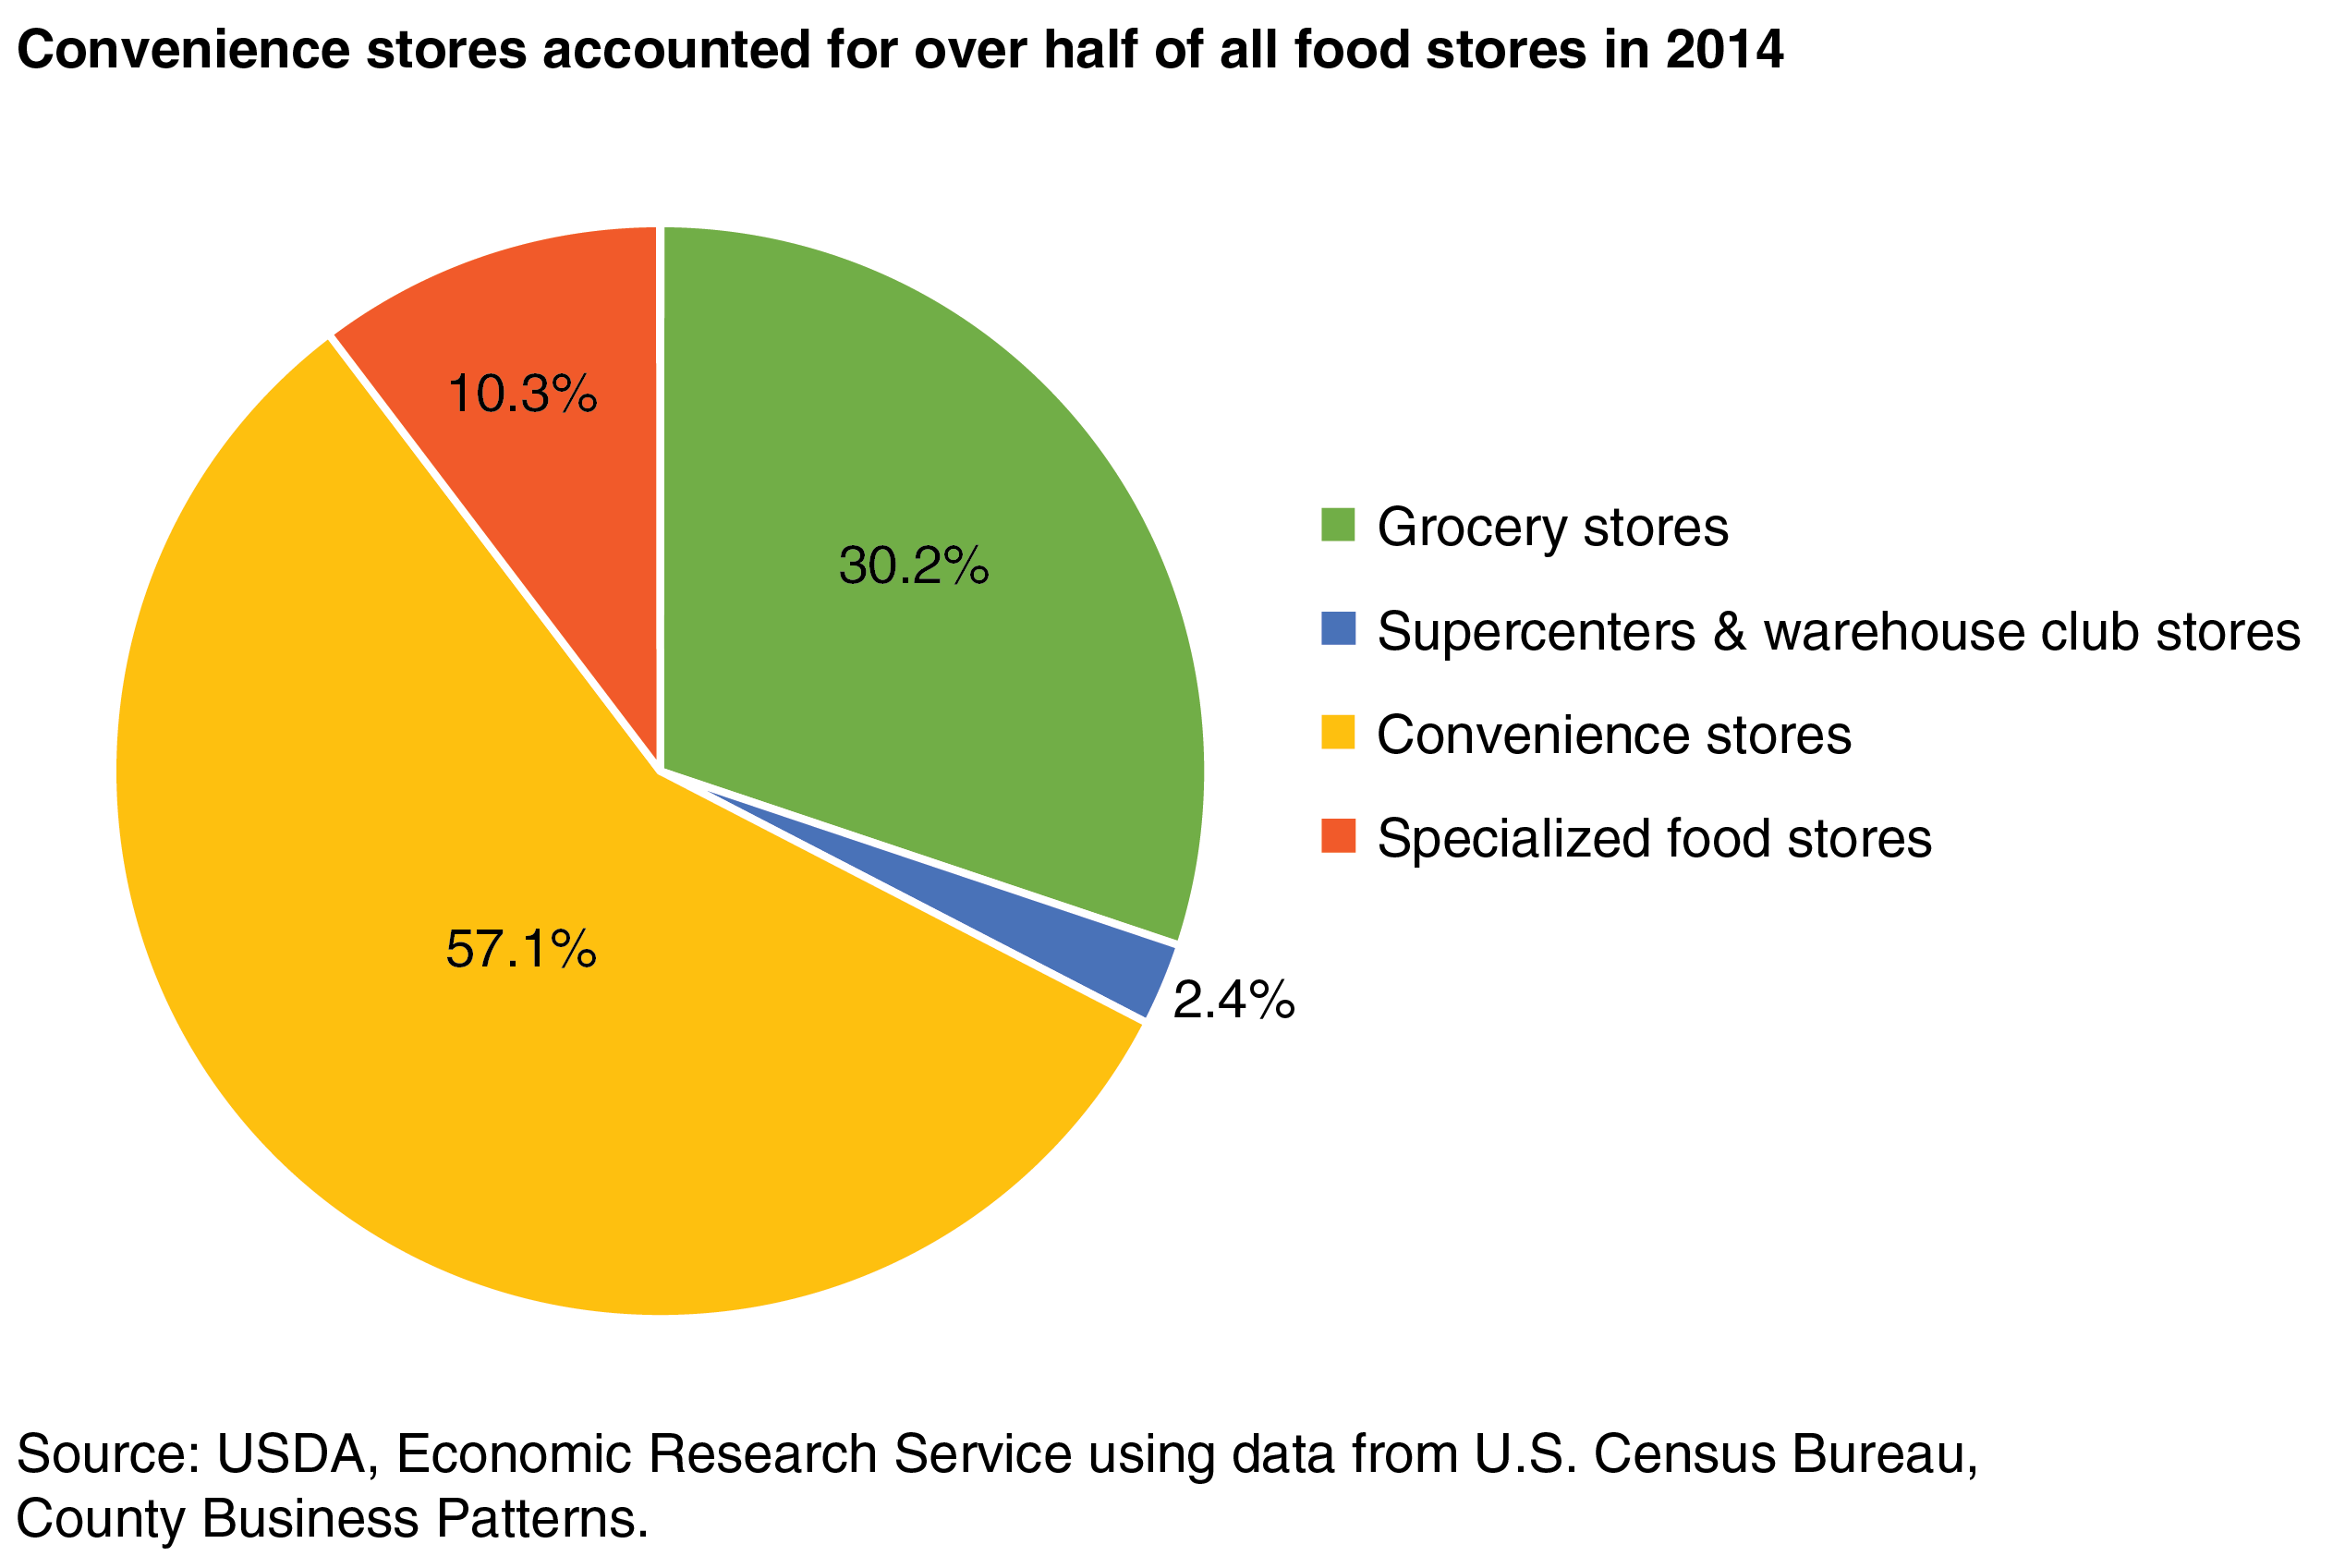
Nationally, the share of total food stores for each of the four store types did not change between 2009 and 2014. Supercenters and warehouse club stores accounted for just 2 percent of all food stores in both years and are concentrated in metropolitan counties. Specialized food stores accounted for 10 percent of food stores. Convenience stores accounted for the largest share of the four store types (57 percent), followed by grocery stores (30 percent). Both of these stores types are more evenly dispersed across metro and nonmetro counties than supercenters and warehouse club stores.
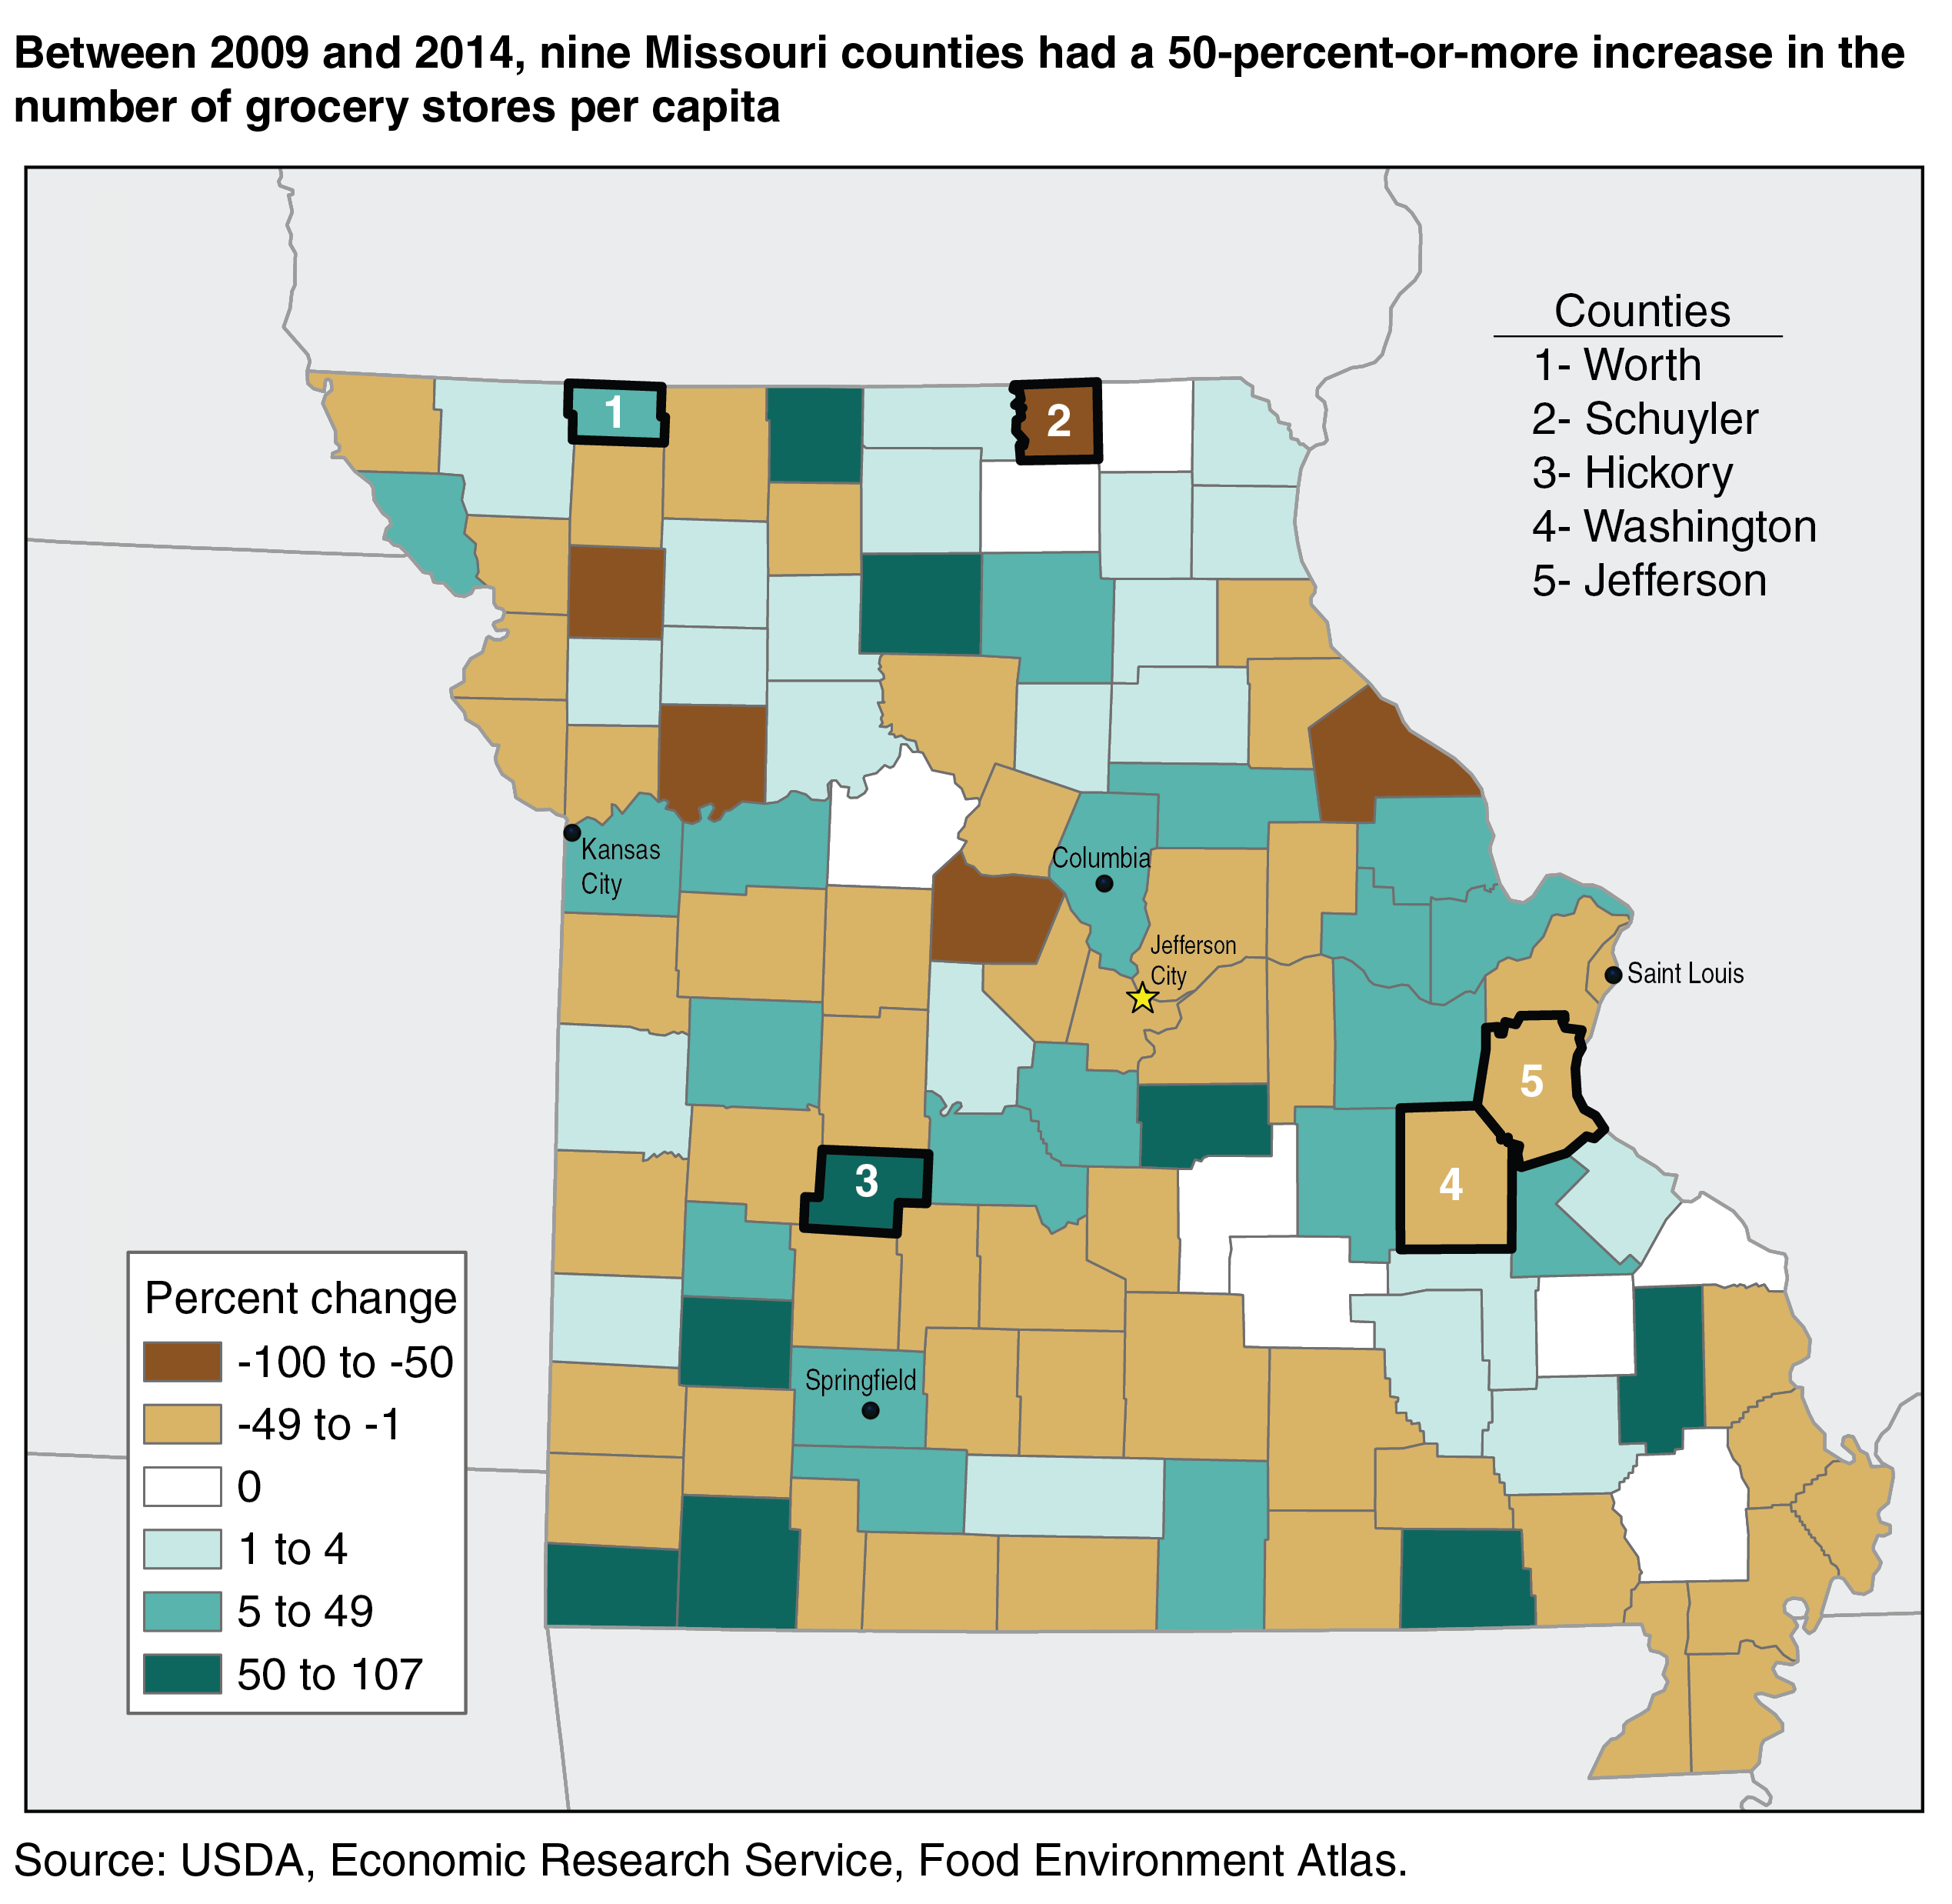
But at the State or county level, the story is often different. Some counties have seen the number of food stores in their jurisdiction fall over the 5-year period, while other counties have gained new food stores. Decisions on where to locate a store are generally based on expectations that the store will be profitable, which in turn rests on factors such as costs to build and operate the store, the shopping habits and incomes of potential customers, and competition from other stores. For these reasons, changes in the number of food stores per capita—a measure of store density—can vary significantly county by county, even within the same State. For example, nine counties in Missouri had a 50-percent or more increase in the number of grocery stores per capita from 2009 to 2014. The greatest percent increase (107 percent) in the State happened in nonmetro Hickory County, where the number of grocery stores per 1,000 residents grew from 0.10 in 2009 to 0.21 in 2014.
On the other end of the spectrum, Missouri had five counties that saw a decrease of more than 50 percent in the number of grocery stores per capita during that same period. One county saw a decrease of 100 percent. Nonmetro Schuyler County went from having four grocery stores in 2009 to zero stores in 2014. Schuyler County did not have a supercenter in 2014 and also lost a convenience store over the 5-year period, bringing the total number of convenience stores in the county to four.
In some instances, a Missouri county that lost grocery stores gained a supercenter or warehouse club store, like Jefferson County, where the number of grocery stores fell by six but the number of supercenters rose by two. In Washington County, residents lost one grocery store over the 2009-14 period and gained seven convenience stores.
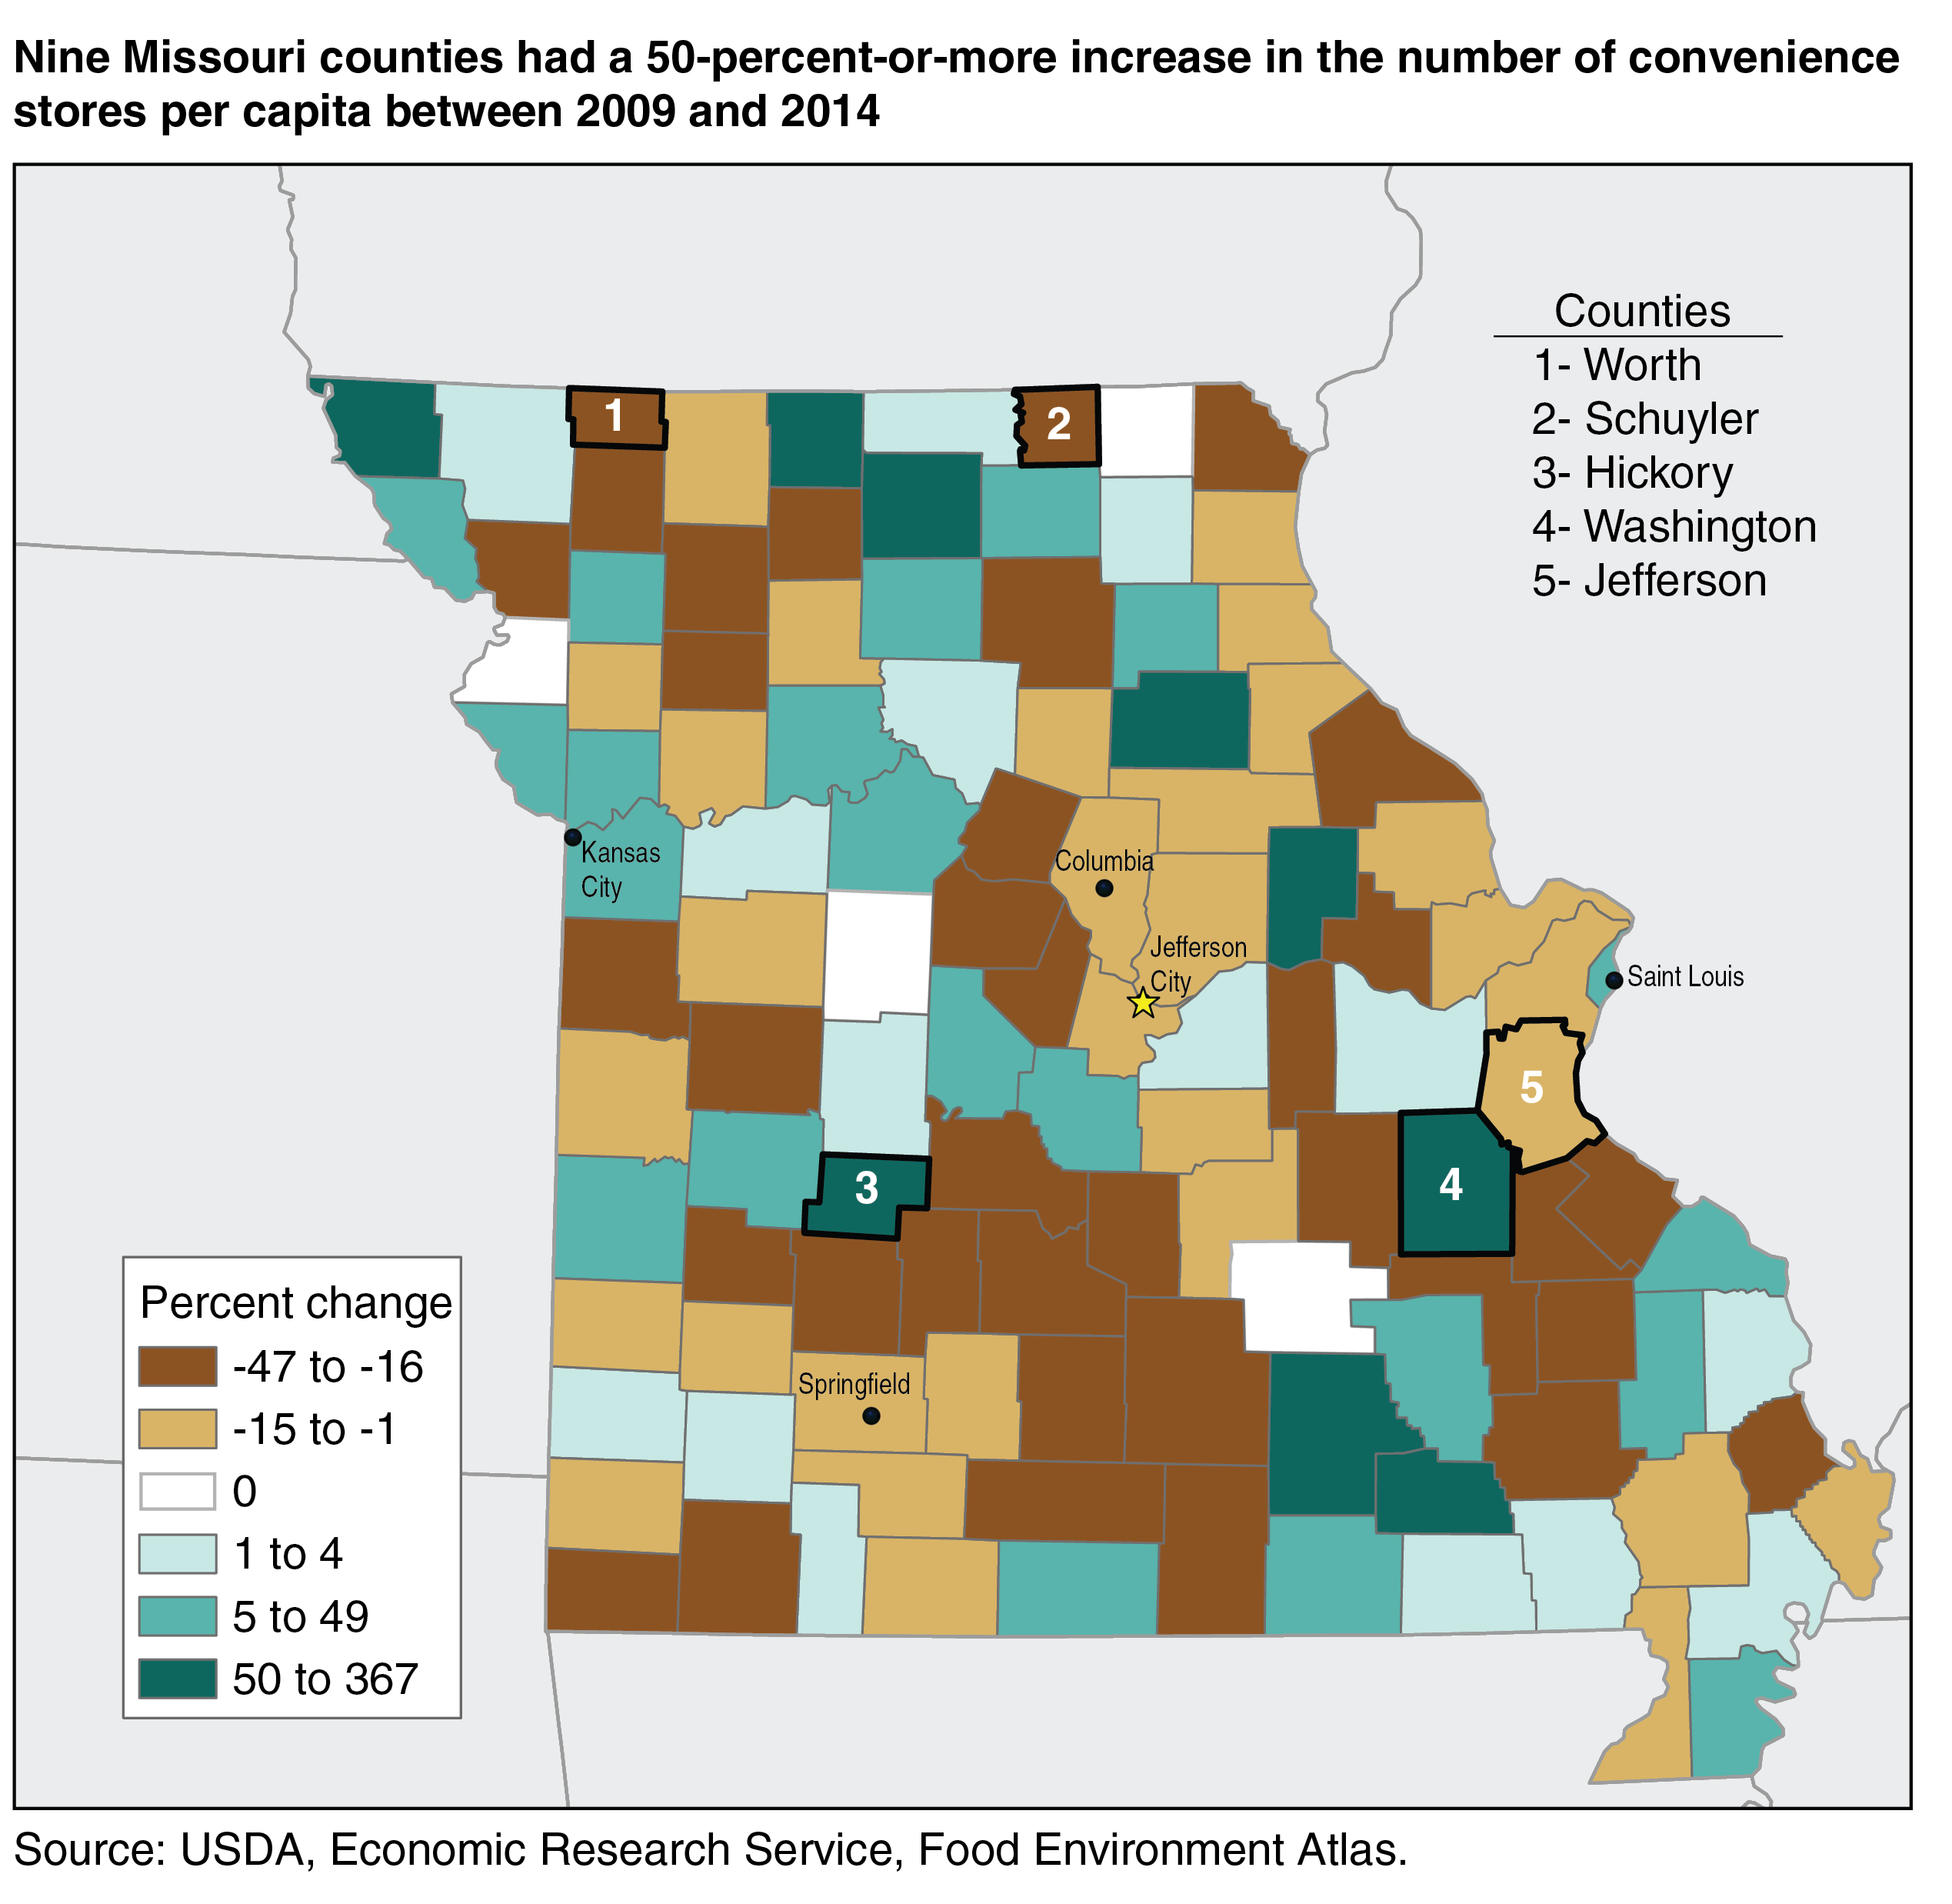
Missouri also had nine counties that had a 50-percent or more increase in the number of convenience stores per capita from 2009 to 2014. Hickory County saw an increase in both grocery stores and convenience stores. The number of convenience stores per 1,000 residents in Hickory County rose from 0.20 in 2009 to 0.98 in 2014. The biggest percent decrease in convenience stores per capita happened in nonmetro Worth County, with a drop of 47 percent.
This article is drawn from:
- Food Environment Atlas. (n.d.). U.S. Department of Agriculture, Economic Research Service.