

Five Decades of Price Swings for Food and Other Consumer Spending Categories
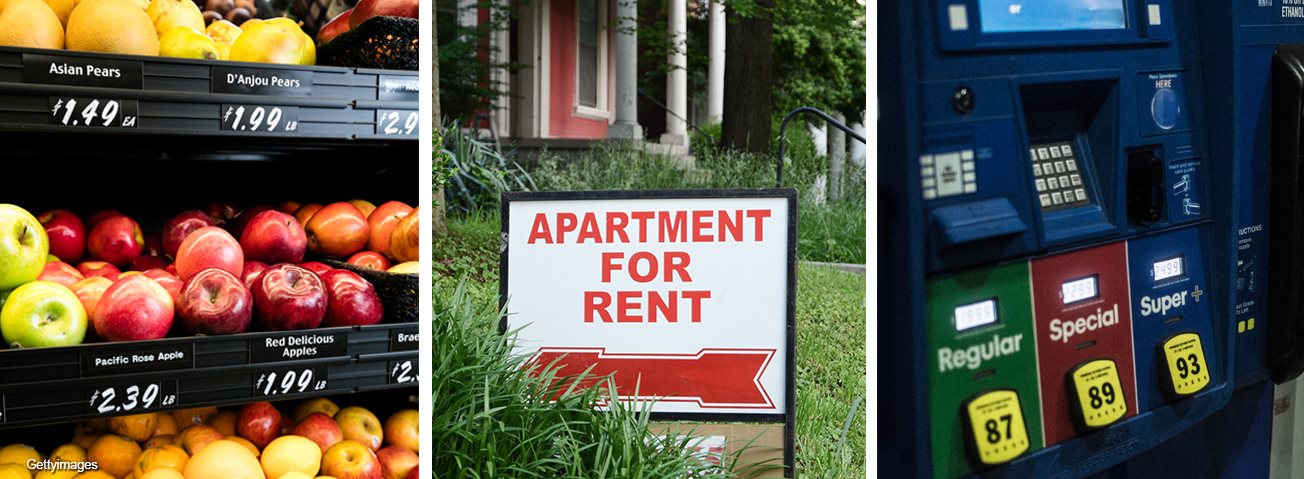
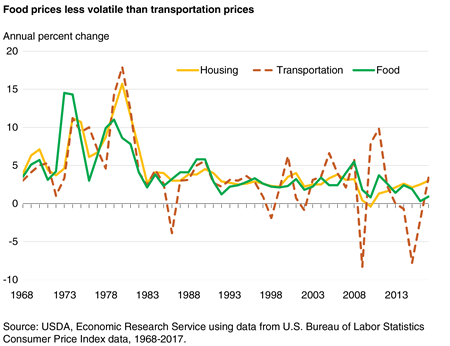
Examining annual price changes over the past 50 years for consumers’ top three spending categories—housing, transportation, and food—reveals that price inflation for food and housing has become comparatively more stable since the 1970s than transportation prices, which continue to be volatile from year to year. According to the Bureau of Labor Statistics’ 2016 Consumer Expenditure Survey, food—both purchases made at grocery stores and eating-out places—makes up 12.6 percent of the average American consumer’s annual spending. Housing is the largest spending category at 33 percent, followed by transportation at 15.8 percent.
The 1970s were a decade of price volatility for all three spending categories. Annual food price inflation during the 1970s averaged 8.1 percent, and food prices rose by 10 percent or more in 3 of the 10 years. Food price inflation peaked in 1973 at 14.5 percent. Price changes for housing costs, which include rents, utilities, and household furnishings, topped 10 percent in 1974, 1975, and 1979 and peaked at 15.7 percent in 1980. Since that time, prices for food and housing have enjoyed relative stability, increasing between 2 and 5 percent most years throughout the 1990s and 2000s.
Like food and housing, the price of transportation, which captures prices of vehicles, gasoline and diesel fuel, and public transportation, surged throughout the Organization of the Petroleum Exporting Countries (OPEC) oil crisis in the 1970s. However, transportation inflation has moderated since the second shock to gasoline prices in 1980, which lead to a 17.9-percent jump; prices have even deflated in some years. In 2009, transportation prices fell by 8.3 percent—corresponding with a 37.8-percent decrease in the price for crude oil that same year.
Just as transportation prices were impacted by the OPEC oil crisis, food prices are impacted by outside influences. Over the past decade, food prices rose as much as 5.5 percent in 2008 and as little as 0.3 percent in 2016. Due to rapid increases in farm-level rice, grain, and oilseed prices, costs for many consumer foods using these ingredients rose in 2007 and 2008. Food prices then rose at below-average rates of 1.8 and 0.8 percent in the post-Great Recession years. Lower-than-average increases for food prices in 2016 and 2017 were due to a combination of decreasing prices for food commodities and falling prices for the energy used to process and transport consumer foods. At the same time, a strong U.S. dollar lowered the cost of imported foods. While food prices may continue to rise at a lower-than-average rate, shocks to one or several food inputs could change the course of food price inflation.
Food Price Environment: Interactive Visualization, by Megan Sweitzer, USDA, Economic Research Service, February 2024