Understanding the Prevalence, Severity, and Distribution of Food Insecurity in the United States
- by Matthew P. Rabbitt, Alisha Coleman-Jensen and Christian A. Gregory
- 9/6/2017
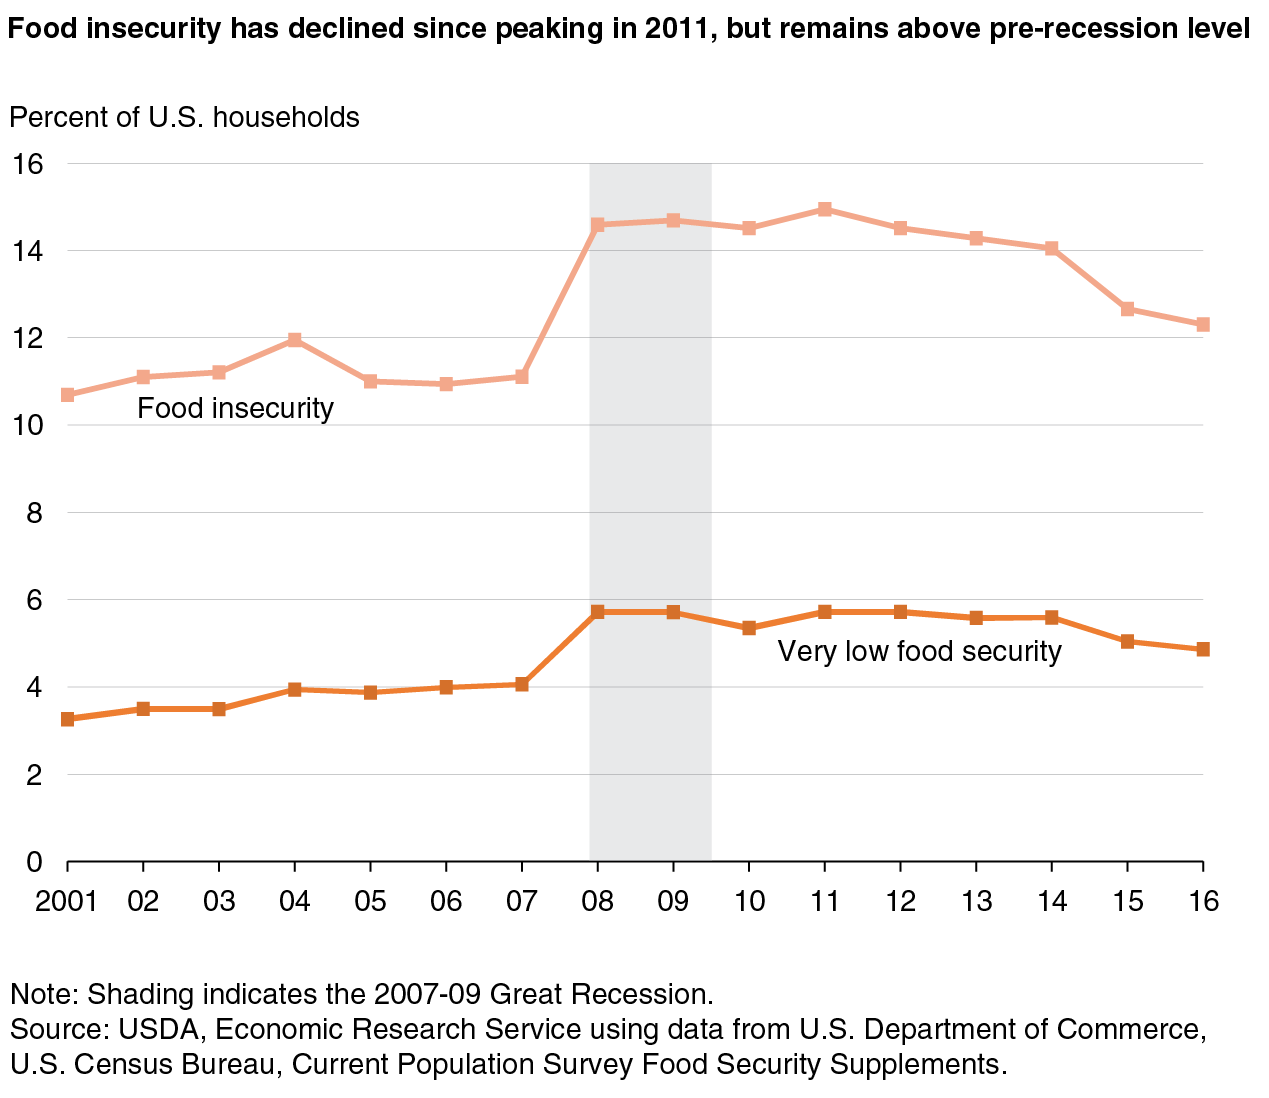
Each year, USDA's Economic Research Service through the U.S. Census Bureau conducts a survey to assess the extent that U.S. households struggle to put enough food on the table for all their members. In 2016, 12.3 percent of U.S. households were food insecure—meaning that they had difficulty at some time during the year providing enough food for all their members because of a lack of resources. That level is essentially unchanged from 2015, but down significantly from 14.0 percent in 2014. Lower food insecurity rates mirror trends in other economic indicators, including decreasing poverty rates and lower food prices, over this time period.
Food-insecure households can be separated into those with low or very low food security. In 2016, 4.9 percent of all U.S. households experienced very low food security, also unchanged from 2015. In this more severe range of food insecurity, the food intake of some household members was reduced, and normal eating patterns were disrupted at times during the year because of limited resources.
Food insecurity and very low food security rose markedly during the 2007-09 recession. In 2007, 11.1 percent of U.S. households were food insecure, and 4.1 percent experienced very low food security. Since peaking in 2011 at 14.9 percent, food insecurity has declined but remains higher than the pre-recession level. Similarly, very low food security rose to 5.7 percent in 2008 and 2009. In 2010, very low food security declined to 5.4 percent and was essentially unchanged from 2011 through 2014. Very low food security declined from 5.6 percent in 2014 to 5.0 percent in 2015.
Economic and Demographic Circumstances Largely Determine Food-Security Status
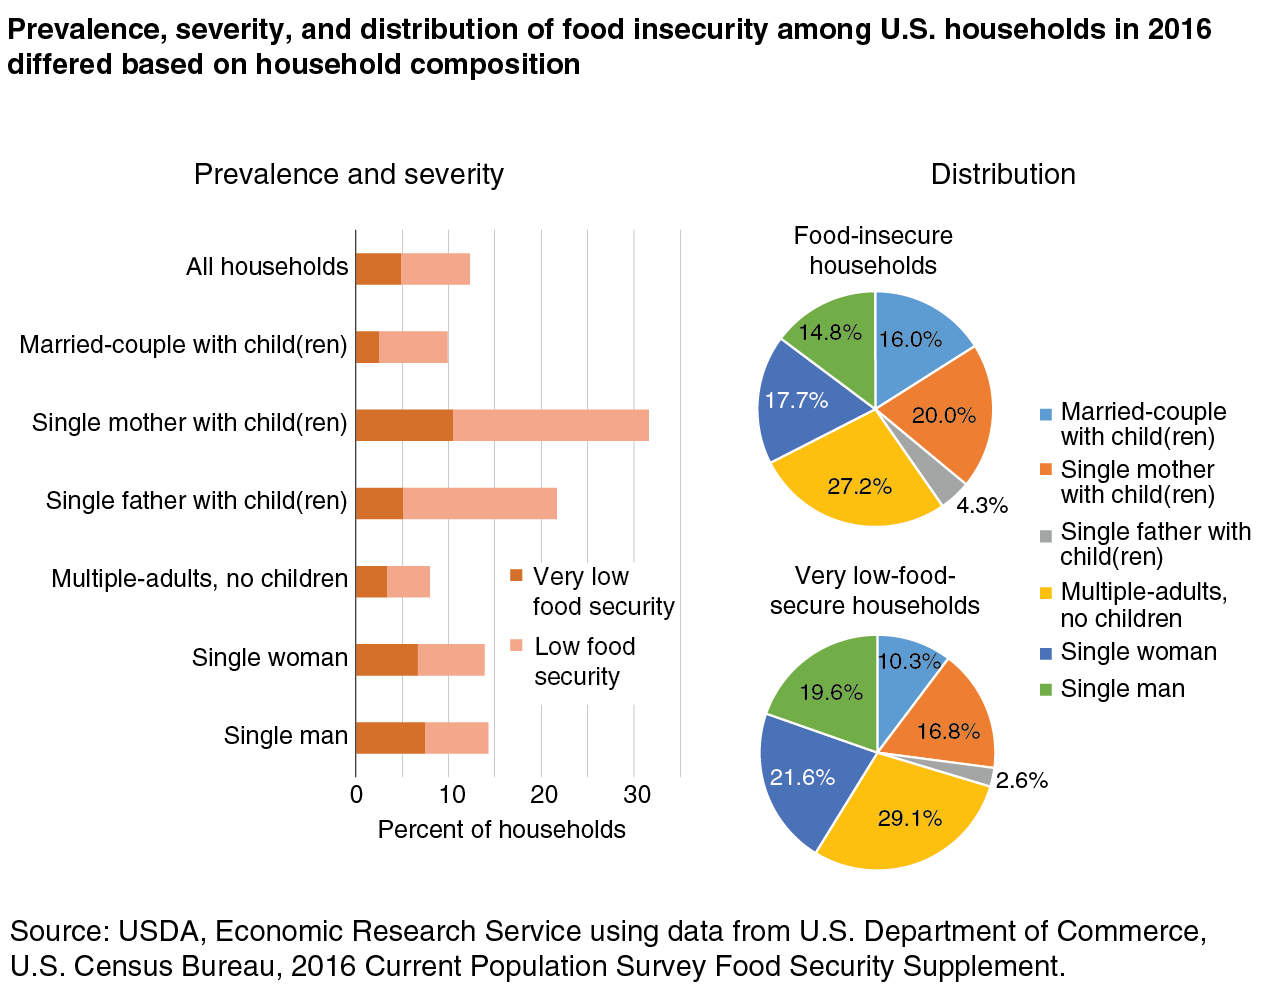
The prevalence of food insecurity varies widely across subgroups of the U.S. population. Some groups are more likely to be food insecure than others. Understanding which characteristics may be associated with an increased risk of food insecurity is helpful for targeting assistance to those most likely to be in need. For example, food insecurity tends to be more prevalent in households with children and in single-parent households, in particular. In 2016, 31.6 percent of single-mother households and 21.7 percent of single-father households were food insecure.
Understanding the distribution of food insecurity across population subgroups—the frequency of a subgroup’s occurrence in the food-insecure population—also is helpful for food and nutrition assistance targeting. While some household groups have a relatively lower risk of food insecurity, they are so large that the members of the group who are experiencing food insecurity make up a large proportion of all food-insecure households. For example, multiple-adult households without children have a lower food insecurity prevalence (8.0 percent) than single-mother households (31.6 percent) and single-father households (21.7 percent). However, in the Nation as a whole, multiple-adult households without children are more numerous than single-parent households, so these multiple-adult households make up a larger share of the distribution of all food-insecure households. Multiple-adult households without children account for 27 percent of all food-insecure households; single-mother households account for 20 percent and single-father households account for 4 percent.
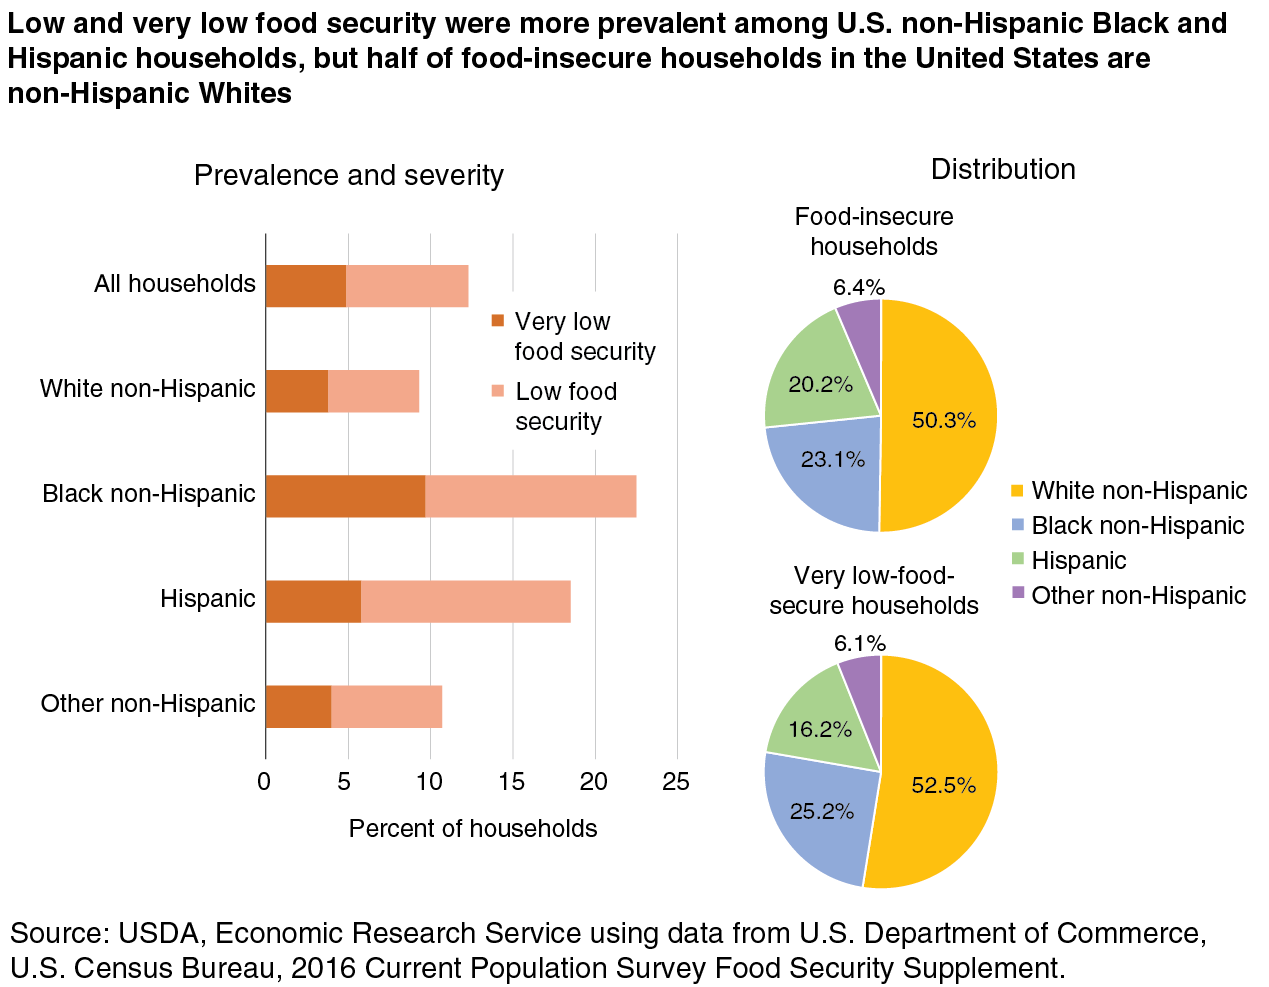
The prevalence of food insecurity is lower among households headed by White, non-Hispanics (9.3 percent) than households headed by Black, non-Hispanics (22.5 percent) or Hispanics (18.5 percent). Despite the lower prevalence of food insecurity among White, non-Hispanic-headed households, these households make up 50 percent of food-insecure households.
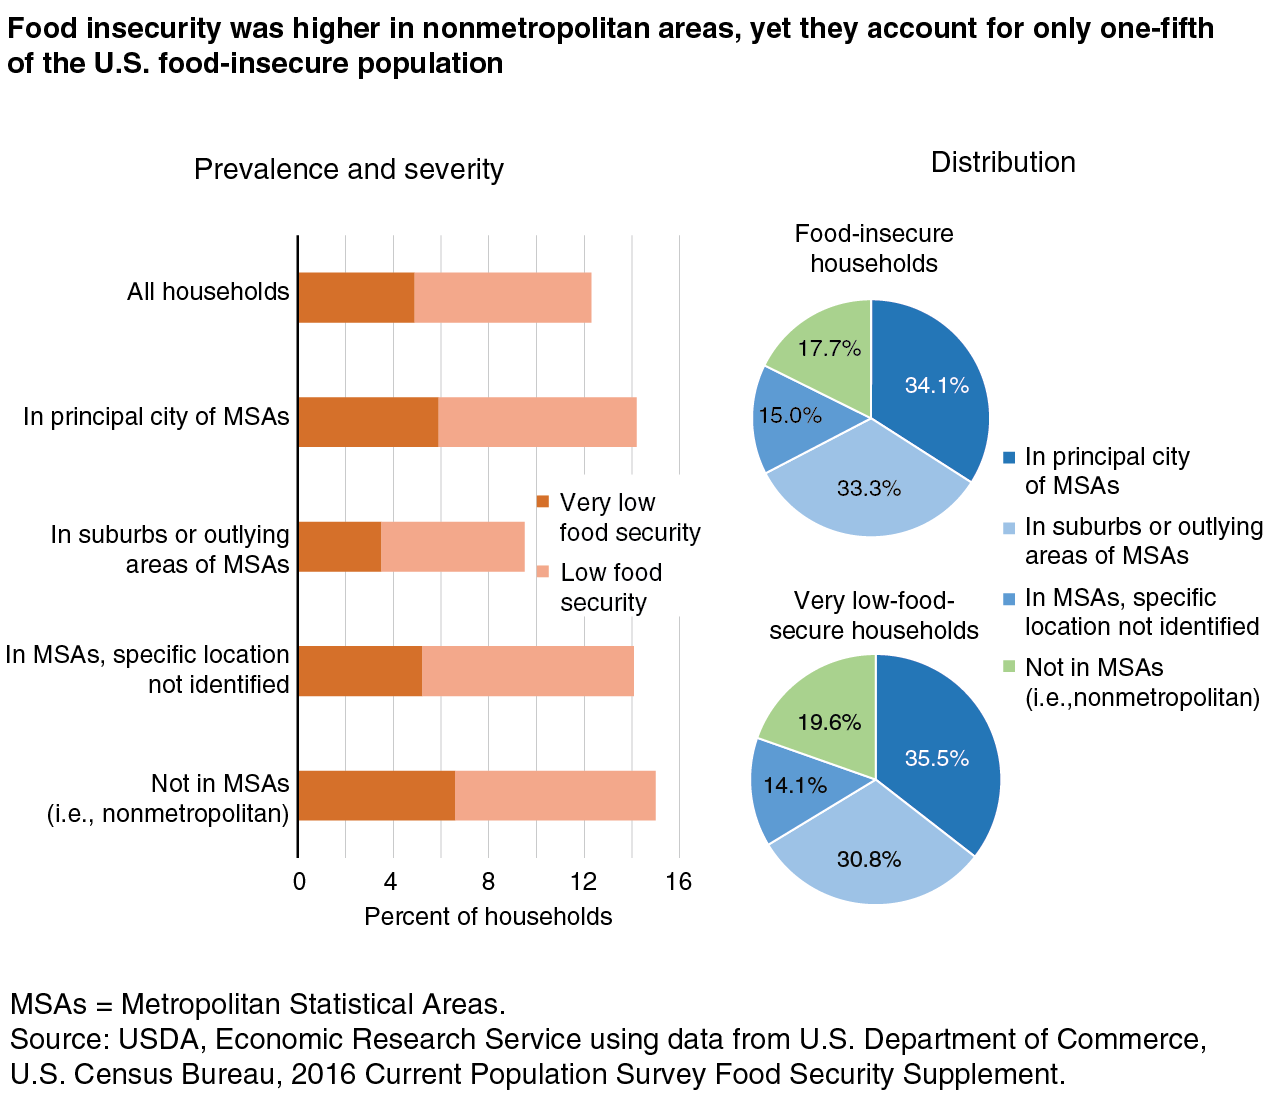
In 2016, the prevalence of food insecurity was higher in nonmetropolitan counties (15.0 percent) and principal cities (14.2 percent) than in suburbs (9.5 percent). The distribution of food insecurity across residence areas shows that the majority of food-insecure households are in metropolitan areas. About 18 percent of food-insecure households in 2016 lived in nonmetropolitan or rural counties.
Income is one of the primary characteristics associated with food insecurity. Low-income households have a much higher prevalence of food insecurity than their nonpoor counterparts. In 2016, 31.6 percent of households with incomes below 185 percent of the Federal poverty line were food insecure. The Federal poverty line for a family of four (two adults and two children) in 2016 was $24,339. These low-income households constituted the majority of food-insecure households, 58.9 percent.
This article is drawn from:
- Coleman-Jensen, A., Rabbitt, M.P., Gregory, C.A. & Singh, A. (2017). Household Food Security in the United States in 2016. U.S. Department of Agriculture, Economic Research Service. ERR-237.
You may also like:
- Food Security in the U.S. - Interactive Charts and Highlights. (n.d.). U.S. Department of Agriculture, Economic Research Service.
- Food Security in the U.S.. (n.d.). U.S. Department of Agriculture, Economic Research Service.
We’d welcome your feedback!
Would you be willing to answer a few quick questions about your experience?


