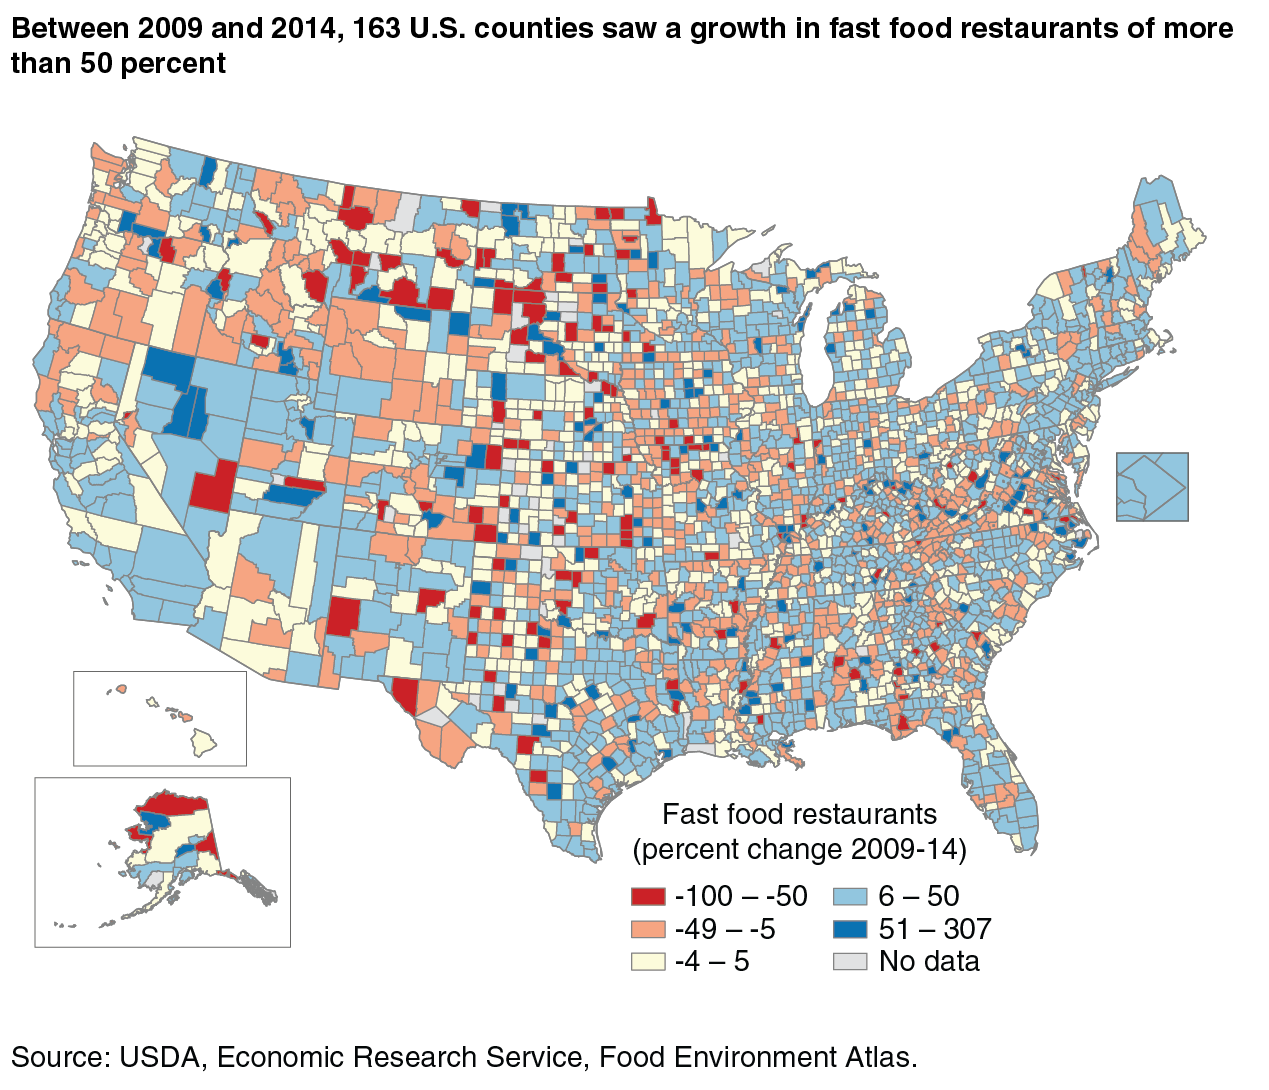
ERS’s Updated Food Environment Atlas Shows an Increase in Fast Food Restaurants Between 2009 and 2014
- by Alana Rhone
- 12/4/2017
ERS’s Food Environment Atlas assembles statistics on over 275 food environment indicators at the county or State level that can influence food choices and diet quality. One set of indicators focuses on store availability by providing a count of supermarkets, supercenters, grocery stores, and other stores that sell food—both in total and on a per capita basis—for each U.S. county. But Americans do not only purchase food from grocery stores and supercenters. Easy-to-access, cheap foods from fast food restaurants can compete with grocery store options.
In the Food Environment Atlas, a fast food restaurant is defined as an establishment that provides food service where patrons generally order or select items and pay before eating; some establishments may provide food service in combination with alcoholic beverage sales. Between 2009 and 2014, the number of fast food restaurants in the United States increased by 9 percent, from 210,692 restaurants in 2009 to 228,677 restaurants in 2014. Part of this growth reflects the growing popularity of fast food restaurant chains such as Chipotle Mexican Grill, Five Guys, and Panera Bread.
The States with the largest percent increase in fast food restaurants were Connecticut (20 percent), North Dakota (19 percent), New York (17 percent), and Texas (13 percent). In each of these States, the number of fast food restaurants grew at a faster rate than the population. As a result, the number of fast food restaurants per person in these States has risen. For example, in New Haven County, Connecticut, fast food restaurants per capita increased from 0.64 per 1,000 residents in 2009 to 0.76 in 2014.
The U.S. county with the highest increase in the number of new fast food restaurants was Los Angeles County, California. Los Angeles County added 680 new fast food restaurants (a 10-percent jump) from 2009 to 2014. During that same period, the county’s population rose by 3 percent. In 2014, there were 0.77 fast food restaurants per 1,000 residents in Los Angeles County compared with 0.73 in 2009.
This article is drawn from:
- Food Environment Atlas. (n.d.). U.S. Department of Agriculture, Economic Research Service.


