

Shares of Food Commodities Purchased Away From Home Vary by Commodity
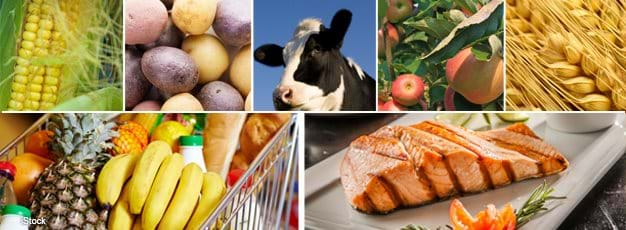
Food away from home—food prepared by restaurants with wait staff, fast food places, and other eating out places—is now a routine part of Americans’ diets; it accounted for 34 percent of total caloric intake in 2011-12. But what proportion of food commodities is purchased at grocery stores (food at home) versus away-from-home outlets, and have these proportions changed over time? Such information can help commodity producers and nutritionists target their marketing and educational efforts in the appropriate outlets.
ERS's Loss-Adjusted Food Availability (LAFA) data, as an approximation of food consumption, show year-to-year changes in food commodities available for consumption. ERS researchers used data from 4 national food-intake surveys conducted between 1994 and 2008 to disaggregate 63 LAFA commodities into 2 food sources—food at home and food away from home defined by where a food was acquired. Foods obtained at grocery stores, supercenters, and other food retailers were classified as food at home, and foods obtained from restaurants, fast food places, school cafeterias, and other away-from-home eating places were classified as food away from home.
On average between 1994 and 2008, over 80 percent of total fruit, dairy, and nuts were obtained from food-at-home sources, whereas 61 percent of all meats and fish were obtained from food-at-home sources. Over time, the at-home shares of some commodities (e.g., berries, fluid milk, caloric sweeteners, and nuts) rose, while others (e.g., chicken and wheat flour) declined.

At-home shares of fruit and vegetable were stable over time, higher for fruit than for vegetables
LAFA data indicate that fruit consumption was stable during 1994-2004 at 126 pounds per person, but declined to 119 pounds per person per year during 2007-08. Eighty-seven percent of fruit were obtained from at-home sources during 1994-2008, ranging from a high of 94 percent for bananas to a low of 75 percent for grapefruit, lemons, limes, and tangerines. Flavor, healthfulness, convenience, and year-round availability have contributed to increasing consumer demand for berries, with per capita availability growing from 4.5 pounds per year during 1994-98 to 6.6 pounds during 2007-08. The at-home share of berries rose from 83 percent during 1994-98 to 89-91 percent during 2003-08.
During 1994-2008, Americans consumed an average of 169 pounds per person per year of vegetables. Sixty-two percent of total vegetables were obtained from at-home sources over this period. Sweet corn and green peas had the highest at-home shares, both averaging 80 percent (5.8 and 1.4 pounds, respectively, at home) during 1994-2008. The at-home market for potatoes averaged 29.8 pounds and 53 percent of total consumption during 1994-2008. Potato consumption has been declining from 61 pounds per person each year in 1994-98 to 52 pounds in 2007-08. The same rate of decline occurred at home and away from home, resulting in stable at-home/away-from-home shares over time.

Over time, at-home share of fluid milk rose but fell for chicken
The at-home share for cheese (57 percent) was much smaller than for fluid milk (85 percent) and yogurt (91 percent) during 1994-2008. Americans’ cheese consumption grew from an average of 18 pounds per person in 1994-98 to 22 pounds per person in 2007-08. Increased consumption in both the at-home and away-from-home markets kept their shares fairly constant—57 percent from at-home sources and 43 percent obtained away from home.

Among all meats and fish, pork and turkey had the largest at-home shares (71 and 75 percent, respectively) and chicken had the smallest (53 percent) during 1994-2008. The away-from-home share of chicken consumption rose from 42 percent during 1994-98 to 46 percent during 2007-08, whereas the away-from-home share of seafood declined from 43 percent to 37 percent during the same period. Loss-adjusted chicken availability per person in the away-from-home market was 16.8 pounds in 1994-98 and rose to the range of 22.5 to 24.8 pounds during 2005-08. In contrast, chicken obtained at grocery stores grew by just 2.6 pounds per person from 23.3 to 25.9 pounds. The greater growth of chicken consumption away from home is consistent with the rising popularity of chicken nuggets, chicken strips, and grilled chicken sandwiches in fast food and other eating out places.

U.S. Food Commodity Availability by Food Source, 1994-2008, by Biing-Hwan Lin, Tobenna D. Anekwe, Jean C. Buzby, and Jeanine Bentley, ERS, December 2016