
Low-Income Areas With Low Supermarket Access Increased in Urban Areas, But Not in Rural Areas, Between 2010 and 2015
- by Alana Rhone
- 4/3/2017
Efforts to encourage Americans to improve their diets presume that a wide variety of healthful foods are available to everyone. But for some areas and people, access to healthy food may be limited due to the lack of stores offering an assortment of healthy foods and financial resources. ERS’s Food Access Research Atlas (FARA) provides a measure of neighborhood access to healthy, affordable food for the entire Nation and allows users to map low-income and low-supermarket-access census tracts in 2010 and 2015. A census tract is a small statistical subdivision of a county that usually contains between 1,200 and 8,000 people.
A census tract’s income status is based on poverty rate or median family income, using data from the U.S. Census Bureau’s 2010-2014 American Community Survey. A low-income (LI) census tract has a poverty rate of 20 percent or higher, or median family income that is at or below 80 percent of the State’s or metropolitan area’s median income. In one measure of supermarket access, a census tract is considered low access (LA) if at least 500 people or at least 33 percent of the population live more than 1 mile from the nearest supermarket, supercenter, or large grocery store in urban tracts or more than 10 miles in rural tracts. In 2015, there were 34.7 million people living in urban low-income and low-access (known as LILA) tracts and 4.6 million people living in rural LILA tracts.
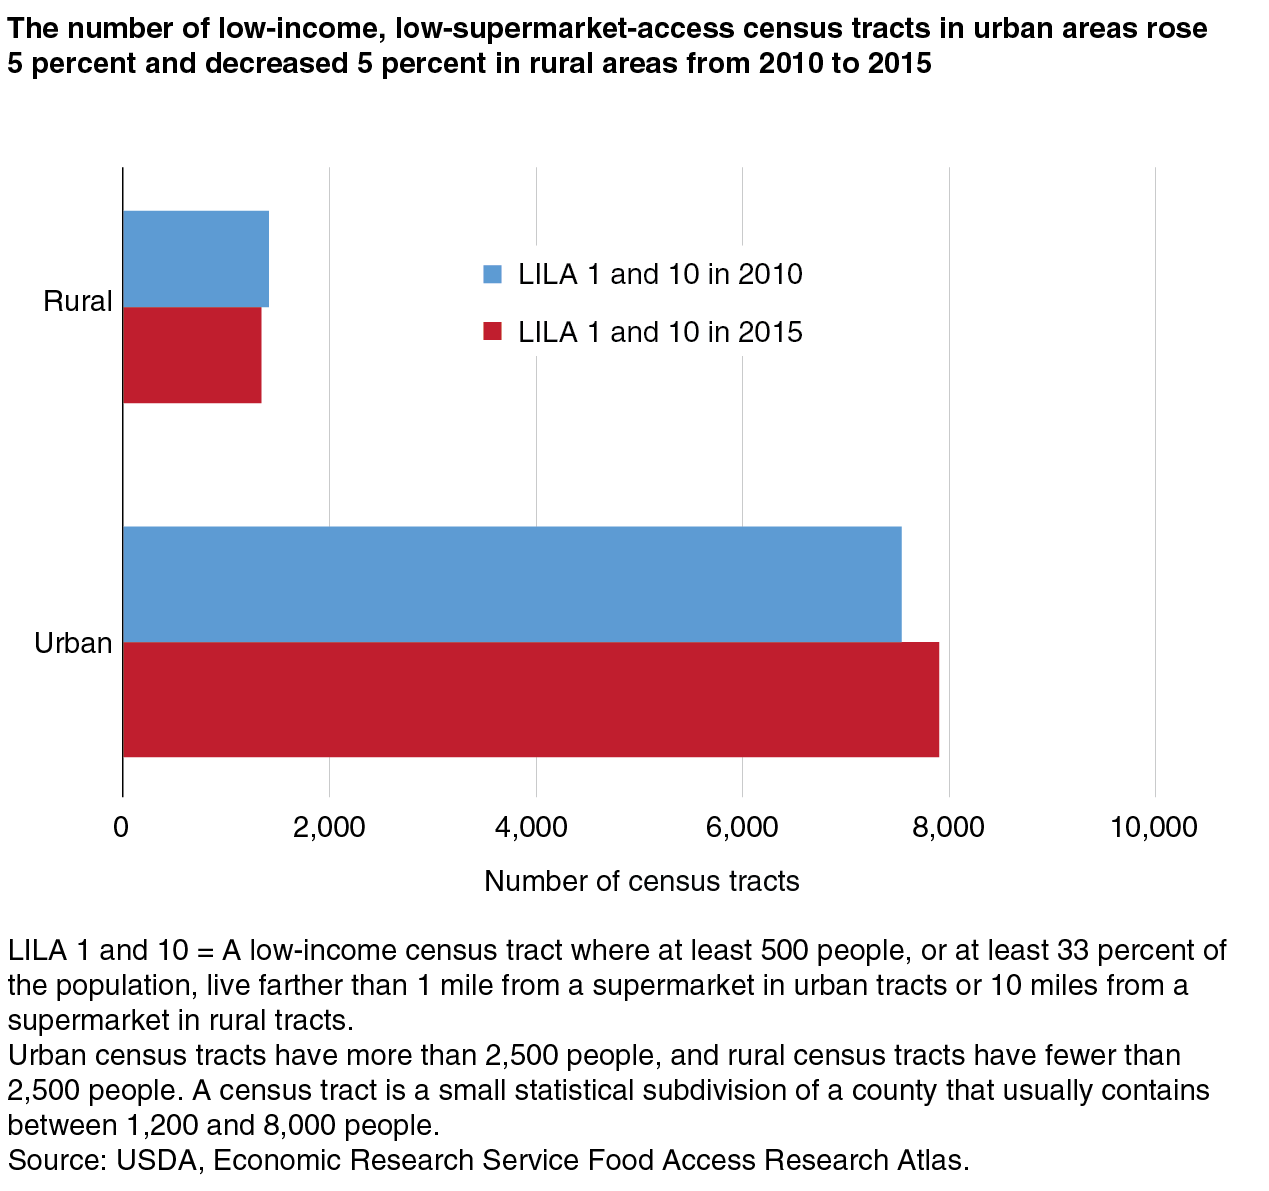
Between 2010 and 2015, the number of urban LILA tracts increased by 5 percent, while the number of rural LILA tracts decreased by 5 percent. By 2015 in urban areas, there was a net increase of 361 LILA tracts for a total of 7,905 LILA tracts. Much of the increase in urban LILA tracts is attributed to a rise in the number of low-income areas—perhaps a casualty of the 2007-09 recession—rather than low access. Of those tracts that became LILA in 2015, 1,455 were already low access in 2010, but then also became low income by 2015. Far fewer tracts—838—were low-income tracts that became low access by 2015.
In rural areas, there was a net decrease in LILA census tracts. The number of rural LILA tracts fell from 1,415 in 2010 to 1,340 in 2015. Of those that became LILA tracts, 278 were already low access in 2010, but then also became low income by 2015. Less than half as many—115—were low-income tracts that became low access by 2015.
This article is drawn from:
- Food Access Research Atlas. (n.d.). U.S. Department of Agriculture, Economic Research Service.
- Rhone, A., Ver Ploeg, M., Dicken, C., Williams, R. & Breneman, V. (2017). Low-Income and Low-Supermarket-Access Census Tracts, 2010-2015. U.S. Department of Agriculture, Economic Research Service. EIB-165.