

USDA’s Food Assistance Programs: Legacies of the War on Poverty
Highlights:
-
The War on Poverty fostered many of USDA’s food assistance programs that target poor families and vulnerable individuals.
-
USDA food assistance programs reduce food insecurity and are responsive to changing economic conditions.
-
USDA’s Supplemental Nutrition Assistance Program (SNAP) has antipoverty effects that are not reflected in official poverty statistics.
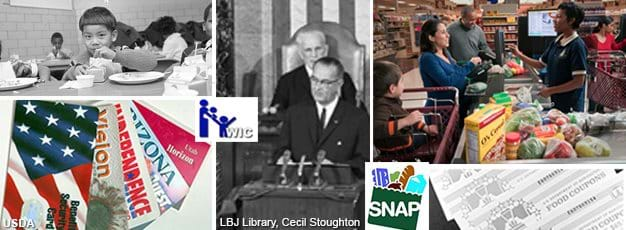
The year 2014 marks the 50th anniversary of the “War on Poverty,” formally launched by President Lyndon B. Johnson in his State of the Union address in January 1964. In his address, President Johnson declared “unconditional war on poverty in America” in response to large numbers of Americans “with incomes too small to even meet their basic needs.” One of those basic needs—food—was soon to be a major component of how poverty was measured. Many of USDA’s food and nutrition assistance programs were designed to address this basic need and are legacies of the War on Poverty. Today, these programs remain on the front line of America’s antipoverty efforts.
Food Spending Played Leading Role in Developing Poverty Measures
Each year, the U.S. Government estimates both the number and percentage of people in the United States who are poor—two key economic indicators. People are considered “poor” or “in poverty” if their family’s income falls below a threshold level deemed adequate to cover basic living expenses. The development of the official poverty thresholds in the 1960s was based on USDA estimates of the minimum cost of the food that families of different sizes and compositions would need to meet recommended nutritional guidelines. There were no estimates of minimum costs for other necessities, such as shelter and clothing. Instead, to account for such items, the minimum cost of food was multiplied by three; previous research based on 1955 USDA data had shown that food expenditures accounted for one-third of an average American family's budget. The poverty thresholds became official in 1969 when the Office of Management and Budget directed the Census Bureau to use the new thresholds to determine who is in poverty.
Many Food Assistance Programs Rooted in the War on Poverty
Prior to the 1960s, there were few federally run programs providing food to individuals. The earliest was the Food Distribution Program that was established in 1936 to distribute commodities, primarily those acquired by the Government to support farm prices, to low-income families. This was followed in 1946 by the National School Lunch Program, which provided subsidized lunch to schoolchildren, and by the Special Milk Program, established in 1955 to support milk prices while encouraging children to drink more milk.
Following President Johnson’s declaration of war on poverty, a number of food assistance programs specifically targeting low-income families were established. In his State of the Union address, President Johnson cited the need to provide more food to the needy by expanding the Food Stamp Program. At that time, the Food Stamp Program, which began as a pilot program in 1961, was operating in a limited number of counties. The Food Stamp Act of 1964 made the program permanent and it rapidly began to expand nationwide.
Other programs varying by size, eligibility criteria, and form of benefits soon followed. Unlike the Food Stamp Program—now called the Supplemental Nutrition Assistance Program (SNAP)—which is available to most needy families with limited income and assets, these programs were targeted toward specific segments of the low-income population. The first was the School Breakfast Program established in 1966 to provide breakfasts to children. In selecting schools to take part in the program, first consideration was given to schools in poor areas or in areas where students had to travel long distances. The Child and Adult Care Food Program and Summer Food Program grew out of the same 1968 legislation and were established to ensure that children receive nutritious meals while in child care and during the summer when schools are closed. Initially, the program targeted poor areas and areas with large numbers of working women. Soon after, the Commodity Supplemental Food Program (1969) and the Special Supplemental Nutrition Program for Women, Infants, and Children—or WIC—(1972) were established to address malnutrition among low-income mothers and children.
| Program | Year initiated | Year permanently authorized | Target population | Income eligibility limit | Form of benefit provided | Average participation in FY 2013 | Total USDA expenditures in FY 2013 |
|---|---|---|---|---|---|---|---|
| SNAP | 1961 | 1964 | Households | 130 percent of poverty | Electronic benefits to purchase food | 47.6 million participants per month | $79.8 billion |
| School Breakfast Program | 1966 | 1975 | Primary and secondary students | 130 percent of poverty for free meals and 185 percent of poverty for reduced-price meals | Breakfasts | 13.1 million children per school day | $3.5 billion |
| Child and Adult Care Food Program | 1968 | 1978 | Children and adults in day care | No limit | Breakfast, lunch, dinner, and snacks | 3.5 million persons per day | $3.0 billion |
| Summer Food Program | 1968 | 1975 | Children in low-income areas when school is out | No limit | Meals and snacks | 2.4 million per day in July (peak month) | $423.7 million |
| Commodity Supplemental Food Program | 1969 | 1973 | Women, infants, children, and the elderly | 185 percent of poverty (Elderly--130 percent of poverty) | Food packages | 579.8 thousand persons per month | $203.8 million |
| WIC | 1972 | 1974 | Women, infants, and children | 185 percent of poverty | Supplemental foods, nutrition education, and health care referrals | 8.7 million participants per month | $6.4 billion |
| SNAP = Supplemental Nutrition Assistance Program. WIC = Special Supplemental Nutrition Program for Women, Infants, and Children. Source: USDA, Food and Nutrition Service. |
|||||||
Although total food and nutrition assistance expenditures fluctuate with changing economic conditions that affect the number of eligible people, their rate of participation, and benefit levels, the programs have generally expanded as the U.S. population has grown and coverage of the target population has increased in the decades following President Johnson’s declaration. Today, USDA administers 15 separate domestic food and nutrition assistance programs. These programs serve one in four Americans at some point during the year and account for over 70 percent of USDA’s budget. The six programs that originated in the era of the War on Poverty accounted for 86 percent of the $109 billion in USDA expenditures for food and nutrition assistance in fiscal year (FY) 2013. SNAP served 47.6 million people per month and accounted for 73 percent of all Federal food and nutrition assistance spending that year and is now the second largest of all the Federal Government’s means-tested programs that provide assistance to the low-income, trailing only Medicaid.

Food Assistance Programs Target Those in Poverty and Other Low-Income People…
Eligibility for USDA’s food assistance programs is based on income relative to a specified percentage of the poverty guidelines (a simplified version of the poverty thresholds). For example:
- To be eligible for SNAP, Federal guidelines require that monthly gross income (i.e., a household’s total income before deductions) must be at or below 130 percent of the poverty guidelines for households without elderly or disabled members (households with these members do not face a gross income requirement), and monthly net income (after allowable deductions) must be at or below 100 percent of the poverty guidelines for all households. SNAP benefits are structured so that a participant’s benefits increase as income decreases.
- To participate in WIC, family income generally must not be more than 185 percent of the poverty guidelines.
- The National School Lunch Program and the School Breakfast Program provide free meals to children from families with incomes at or below 130 percent of poverty, and reduced-price meals to those with family incomes at or below 185 percent of poverty. (Children from families with incomes over 185 percent of poverty pay full price, although their meals are still subsidized to a small extent.)
Given that eligibility is targeted to the low-income, it is not surprising that most program participants live in poverty. Data from USDA’s Food and Nutrition Service (FNS)—the agency that administers the food assistance programs—indicate that:
- Free meals accounted for 62 percent of all lunches served in the National School Lunch Program and 77 percent of all breakfasts served in the School Breakfast Program in FY 2013.
- 83 percent of all SNAP households had incomes below the poverty guidelines in FY 2011. These households received 91 percent of all SNAP benefits.
- 67 percent of all WIC participants lived in poverty in 2012.
…Reduce Poverty and Food Insecurity…
The primary objectives of the food and nutrition assistance programs are to improve access to nutritious foods and reduce food insecurity. However, the programs serve another important purpose—they reduce some of the hardship of poverty. By providing food to needy families, money that would have otherwise been spent on food is freed up to be spent on other things, including housing, clothing, and transportation.
The official poverty estimates are based on money income before taxes and do not include in-kind (or noncash) assistance such as subsidized rents, assistance with home energy bills, or USDA’s in-kind assistance—SNAP benefits for the purchase of groceries, WIC vouchers for specific foods, or free meals through the National School Lunch and School Breakfast Programs. Since the development of the official poverty measure, in-kind benefits like SNAP have become an increasingly important component of assistance to the poor. A 2012 ERS study found that adding the value of SNAP benefits to family income raises some families out of poverty and, to a greater extent, reduces the depth and severity of poverty.
Depth of poverty was measured by the “poverty gap,” an index reflecting the average distance of poor households’ incomes below the poverty threshold. Severity of poverty was measured by an index that equaled the square of the poverty gap, which places more weight on families whose incomes are far below the poverty line and gives a picture of how the poorest of the poor are faring. Declines in the depth and severity of poverty capture increases in well-being generated by public assistance, even if the assistance is not large enough to move a poor family above the poverty threshold.
Over the 2000 to 2009 study period, including SNAP benefits in family income reduced the estimated number of people living in poverty by 4.4 percent per year on average. SNAP benefits were found to have a relatively stronger effect on the depth and severity of poverty than on the prevalence of poverty. Including SNAP benefits in family income led to an average annual decline in the depth and severity of poverty of 10.3 percent and 13.2 percent, respectively.
The study went on to find that adding SNAP benefits to family income has a particularly strong alleviative effect on poverty among children—a group that experiences significantly higher rates of poverty than the overall population. On average, from 2000 to 2009, including the value of SNAP benefits in family income reduced the number of children in poverty by 5.6 percent per year, the depth of child poverty by 15.5 percent, and the severity of child poverty by 21.3 percent.

These study results demonstrate that the official poverty rate does not capture the antipoverty effects of SNAP, and that a simple poverty rate does not account for reductions in poverty depth and severity. In November 2011, the U.S. Census Bureau began releasing yearly estimates of poverty based on a new Supplemental Poverty Measure to augment official poverty estimates. This new measure includes the value of SNAP benefits as income. However, a simple poverty rate calculated from the new measure still understates improvements in well-being from the program.
Measures of poverty and food insecurity are closely related—they both provide an assessment of inadequate income. Food-insecure households are those that have difficulty at some time during the year providing enough food for active, healthy living for all their members due to a lack of money and other resources. Within the group of food-insecure households, the very low food security category identifies households in which food intake of one or more members was reduced and eating patterns disrupted because of insufficient money and other resources for food. Data from 2012 indicate that rates of food insecurity for households with incomes near or below the Federal poverty line were substantially higher than the national average.

The substantial and temporary increase in SNAP benefit levels enacted by the American Recovery and Reinvestment Act (ARRA) in April 2009 provided ERS researchers an opportunity to examine the effects of changes to SNAP benefit amounts on household food security. ARRA increased the maximum SNAP benefit by 13.6 percent. Under the legislation, maximum benefits were to stay at the dollar amounts set by ARRA, and over time, rising food prices would reduce the real value of the ARRA increase. Subsequent legislation ruled that benefit calculations would revert to pre-ARRA formulas in November 2013. Between late 2008 and late 2009, participation in SNAP increased, food spending grew, and food security improved among likely SNAP-eligible households, despite continued rising unemployment during the year. Among households with incomes somewhat above SNAP-eligibility cutoffs, food spending increased by a smaller amount and food security did not improve, suggesting that the improved food security among SNAP-eligible households was due to the ARRA increase.
From 2009 to 2011, the food security of SNAP households worsened as inflation reduced the buying power of the ARRA SNAP benefit increase by about half. The percentage of SNAP households with very low food security, which had fallen from 2008 to 2009, increased from 12.1 percent in 2009 to 13.8 percent in 2011. Similar changes were not seen in low-income households that did not participate in SNAP or in households with incomes just above the eligibility cutoff. Taken together, the two studies provide estimates of the extent to which changes in SNAP benefit levels affect the food security of low-income households.

…Respond to Economic Conditions…
The size of the population eligible to participate in food and nutrition assistance programs, as for all means-tested programs, is fundamentally linked to the economic health of the country. That is, the number of those who are eligible for the food assistance programs rises during recessionary periods when the number of poor people increases, and falls when the number of poor people decreases. ERS researchers examined the relationship between economic conditions and participation in USDA’s major food assistance programs over four complete business cycles from FY 1976 to FY 2010. Each cycle consisted of a period of economic growth and was defined by a falling annual unemployment rate and a period of economic decline by a rising annual unemployment rate.
SNAP is the nutrition assistance program that is most responsive to changes in economic conditions, since everyone who applies for benefits and meets eligibility requirements receives assistance. Participation in the program generally tracks the number of people in poverty. During the 2008-10 period of economic decline that included the Great Recession, the increase in SNAP participation from 26.3 million in 2007 to 40.3 million in 2010 was the largest 3-year increase since the program began in the 1960s. Similarly, the increase in the unemployment rate—from 4.5 percent in 2007 to 9.8 percent in 2010—was also the largest since the 1960s. The size of the SNAP caseload increase relative to the increase in unemployment—an increase of 2.7 million SNAP participants per 1-percentage-point increase in the unemployment rate—was similar to the previous two economic declines.

Other major nutrition assistance programs are also affected by economic conditions. For example, while economic conditions do not affect total participation in the National School Lunch Program and the School Breakfast Program, the percentage of children receiving free or reduced-price meals appears related to economic conditions, rising during periods of economic decline. During the Great Recession, the share of National School Lunch Program participants receiving free or reduced-price lunches grew from 59 percent before the recession to 65 percent in FY 2010. Thus, these other programs, like SNAP, are countercyclical, with their use by needy families increasing during economic downturns.
…and Provide Support for the Working Poor
By reacting to economic conditions, food assistance programs are responsive to the needs of households with working poor members, as well as the recently unemployed, who are more likely to be affected by job loss and declining incomes when the economy falters than are persons not in the labor force. Households with people who are working but earning little from their jobs are an important target of program outreach efforts.
Historically, the working poor participate in SNAP at lower rates than many other eligible groups. FNS estimated that 65 percent of eligible individuals living in households with earnings received SNAP benefits, compared to a 75-percent participation rate for all eligible individuals in 2010. FNS data indicate that almost one-third (30 percent) of SNAP households in 2011 had earnings in the same month they received SNAP benefits, including almost half (49 percent) of all SNAP households with children.
USDA’s food and nutrition assistance programs—many of which were conceived half a century ago—are still some of the Federal Government’s most important means of fighting poverty and improving the economic well-being of needy Americans.
Alleviating Poverty in the United States: The Critical Role of SNAP Benefits, by Laura Tiehen, Dean Jolliffe, and Craig Gundersen, USDA, Economic Research Service, April 2012
Effects of the Decline in the Real Value of SNAP Benefits From 2009 to 2011, by Mark Nord, USDA, Economic Research Service, August 2013
Food Assistance Landscape: FY 2012 Annual Report, by Victor Oliveira, USDA, Economic Research Service, March 2013
Food Security Improved Following the 2009 ARRA Increase in SNAP Benefits, by Mark Nord and Mark Prell, USDA, Economic Research Service, April 2011
Household Food Security in the United States in 2012, by Alisha Coleman-Jensen, Mark Nord, and Anita Singh, USDA, Economic Research Service, September 2013
How Economic Conditions Affect Participation in USDA Nutrition Assistance Programs, by Kenneth Hanson and Victor Oliveira, USDA, Economic Research Service, September 2012
Poverty Measurement: Orshansky’s Original Measures and the Development of Alternatives, Review of Agricultural Economics, Vol. 30, Issue 3, January 2008
SNAP Benefits Alleviate the Intensity and Incidence of Poverty, by Laura Tiehen and Michele Ver Ploeg, USDA, Economic Research Service, June 2012