
Debt Landscape for U.S. Farms Has Shifted
- by Michael Harris, Robert Dubman, Robert Williams and John Dillard
- 12/1/2009
Highlights
- Farm debt levels have risen sharply in recent years, but the growth in asset values has outpaced the growth in debt.
- Fewer farms end the year with debt outstanding than in the past; debt is more concentrated in larger farms.
- Debt repayment capacity is expected to decrease in 2009, but remains well above levels observed in the late 1970s and early 1980s.
Disruptions in U.S. credit markets have heightened concerns about the level of farm debt and the financial structure of U.S. farm businesses. These credit issues, combined with prospects for tightened cash flows and declining land values, have resulted in concerns about farmers’ ability to handle debt obligations. Growth in debt levels may be perceived as drawing down agriculture’s credit reserves and hastening debt repayment problems should farm financial conditions worsen. But if a firm has favorable long-term earnings prospects, debt financing may also be viewed as a way to invest in and grow a business.
Debt, however, is only part of the story. To assess potential problems that farmers might confront from the use of debt financing, debt has to be examined in terms of its level, the leverage position of farms, and in light of the debt repayment capacity available to meet debt service and other payment obligations.
Debt Growth Has Been Balanced by Increasing Assets
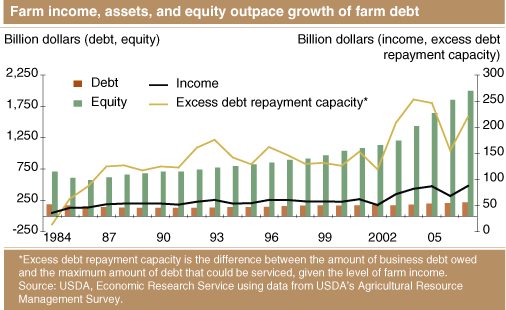
U.S. farm sector debt was an estimated $240 billion at the end of 2008. Debt outstanding has risen steadily since the 1980s. Sectorwide farm debt is forecast to be $234 billion by the end of 2009, ending the string of record-high debt levels in U.S. agriculture begun in 2005 when debt levels exceeded the previous record, set in 1984, during the farm financial crisis.
Despite these high debt levels, debt relative to assets and income remains relatively low. Asset values in the U.S. farm sector have steadily increased since the farm crisis of the 1980s, and increased even more rapidly after farmland values jumped in 2004. By 2007, farm sector asset values, at $2.2 trillion, were more than three times their 1980s nominal level. Preliminary estimates for 2008 show assets falling to $1.77 trillion, while the forecast for 2009 drops even further to $1.7 trillion. Even with the reduction in asset value estimated for 2009, asset values still stand at 2.7 times their mid-1980s farm crisis low. Lenders’ share of farm assets (the sector’s debt to asset ratio) fell from 22 percent in the 1980s to less than 10 percent in 2007. Despite falling asset values since then, this figure is projected to remain about 12 percent in 2009.
Debt Use Is Concentrated Among Fewer Operators
According to USDA’s Agricultural Resource Management Survey (ARMS), a joint effort by ERS and the National Agricultural Statistics Service, the distribution of farm debt reveals several trends. First, the share of farm businesses that end the year with unpaid debt has declined. While many farm businesses use credit cards and lines of credit to finance input purchases during the year, most pay off their loans during the current production cycle, normally by year’s end. The debt discussed in the remainder of this article comprises loans with balances carried on the farm business balance sheet from one year to the next.
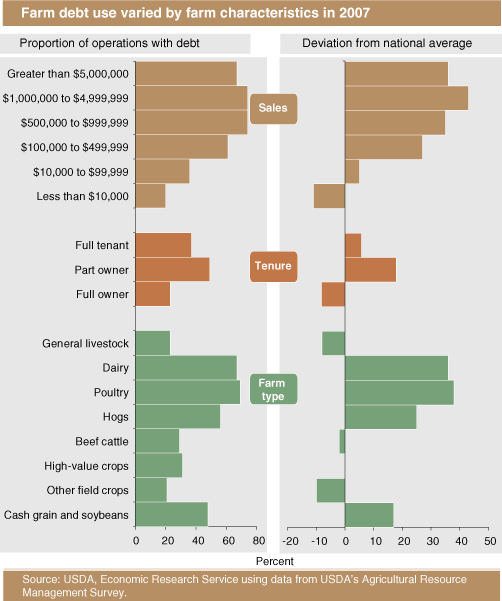
In 1986, nearly 60 percent of U.S. farm operators reported outstanding debt at the end of the year; by 2007, this figure had dropped to 31 percent. Larger farms, with a greater asset base and higher revenues, are now much more likely to use debt than are smaller farms. The majority of smaller farms surveyed indicated that they have sufficient funds to finance their operations.
Poultry, hog, dairy, and cash grain farms tend to require more capital-intensive production practices and facilities, and their operators are more likely than other farmers to use debt to finance these enterprises. Over two-thirds of poultry and dairy operators owed debt at year-end 2007, as did 56 percent of hog farmers. Overall, dairy operations totaled about 3 percent of U.S. farms in 2007, but owed 13 percent of debt. Corn and general cash grain farms together accounted for 10 percent of farms and about 23 percent of debt.
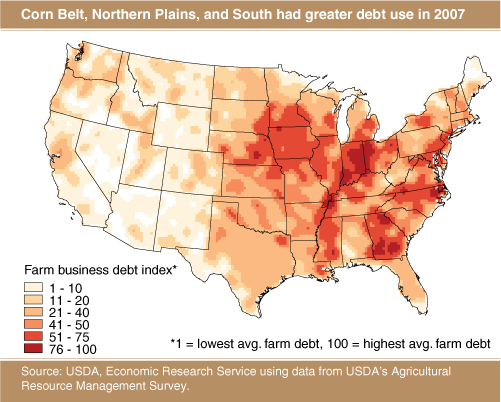
At the end of 2007, 50 percent of farm business debt was held by 15 percent of farmers, compared with 30 percent held by farmers at the end of 1986. Farm debt is also concentrated geographically, with the Corn Belt, the Northern Plains, and the Southeast having relatively high levels of debt due to their larger share of grain, hog, poultry, and dairy operations.
Most Farmers Operate Debt Free
At the end of 2007, 65 percent of farmers reported having no debt outstanding on their farm business balance sheet (although some of these farmers may have used and repaid a line of credit during the year to finance farm activities). These self-financed, debt-free farms are the smallest in terms of land operated, averaging 258 acres.
ARMS data show that 7 of 10 debt-free farms had less than $10,000 in sales. Yet, not all debt-free farms are small. For example, over 14 percent of farmers with annual sales between $1 million and $5 million reported owing no debt at the end of 2007. Nonetheless, on average, farms that reported outstanding debt or that had an established line of credit were larger than farms that operated debt-free.
Most Farms Holding Debt Have One Loan From One Lender
More than half of farms with farm debt outstanding reported having only one loan from one lender according to the 2007 ARMS. These farms tend to be smaller than farms reporting multiple loans, whether from a single lender or multiple lenders. The 2 percent of farms with sales over $1 million in 2007 accounted for about 10 percent of farms reporting multiple loans from multiple lenders. Even when only one lender is used, large farm operations more commonly have multiple loans than smaller farm businesses.
Farmers with one lender and multiple loans accounted for about 6 percent of farm operators in 2007 but 24 percent of the outstanding debt reported by farmers. Farms that reported multiple loans from multiple lenders also accounted for about 6 percent of farms, but more than 31 percent of outstanding debt. Thus, over half of farm-level business debt is owed by farms with multiple loans, often from multiple lenders.
The presence of multiple loans and multiple lenders can complicate the relationship between lenders and borrowers, particularly when a farm has multiple operators, because of issues involving the underlying collateral for loan security and sources of earnings for repayment. These issues are more likely to arise as electronic loan submissions and interactions between borrowers and lenders in different geographic regions become more common. In 2007, for example, operators of larger farm businesses reported traveling over twice as far as the average farm operator to obtain farm credit, with farms of between $1 million and $5 million averaging 23 miles versus 11 miles for all farms. Farms with sales in excess of $5 million traveled even farther to obtain financing, averaging over 40 miles.
Debt Repayment Capacity of U.S. Farms Is Highly Dependent on Farm Earnings
Farm debt has increased more slowly than income. As a result, the ratio of debt to income, according to ARMS data, has trended down from about five times annual income in the 1980s to less than three times annual income in 2007.
Debt repayment capacity utilization (DRCU) goes further than the simple relationship between debt and income; it measures debt obligations in relation to maximum debt repayment capabilities. The lower the DRCU measure, the less debt repayment capacity is being utilized. The DRCU for U.S. farm operators fell from an estimated 27 percent in 2001 to an estimated 18 percent in 2007. One reason for the increased debt repayment cushion is that farmers—even those with debt in excess of 70 percent of assets—have been able to generate higher rates of return during the past several years, amid relatively low and stable interest rates. Debt use in 2008 increased and is expected to decrease in 2009. A contributing factor is an anticipated decrease in non-real-estate debt driven by a reduction in production expenses and a large carryover of income from 2008. However, debt in both years remains higher than in 2007. Income is expected to drop in 2009, due to lower revenues and higher costs. As a result, debt repayment capacity use is expected to increase but should remain below the levels of the late 1970s and early 1980s (in the 1980s, the sector DRCU exceeded 100 percent).
As with farm debt, the level of DRCU is not uniform among farm businesses. Larger farms are more likely to use a larger share of their debt repayment capacity. Operations with less than $100,000 in sales had a DRCU of 10 percent in 2007, while the DRCU of farms with over $5 million in sales averaged 29 percent. Farms with large investments in land, machinery, equipment, and other capital items, such as dairy, poultry, and hog operations, also have DRCUs that are significantly higher than the national average. The DRCU for dairy and poultry operations has increased since 2001, indicating that these operators are using more of their credit cushion in their businesses. Expectations are that dairy farm income will drop further in 2009, relative to 2003-07 levels, than income for farmers specializing in other commodities. If so, dairy operations will likely use an even greater share of their credit capacity this year.
The capital structure of U.S. farms has changed over the last two decades. Fewer farms have outstanding debts than in the past, but debt carried is concentrated among fewer and larger farms. Because debt is concentrated among larger farms, the aggregate loan repayment performance of agricultural credit is increasingly dependent on a smaller group of farm operations. If asset values or incomes falter, the burden of these declines will fall on fewer and larger producers and their creditors.
This article is drawn from:
- Harris, M., Johnson, J., Dillard, J., Williams, R. & Dubman, R. (2009). The Debt Finance Landscape for U.S. Farming and Farm Businesses. U.S. Department of Agriculture, Economic Research Service. AIS-87.
You may also like:
- Farm Sector Income & Finances - Assets, Debt, and Wealth. (n.d.). U.S. Department of Agriculture, Economic Research Service.