

Despite Higher Food Prices, Percent of U.S. Income Spent on Food Remains Constant
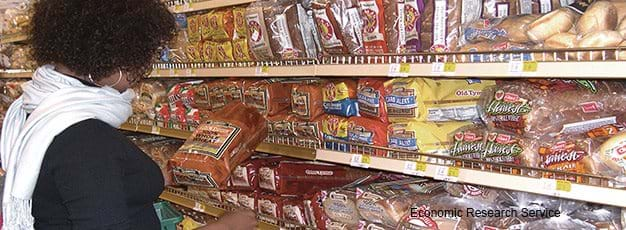
Over the past 2 years, U.S. food prices have risen faster than at any time since 1990. Prices for all food purchased in the U.S. increased 4.0 percent in 2007, up from the 2.4-percent gain in 2006.
The U.S. Department of Labor’s Bureau of Labor Statistics collects price data for food purchased in grocery stores and other retailers (food at home) and food purchased at restaurants and other eating places (food away from home). Together these two categories are combined to determine the Consumer Price Index (CPI) for all food. Prices for food-at- home rose 4.2 percent in 2007, while food-away-from-home prices increased 3.6 percent. In 2008, food- at-home prices are projected to be up 5 to 6 percent, while prices for food away from home are expected to rise 3.5 to 4.5 percent.
The jump in prices for food at home reflects relatively large increases for staples such as milk, eggs, vegetable oil, and bread. In 2007, retail milk prices rose 11.6 percent, and egg prices were up 29.2 percent, while vegetable oil and bread prices are expected to increase 9 percent or more in 2008. Higher fuel costs for transporting foods to grocery stores and restaurants also contributed to rising food prices.
The average U.S. consumer spent 9.8 percent of disposable personal income (income available after taxes) on all food in 2007—5.7 percent on food at home and 4.1 percent on food away from home. The percentage of disposable income spent on all food, food at home, and food away from home remained constant from 2005 to 2007.
Although food prices rose at an accelerated rate in 2007, Americans overall still spent less than 10 percent of their disposable income on food. Between 1970 and 2005, the percentage of disposable income spent on all food fell from 13.9 to 9.8 percent on average. This drop occurred because prices of other consumer goods outpaced the price of food, and incomes rose at a faster rate than food prices. Disposable personal income increased 5.7 percent in 2007, after increasing 5.9 percent in 2006.
Government surveys indicate that lower income consumers spend a larger share of their available income on food than middle- or higher income consumers. Data from the 2005 Consumer Expenditure Survey indicate that households earning $10,000 to $14,999 a year, before taxes, spent an average of 25 percent of their income on food. Households earning $15,000 to $19,999 a year, before taxes, spent 19 percent of their income on food in 2005. The recent accelerated increase in food prices is likely to result in lower income households spending an even greater share of their available money on food in 2008.
Food Prices, Expenditures, and Establishments, by Patrick Canning, Hayden Stewart, Andrea Carlson, and Quinton Baker, USDA, Economic Research Service, May 2024
Consumer and Producer Price Indexes, by Megan Sweitzer, USDA, Economic Research Service, October 2023