Low Costs Drive Production to Large Dairy Farms
- by William D. McBride, James M. MacDonald and Erik O'Donoghue
- 9/3/2007
Highlights
- Dairy production is shifting to larger farms; small dairy farms are exiting, and more expect to leave in thenext decade.
- Average production costs per hundredweight of milk produced fall sharply with herd size. Large dairy farms earn substantial profits, while most smaller operations experience economic losses.
- Given their cost advantages, the shift of dairy production to large farms contributes to rising industryproductivity and lower real dairy prices.
Dairy farming is undergoing striking changes. In the 1970s, a large dairy farm had a herd of 100 milk cows. Typically, the family operating the farm provided most of the labor and grew most of the herd’s feed on the farm. While thousands of such farms remain in operation, their numbers, as well as their production methods, are in sharp decline.
During the 1970s, a different type of dairy farm began appearing in Western States such as California. These operations were much larger, often with herds of 1,000-2,000 milk cows. Whereas the smaller dairy farms tended to graze their cows on pasture, the new larger ones often housed their cows in large barns or drylot feedyards. While still family owned and operated, the large farms relied extensively on hired labor and on feed purchased off the farm. As the larger dairy farms prospered, milk production began to shift to Western States and smaller dairies started to go out of business.
Larger dairy farms spread rapidly in the 1990s, taking hold in traditional dairy regions, like the Northeast and Upper Midwest. While only 15 dairies over 1,000 head operated in traditional areas in 1992, this number grew to 176 over the next 10 years. Meanwhile, farm sizes continued to grow in the Western production regions, with farms with as many as 5,000 cows increasingly commonplace.
The ongoing reorganization of dairy farming increases productivity, meaning more milk can be produced with an equivalent complement of production inputs. This places downward pressure on farm costs and milk prices. It also creates new challenges for dairy and environmental policies, especially regarding manure management. Recent ERS research documents the industry’s structural changes and identifies their effect on production costs. This article focuses on production costs for farms producing conventional milk.
Dairy Farming Structure Has Changed Rapidly
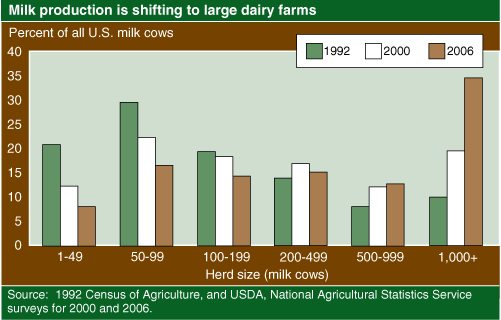
In 1992, about half of all milk cows were on the approximately 135,000 U.S. dairy farms operating with fewer than 100 cows. By 2006, only about 58,000 dairy farms had fewer than 100 cows, accounting for less than one-quarter of all dairy cows.
At the opposite end of the size continuum, 560 dairy farms operated with at least 1,000 dairy cows in 1992. Fourteen years later, over 1,400 such farms accounted for 35 percent of all cows. This trend may be accelerating, as farms with at least 1,000 head added 4 percentage points to their share of cow inventory in 2004-06 alone.
Larger Farms Have Lower Costs
Large dairy farms have significant cost advantages over smaller operations, and those cost advantages are a powerful force for consolidation. Average costs of production per hundredweight of milk fell sharply as herd sizes increased. Large farms with at least 1,000 milk cows had 15 percent lower dairy enterprise costs in 2005 than farms with 500-999 cows, and 25-35 percent less than farms with 200-499 and 100-199 cows.
Overhead costs comprise the major cost advantage held by larger dairy enterprises, as these operations are able to use capital and labor far more intensively than smaller operations. Although most operators and their families do not pay themselves a cash wage for their labor, their labor still has an opportunity cost—they forego other money-earning activities when they work on the farm. An estimate of this opportunity cost is included in a measure of overhead and full economic costs even though the operation does not pay an explicit labor expense.
| Item | Herd size*: 1-49 |
Herd size*: 50-99 |
Herd size*: 100-199 |
Herd size*: 200-499 |
Herd size*: 500-999 |
Herd size*: 1,000+ |
|---|---|---|---|---|---|---|
| Dollars per hundredweight of milk produced | ||||||
| Gross value of production | 17.87 | 17.56 | 17.20 | 17.25 | 16.56 | 16.54 |
| Operating costs | 12.30 | 12.94 | 11.51 | 11.31 | 11.07 | 9.74 |
| Overhead costs | 17.79 | 12.56 | 9.31 | 6.61 | 5.00 | 3.85 |
| Unpaid labor | 10.60 | 6.10 | 3.13 | 1.34 | 0.54 | 0.17 |
| Capital recovery | 5.26 | 4.56 | 3.89 | 2.55 | 2.03 | 1.66 |
| Total costs | 30.09 | 25.50 | 20.82 | 17.92 | 16.07 | 13.59 |
| Net returns | -12.22 | -7.94 | -3.62 | -0.67 | 0.49 | 2.95 |
| *Herd size of milk cows. Source: ERS estimates. |
||||||
Costs Are Only One Side of Financial Performance
A complete financial evaluation looks at net returns, or the difference between a dairy enterprise’s gross value of production and total costs of production. Gross value of production is largely milk sales (89 percent), as well as the value of joint products like cull cow and calf sales and the value of manure produced. Small farms generally realize higher gross values of production per hundredweight of milk because milk prices tend to be higher in regions where small dairy farms predominate.
Despite the price advantage held by smaller farms, the cost advantage of larger enterprises enables them to achieve much higher net returns. In fact, small and mid-size dairy enterprises (with 100-499 cows) had negative net returns, on average, in 2005.
With the largest dairy enterprises providing returns that substantially exceed total costs (including capital recovery and the value of operators’ time), those businesses have attracted investment and are expanding rapidly. Since the returns to small dairy enterprises do not cover all of their costs, many more small enterprises are leaving dairy farming thanare entering.
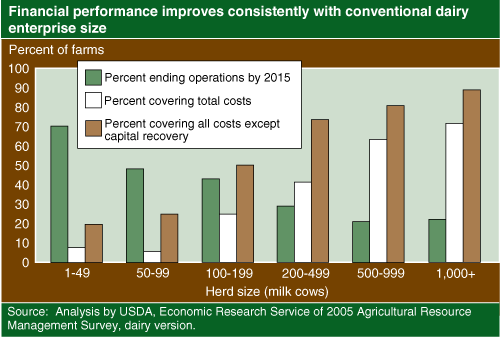
The evidence from net returns is also consistent with operator plans. In a recent USDA survey, dairy farmers were asked how long they expected their operations to continue producing milk. Seventy percent of the farms with fewer than 50 cows expected to end milk production within 10 years. Exit expectations fell steadily as farm size increased, from 48 percent among farms with 50-99 cows to 20 percent of those with at least 1,000 cows.
Many small operations will continue producing milk. Some may be exceptionally well managed or may have favorable input or product prices that provide them with above-average profits. Others may venture into related profit-making opportunities, or niche markets, for higher valued dairy products, such as organic dairy products (see “Comparing Costs: Organic and Conventional Dairy Enterprises”). Even though small farms show losses on average, 25 percent of farms with 100-199 cows realized positive net returns in 2005. These farms earned enough to cover all costs, including capital replacement costs and estimated costs for operators’ unpaid labor. Six percent of farms with fewer than 100 head and 41 percent of farms with 200-499 head earned positive net returns in 2005.
Some other small and midsized operations may continue to operate, even though net returns are negative. Net returns drive investment decisions. Farmers are unlikely to invest capital and labor in new farms or farm expansions that are unlikely to cover the costs of those commitments. But other financial indicators may be more relevant for the decision to continue operating an existing farm. Operators of existing farms have already committed their equipment and structures, and that capital may have a very low salvage value. Capital recovery costs may be irrelevant to their decision to continue operating; what matters is not whether the value of production exceeds total costs, but whether it exceeds all costs except for capital recovery. Fifty percent of farms with 100-199 cows met that financial performance standard in 2005, as did 25 percent of those with 50-99 cows and 73 percent with 200-499 cows. Operations that cannot meet that financial standard are more likely to close because their operators can earn a better return on their labor from off-farm work.
Will Large Farms Get Larger?
On average, large dairy farms exhibit better financial performance than small. But ongoing structural change has led to even larger farms, with 5,000 and 10,000 cows. ERS’s financial database is not comprehensive enough to tell whether farms of that size have financial advantages over farms with 1,000 cows, but other evidence suggests that they might.
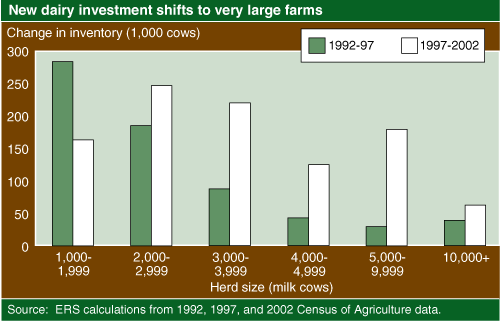
Specifically, patterns of expansion among large farms changed sharply in recent years, suggesting that the largest farms might have further cost advantages. Between 1992 and 1997, most capacity expansion at large farms occurred in farms with 1,000-3,000 head. But after 1997, most new capacity at large dairy farms was added on farms with more than 3,000 head, with some going to operations with over 10,000 head. Operators may have discovered ways to more effectively manage much larger dairy farms in recent years, and the bulk of new large farm investment appears directed at those much larger farms. In turn, those investments may place even greater cost pressures on smaller operations.
Structural Change Has Market, Environmental, and Policy Impacts
The improved efficiency of large farms frees resources for other uses and exerts downward pressure on milk prices. While the prices that dairy farmers pay for inputs like feed has continued to increase, efficiency improvements in dairy production have kept farm-level milk prices from rising. USDA’s index of prices paid for livestock inputs rose by 43 percent between 1992 and 2006. While farm-level milk prices fluctuated over the same period, they showed very little trend. That performance reflects steady improvements in genetics, feed formulation, equipment design, and management, as well as a shift of production from smaller to larger farms.
The average farm-level milk price in 2005 was $15.14 per hundredweight. Prices fell to $12.90 in 2006, before rising to $20 in June 2007. Higher prices in 2007 were driven by ethanol-fueled increases in feed prices and by greater world demand for dry dairy products. However, the cost relationships outlined in this article have not been fundamentally altered. Larger operations still have substantial cost advantages, and shifts of production to larger enterprises will place downward pressure on industry-wide costs and prices, thus offsetting some of the impact of any long-term increases in feed expenses.
While structural change has led to improved efficiency and lower milk prices, it also concentrates milk cows and their manure onto a smaller land base. Large farms operate less land per cow, heightening the risk of environmental damages from manure nutrients being applied beyond the capacity of crops to assimilate them. In response to structural change in livestock and poultry production, State and Federal regulators have promulgated sets of regulations to guide manure and wastewater management in large confined animal feeding operations (CAFOs), including large dairy farms. At present, the costs of conforming to such regulation at large dairies appear unlikely to offset the production cost advantages held by those operations, so structural change will likely continue.
Structural change can also complicate the effects of dairy policy. Traditionally, dairy policies have been designed to improve farm operator incomes by influencing the prices that producers receive for their milk. For example, price support programs were designed to raise the minimum prices received by all producers—regardless of herd size. But with wide disparities in production costs, prices that might cover costs for midsize farms would yield large profits, and very strong expansion incentives for large dairies.
Congress introduced counter-cyclical payments in the 2002 farm bill under the Milk Income Loss Contract (MILC) program (extended with some modifications in 2005), under which farmers can receive direct payments in months when market prices fall below a targeted level. Payments are restricted to the first 2.4 million pounds of production on a farm, the approximate annual amount that a farm with about 120 cows (at 2006 average milk yields) can produce in a year.
Payments under the program commence when milk prices fall below a reference level, and increase, although not dollar for dollar, as prices fall further. The payments cushion producers against price declines and provide stronger revenue support during periods of low prices to small operations and to regions where such farms predominate. This may help some small producers cover their operating costs during market downswings and avoid closure. Still, given the powerful cost advantages of large dairies, the payments have not counteracted the pronounced shift of production to larger farms.
This article is drawn from:
- Commodity Costs and Returns. (n.d.). U.S. Department of Agriculture, Economic Research Service.
- MacDonald, J.M., O'Donoghue, E., McBride, W.D., Nehring, R., Sandretto, C. & Mosheim, R. (2007). Profits, Costs, and the Changing Structure of Dairy Farming. U.S. Department of Agriculture, Economic Research Service. ERR-47.
You may also like:
- Dairy. (n.d.). U.S. Department of Agriculture, Economic Research Service.
- Blayney, D. (2004). The Changing Landscape of U.S. Milk Production. U.S. Department of Agriculture, Economic Research Service. SB-978.
- Economic Effects of U.S. Dairy Policy and Alternative Approaches to Dairy Policy. (2004). U.S. Department of Agriculture. Report to Congress..


