(Selected research findings from FY 22)

This report uses trend analysis to see whether movements in trade, production, and Gross Domestic Product (GDP) data are consistent with the concept that free trade agreements (FTAs) produce beneficial effects for developing countries—focusing on FTAs between developing countries and the United States. As countries specialize in the production of goods for which they maintain a comparative advantage relative to member FTA countries, specific commodities often see the largest changes in trade. This finding is especially true for developing countries in Central and South America.

China is one of the top importers of agricultural products, but it has nontariff measures that prevent its imports from growing even larger. In this report, ERS researchers examined differentials between domestic and import prices to assess the presence of trade barriers or frictions that may prevent imports from reaching their potential. The four key commodities examined were beef, corn, pork, and wheat. China’s beef prices were about 80–90 percent higher than U.S. imported beef prices in 2020 despite rapid growth in imports. ERS also examined two scenarios in which removing trade barriers could lead to an increase in China’s imports.

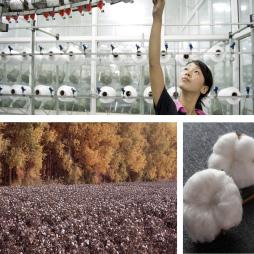
China is the world’s largest textile manufacturer and cotton consumer, but changes in China’s economy are reshaping the geography of its cotton-textile sector. This report reviews economic factors and policies that led to the geographic separation of China's cotton production from its textile industry and the impacts on China's imported and domestic cotton. Nearly all of China’s cotton is produced in the country’s Xinjiang Region, while textile manufacturers, the main consumers of cotton, are concentrated in coastal and central regions where cotton production has fallen dramatically. China’s role as a cotton importer appears to have peaked, while other countries are increasing their share of imports. USDA baseline projections suggest that by 2030 Vietnam, Pakistan, Indonesia, Bangladesh, and Turkey will together account for 47 percent of the world’s cotton imports while China will only account for 24 percent.

In 2018, the United States imposed Section 232 tariffs on steel and aluminum imports from major trading partners and separately Section 301 tariffs on a broad range of imports from China. In response to these actions, six trading partners—Canada, China, the European Union, India, Mexico, and Turkey—responded with retaliatory tariffs on a range of U.S. agricultural exports, including agricultural and food products. Across retaliatory partners, China accounted for approximately 95 percent of the losses ($25.7 billion), followed by the EU ($0.6 billion), and Mexico ($0.5 billion), with Canada, Turkey, and India having smaller shares. ERS estimated annualized losses for selected commodities from retaliatory tariffs were $13.2 billion from mid-2018 to the end of 2019.

This COVID-19 Working Paper uses detailed trade statistics to explore how and why U.S.-Mexico agricultural trade changed during 2020, the first year of the COVID-19 pandemic. Beef and veal, cotton, and pork were the U.S. agricultural exports to Mexico with the largest decreases in export value between calendar years 2019 and 2020. The agricultural imports from Mexico with the largest increases in import value were tequila, fresh tomatoes, and beer. The economic downturn and shift away from food expenditures at hotels, restaurants, and institutional establishments because of the pandemic explain some of these changes.

This report examined the 10 leading U.S. agricultural exports to Colombia in terms of value, in addition to 5 other U.S. agricultural exports to Colombia that have significantly increased since the implementation of the U.S.-Colombia Trade Promotion Agreement (TPA) in May 2012. Food is one of the largest categories of household expenditures in Colombia. The combined effect of expanded purchasing power, a larger middle class, and consumers willing to try new foods generated many changes in the Colombian diet from 2009 to the start of the COVID-19 pandemic in 2020. On average, Colombians were consuming more chicken and pork and had increased their expenditures on food away from home, convenience food, and fresh food—most notably fish and seafood, meat, and vegetables.

This COVID-19 Working Paper illuminates the impact that volatility in international commodity prices has on U.S. agricultural product export volumes to sub-Saharan Africa (SSA). The COVID-19 pandemic has created a period of intense price volatility, offering a unique opportunity for modeling potential effects of a global shock on trade with these nations. This analysis revealed declines in overall trade and consumption stemming from the economic shock across each SSA model. These results aligned with expectations in which the pandemic led to a decline—by varying degrees— across all commodities and indicators in each mode.
