(Selected research findings from Fiscal Year 2019)
The remaining households (11.1 percent) were food insecure at least some time during the year, including 4.3 percent with very low food security because the household lacked money and other resources for food, resulting in reduced food intake and disruptions in eating patterns for one or more household members. The 2018 prevalence of food insecurity declined, for the first time, to the pre-recession (2007) level of 11.1 percent. The decline in overall food insecurity between 2017 and 2018 was statistically significant. The decline in the rate of very low food security from 4.5 percent in 2017 to 4.3 percent in 2018 was not statistically significant. Children and adults were food insecure in 7.1 percent of U.S. households with children in 2018, versus 7.7 percent in 2017. The ERS food security statistics are widely recognized as the benchmark for measuring food security in the U.S., and support decision making on USDA food and nutrition assistance programs.

The Supplemental Nutrition Assistance Program (SNAP) is one of the largest assistance programs in the United States—the U.S. Department of Agriculture spent $65.3 billion on the program in fiscal year 2018 and served an average of 40.3 million people per month. ERS researchers estimated the multiplier effects of SNAP using a newly compiled Social Accounting Matrix multiplier model and the most recent data available. The study estimated that $1 billion in SNAP benefit outlays generates $1.5 billion in gross domestic product, which supports 13,560 new jobs—including $32 million added income going to agricultural industries that support 480 agricultural jobs.
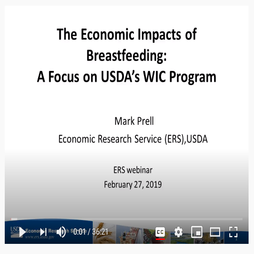
ERS researchers examined the effects of a hypothetical increase in breastfeeding rates among WIC participants from their 2016 levels to medically recommended levels: 90 percent of infants are exclusively breastfed for their first 6 months, followed by continued breastfeeding with the addition of complementary foods—but not infant formula—for the next 6 months. Results indicate that the number of mothers who participated in WIC that year would have increased by an estimated 646,000 per month (an 8-percent increase). WIC program costs would have risen by an estimated $252.4 million, or 4.2 percent of total costs in 2016. As a result of health benefits associated with breastfeeding, Federal Medicaid costs would have decreased by at least $111.6 million, resulting in an estimated increase of $140.9 million in combined Federal WIC and Medicaid costs. Health-related cost savings that accrue to WIC households or their health insurance providers would have totaled $9.0 billion (excluding the savings that accrue to the Federal portion of Medicaid).

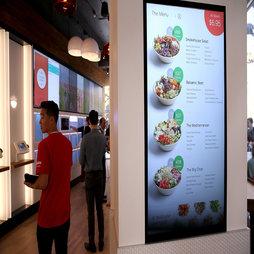
Nutrition information on restaurant menus may help some consumers meet their calorie targets.
ERS researchers examined survey data on restaurant menu label use and calorie intakes among U.S. adults age 20 and older who reported seeing nutrition information on a menu the last time they visited a fast-food or sit-down restaurant. Survey respondents who reported seeing and using restaurant menu labels consumed significantly fewer calories per day than did respondents who reported seeing the labels, but not using them. The relationship between menu label use and caloric intake was similar for both fast-food and sit-down restaurants and was statistically significant in both cases.

