


Global Markets and Trade
(Selected research findings from FY18)
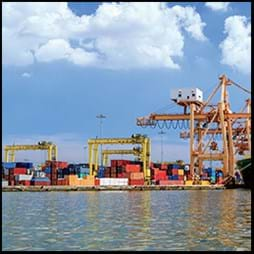 Global agricultural trade, about $1 trillion in 2014, has risen 3.6 percent per year for the last two decades, facilitated by technological change, productivity gains, and trade liberalization.
ERS research surveyed 20 years (1995-2014) of trends in world agricultural trade and summarizes key policy issues that will confront decision-makers and shape agricultural trade in the coming years. Growth occurred across all major categories, with trade in oilseeds/oilseed products growing fastest; however, growth in trade across countries and regions was uneven. Agricultural exports by the five BRIIC (Brazil, Russia, India, Indonesia and China) countries grew much faster than the global average. Agricultural imports of emerging economies grew quickly, dominated by growth in China’s imports; while Europe’s agricultural imports grew much more slowly. The research showed that in general a country’s tariffs tend to be higher for imports that compete with domestic products, and additional duties can be applied for limited periods and in certain circumstances. The research also found that the amount of agricultural domestic support has remained about the same (or fallen) since the URAA for developed countries. Major emerging economies, however, have increased the support they provide to farmers, and recent emphasis on support for agriculture is a sharp departure from earlier policies in some of these countries that implicitly taxed agriculture.
 While the United States is one of the largest supplier of China’s agricultural imports, it has not been a major target of Chinese agricultural investment.
Chinese companies are increasing their investments in foreign agricultural and food assets. Their broad aims are to gain profits for Chinese investors while achieving national food security. ERS research has explored Chinese agricultural investment trends to improve understanding of these ventures, their size and impacts for government and business decision-makers. Apart from the large 2013 acquisition of Smithfield Foods, relatively little Chinese investment has targeted U.S. agriculture. Statistics for 2014 show that North America received only 2 percent of China’s farming, forestry, and fishing investment, the smallest share of any continent. Statistics tracking foreign farmland holdings in the United States show 12-to-25 Chinese acquisitions annually during 2008-13. Chinese investors tend to enter less-developed countries where there are few competitors, potential to raise productivity using Chinese technology, and potential to diversify suppliers of Chinese imports. A few companies with access to financing from Chinese banks are pursuing mergers, acquisitions, and partnerships with companies in more developed markets; most ventures have modest impacts on agricultural trade.
Imports will be necessary to meet China’s growing demand for dairy products.
ERS research examined trends in China’s dairy consumption, production and trade, and analyzed the extent to which future dairy demand would likely be met with domestic or foreign-sourced dairy. Chinese consumption of dairy products is growing rapidly from a historically low base, and China is the primary source of demand growth in global dairy markets. The Chinese government projected that dairy product consumption would grow over 27 percent during 2016-26, with imports rising 50 percent. The European Union and New Zealand are the leading dairy exporters to China; U.S. competitiveness in this market is challenged in part by unfavorable exchange rates. Chinese overseas investments in dairy production and trade are mainly in New Zealand and Australia.
 Food security is projected to improve for many developing countries.
ERS publishes the International Food Security Assessment to inform U.S. policymakers as well as international donor organizations of the food security situation in 76 low- and middle-income countries. The report provides projections of food demand and access based on ERS’s food security model, which allows for analysis of income and price changes on food security. Results were also presented in a well-received webinar and discussed by major press publications such as the WSJ. Given projections for ongoing low food prices and rising incomes, the 2018 report projects food security for most countries in the study to improve through 2028, with food insecurity rates falling from 21 percent in 2018 to 10 percent in 2028. Food-insecure people are defined as those consuming less than the nutritional target of roughly 2,100 calories per day per person. Despite improvements over the years, Sub-Saharan Africa is projected to remain the most food-insecure region in the world.
ERS research examines market impacts of the HPAI outbreak, to inform ongoing efforts by USDA to continuously improve policy and planning for future potential outbreaks. This report found the U.S. poultry sector may be able to recover quickly from production losses from disease events, but other market impacts—such as trade losses and price instability—can persist. Also, disease events can result in disparate impacts across the poultry sector. Affected turkey and egg producers lost significant numbers of birds while egg and turkey producers who were not affected received the benefit of higher prices in the short run without bearing any of the high cost incurred by those directly affected. In addition, disease events can impact related industries even if the disease has no direct effect. The broiler industry lost less than 0.01 percent of its U.S. inventory to HPAI, yet the threat of potential infection was the basis of trade restrictions that contributed to much lower 2015 and 2016 broiler prices compared to pre-outbreak levels.