


Agricultural Economy
(Selected research findings from FY 16)
ERS estimates productivity growth for the aggregate U.S. farm sector.
ERS constructs annual indexes of farm inputs and outputs, as well as total factor productivity (TFP), for the U.S. farm sector. The current series covers 1948-2013. The detailed indexes include 10 separate output categories and 12 input categories, with the inputs adjusted for changes in quality. The accounts are constructed to identify the impacts of changes in input quantities and quality, and TFP, on agricultural output growth. Using data from the productivity accounts, ERS has shown that growth in TFP accounts for nearly all growth in agricultural output, while inputs—particularly land and labor—have declined. TFP growth is driven in turn by innovations developed primarily through investments in public and private research and development.
ERS forecast that net cash farm income and net farm income would decline in 2016 by 13.3 percent and 11.5 percent respectively relative to 2015.
ERS has a prominent role in monitoring the financial health of the farm sector including the performance of farm businesses and well-being of farm households. Published three times a year, these core statistical indicators provide guidance to policy makers, lenders, commodity organizations, farmers, and others interested in the financial status of the farm economy. ERS’s farm income statistics also inform the computation of agriculture’s contribution to the gross domestic product for the U.S. economy in the Bureau of Economic Analysis statistics for GDP.
Nearly a third of all farmland is rented from non-operator landlords. 
The 2014 Tenure, Ownership, and Transition of Agricultural Land (TOTAL) survey, conducted by the National Agricultural Statistics Service (NASS) and ERS, integrates data on farm finance and land ownership in the United States. The TOTAL survey collected data on landlords’ acres rented out, income, expenses, assets, debt, race, gender, land transfer plans, and more, to provide detailed information from all agricultural land owners, whether operating or non-operating. Analysis of the survey data revealed that landlords are more likely to be involved in decisions concerning long-term farm practices such as permanent conservation procedures and government program participation, than in short-term management practices. Also, as most landlords have long-term relationships with their tenants, access to new land through renting may be limited. Ten percent of all land in farms is expected to be transferred over the 2015-2019 period, most of which (6 percent) will change hands through gifts, trusts, or wills. Just over 2 percent of farmland was expected to be sold to a nonrelative of the current owner, illustrating the potential challenges associated with acquiring land through open-market purchase.
Renewable energy production has increased on U.S. farms.
Changes in the energy sector—such as the Renewable Fuel Standard, the shale energy revolution, and the Clean Power Plan to cut carbon emissions—have or could affect the agricultural sector. The number of farms producing renewable energy more than doubled from 2007 to 2012. The shale revolution has provided new revenue streams for farmers owning their mineral rights, with about 6 percent of U.S. farm businesses averaging $56,000 in lease and royalty payments from energy production. The Clean Power Plan is expected to have relatively small impacts for most farm businesses, although electricity rate increases may be greater for agricultural and other rural customers than for other retail customers, due to rural electric cooperatives’ greater share of electricity generation from coal. ERS is the only Federal source for the most current information on energy consumption and production on farms.
Only a portion of producers use antibiotics for production purposes.
ERS researchers examined the incidence and types of antibiotic use in the hog, poultry, beef, and dairy industries and the impact that restrictions on the use of antibiotics for ‘production purposes’ (such as growth promotion) may have on livestock production. Drawing from the Agricultural Resources Management Survey (ARMS), as well as from surveys of the National Animal Health Monitoring System, ERS found that rates of antibiotic administration for production purposes varied by livestock type, but likely declined slightly for hogs and broilers during the study period. On average their use appears to have little impact on productivity. Thus, restrictions are predicted to lead to a small increase (approximately 1 percent) in wholesale prices and a net decline in production of less than 1 percent. The report led to numerous presentations to including invited talks at the Organization Economic Cooperation and Development, the Food and Drug Administration, the National Academy of Science’s Institute of Medicine, and the Farm Foundation.
Precision agriculture technologies are associated with higher returns on U.S. corn farms.
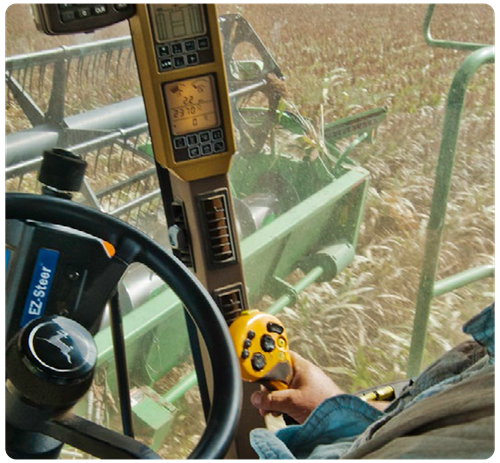 Precision agriculture (PA) and its suite of information technologies—such as soil and yield mapping using a global positioning system (GPS), GPS tractor guidance systems, and variable-rate input application—allow farm operators to fine-tune their production practices. Access to detailed, within-field information can both decrease input costs and increase yields. Adoption rates vary significantly across PA technologies, with yield monitors that produce the data for GPS-based mapping being the most widely adopted on corn and soybean farms. Guidance or auto-steer systems are used on about a third of those farms and GPS-based yield mapping on a quarter. All three technologies were shown in a recent ERS report to have small positive impacts on both net returns (including overhead expenses) and operating profits for a U.S. corn farm of average size. Findings were shared through a USDA Radio News interview and were picked up by a number of news services.
Nearly all canola and sugarbeet acres harvested in 2013 were planted with genetically engineered (GE) seeds containing herbicide-tolerant (HT) traits.
The success of GE HT corn, soybeans, and cotton led to the deregulation that enabled the commercialization of HT canola in 1998 and of HT alfalfa and sugarbeets in 2005. An ERS report uses data from USDA’s 2013 ARMS to examine GE adoption rates among these three crops. About 95 percent of U.S. canola acres (1.3 million acres) and over 99 percent of sugarbeet acres (1.2 million acres) were harvested from GE seeds that year. In contrast, only 13 percent of U.S. alfalfa acres were planted using GE seeds; this slower adoption rate is expected because alfalfa is a perennial crop and only about one-seventh of the alfalfa acreage is newly seeded each year. Farmers who planted GE HT alfalfa in 2013 had about 17 percent higher yields than farmers who planted conventional seeds.
U.S. agriculture has become more concentrated at both the farm and farm product procurement levels.
In the report, Thinning Markets in U.S. Agriculture, ERS focused on how thin markets, which have received attention from policymakers because of concerns that processing firms could depress farm-level prices below those that would prevail in a competitive market. In addition, the low volume of spot market trading in thin markets provides fewer data for market observers and regulators to use, analyze, and publish, leaving producers to wonder whether they are being paid a fair price in a shrinking cash market or in contracts where few price benchmarks may be available. ERS found that markets for many farm products are increasingly concentrated at the processing level; increased coordination between farmers and processors can resolve information problems encountered by traditional spot markets and enhance the efficiency of agricultural production; and processors have an economic incentive to offer a price that is at least sufficient to cover long-run farm costs. ERS economists were interviewed by a variety of media on this topic.
The structure of dairy farming has changed dramatically in the last two decades, shifting to much larger operations, which led to reduced industry-average production costs and contributed to an expansion of dairy product exports.
ERS research traces the linkages between structural change in dairy production, changes in dairy product markets, and growing price volatility. This research identifies the challenges that structural change, evolving product markets, and volatility pose for policy. Drawing from ARMS and Census of Agriculture, as well as data from the Farm Service Agency (FSA) and Agricultural Marketing Service, this study finds the structure of dairy farming has changed dramatically in the last two decades, with cows and production shifting to much larger operations. These changes have led to reduced industry-average production costs and contributed to an expansion of dairy product exports. However, increased international exposure creates new sources of price risks for U.S. farmers, and dairy policy has been redesigned in response to price risks and changing structure. These findings were discussed in industry publications, such as Hoard’s Dairyman, DTN, and Successful Farmer, and also reported in national newspapers and other media.
A farmers’ wealth and decision horizon impacts Federal crop insurance participation decisions.
 Standard economic approaches predict farmer demand for crop insurance. ERS research finds that when savings are considered, wealthier farmers will spend less on insurance and self-insure through savings, while limited-resource farmers with low farm income will use savings, if available, to increase insurance coverage. This research also found that the longer the time horizon when comparing insurance versus savings for risk management, the less important insurance becomes. ERS briefed USDA’s Chief Economist and senior officials at USDA’s Risk Management Agency on this analysis.
In 2012, producers planted nearly half of cropland acres with GE seed.
ERS research highlighted potential impacts of conventional and organic production coexistence. Drawing on data from several USDA producer surveys—including ARMS and the 2014 National Organic Producer Survey—the study found that in 2012, producers planted nearly half of cropland acres with GE seed; over 90 percent of GE acreage was in corn and soybean. Conventional farmers planted 7 percent of corn and 6 percent of soybeans with non-GE seed; less than 0.5 percent of U.S. corn and soybean acres were planted using organic farming systems. USDA data indicate that just 1 percent of all certified organic farmers reported economic losses during 2011-2014. The report led to briefings to policy makers in the Marketing and Regulatory Programs mission area as well as other groups working on biotechnology policy.
Among organic retail foods, eggs and dairy products had the highest organic retail price premiums, while fresh produce has the widest spread of premiums (ranging from 7 percent for spinach to 60 percent for salad mix).
ERS estimated the organic retail price premiums and trends from 2004 to 2010 using store Nielsen Homescan scanner data The Nielsen Homescan data is an annual, nationally representative panel of households’ retail food purchases. Processed food premiums ranged from 22 percent for granola to 54 percent for canned beans. The share of organic product sold increased steadily for all products studied. Sales in 2010 were generally higher for the organic products with lower premiums (e.g., spinach, granola, and carrots); sales were also higher for foods frequently fed to children (such as baby food). The organic food sector has been one of the fastest growing parts of the food industry since USDA began regulating organic labels on food in 2002. The strong organic premiums, combined with increased sales, suggest that there is continued room for growth in the organic supply. Briefings to senior officials at the Food, Nutrition and Consumer Services (FNCS) and the Food and Nutrition Service (FNS) informed decision makers about estimated price premiums and trends in organic retail food sales.