


-
Charts of Note
Fast facts on U.S. agriculture
-
Ag and Food Statistics: Charting the Essentials
The basics on food, farming, and rural America, in a set of 70 charts and maps.
-
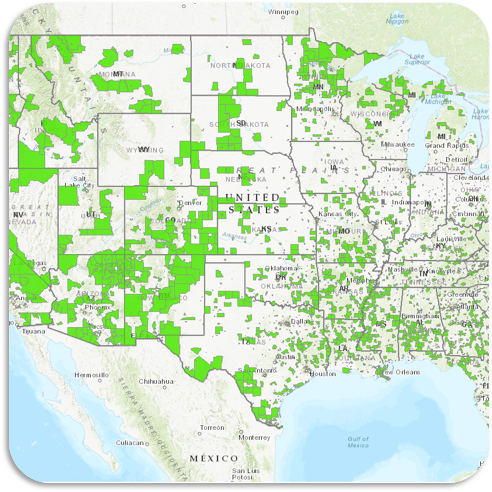
Food Access Research Atlas
Create maps using several options to describe food access.
-
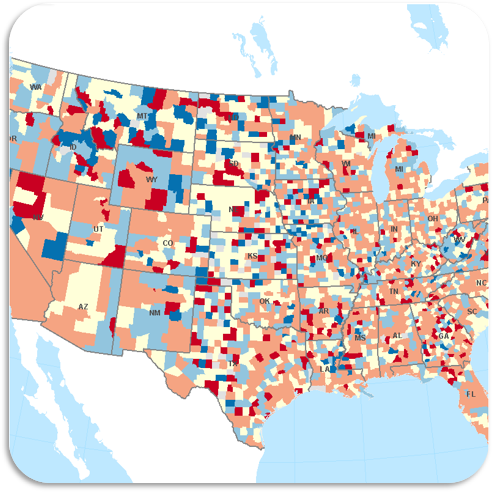
Food Environment Atlas
Use this tool to map community access to affordable, healthy food.
-

Amber Waves
The Economics of Food, Farming, Natural Resources, and Rural America.
-
Data Visualizations
Explore interactive graphs, charts and maps hosted on Tableau Public.
-
Data
Access and analyze charts, maps, downloadable data files, and queryable data applications.
-
The ERS State Fact Sheets provide information on population, income, poverty, food security, education, employment, farm characteristics, farm financial indicators, top commodities, and agricultural exports. Data are available for all States, and for metro/nonmetro breakouts within States (and for Puerto Rico if applicable). Links to county-level data are provided where available.
-
The Food Price Outlook provides food price data and forecasts changes in the Consumer Price Index (CPI) and Producer Price Index (PPI) for food.
-
Vegetables and Pulses Data is a collection of resources that provide users with comprehensive statistics on fresh and processed vegetables and dry pulses in the United States, as well as some global data for these sectors.