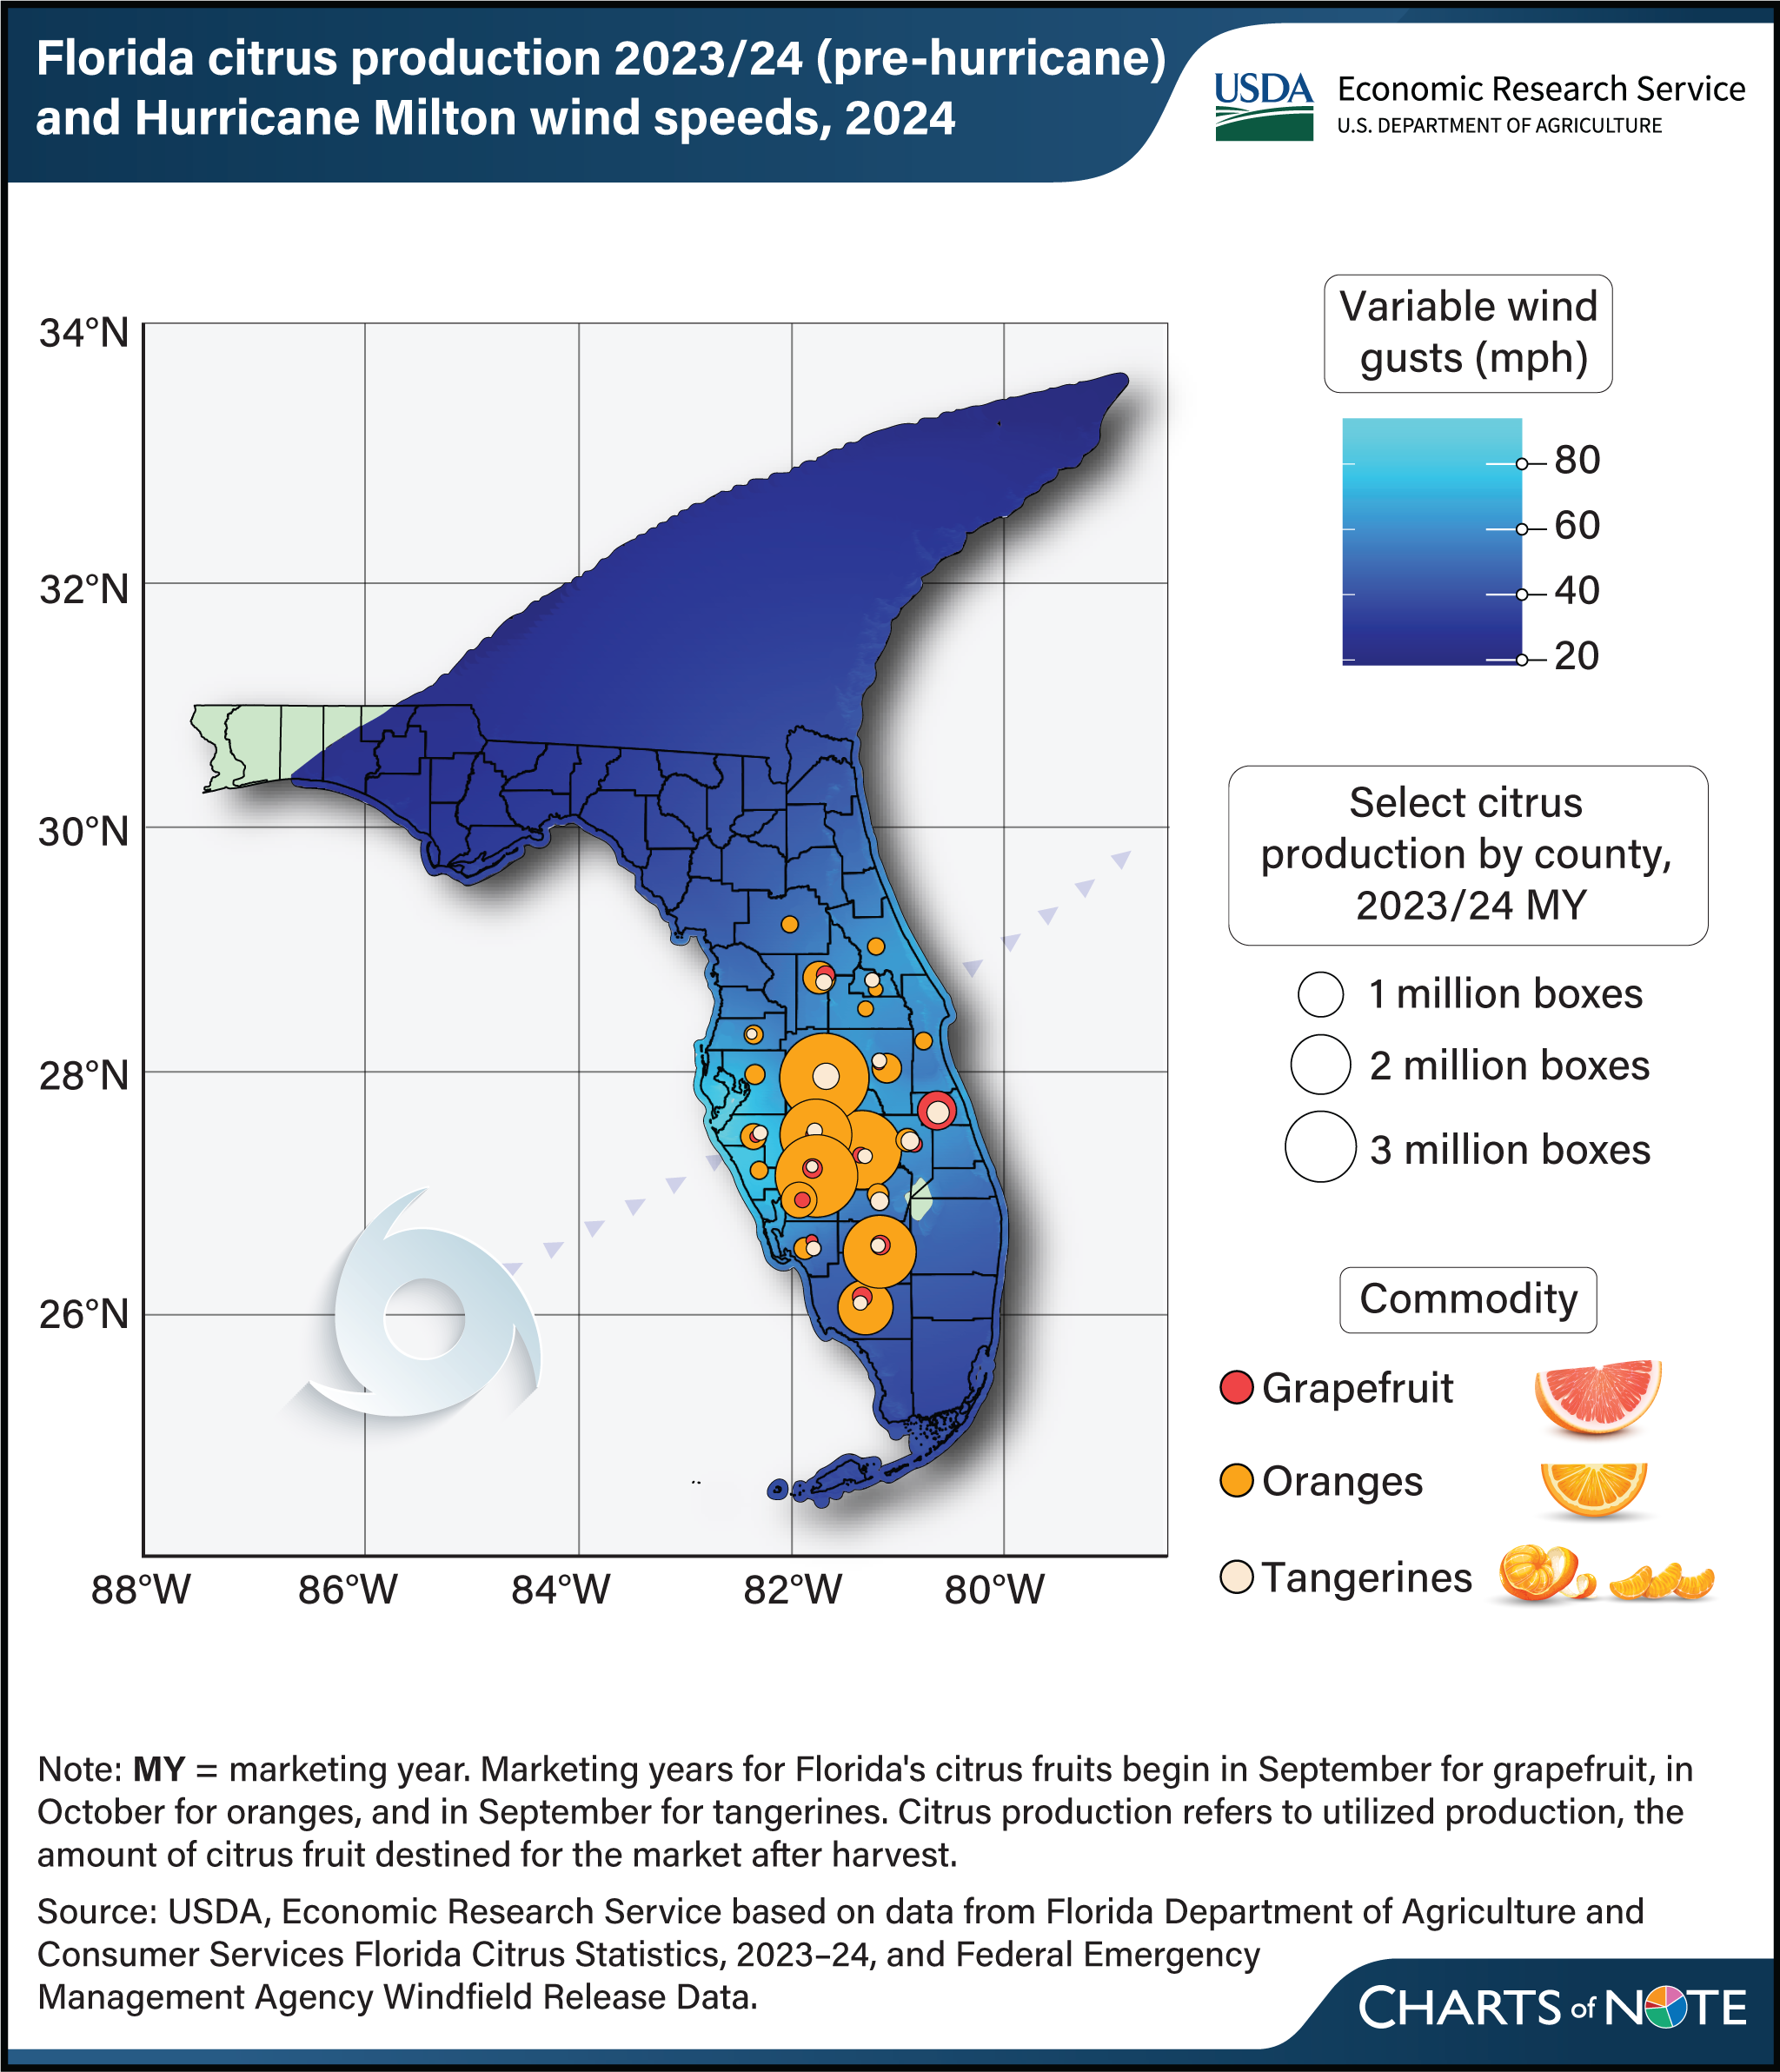
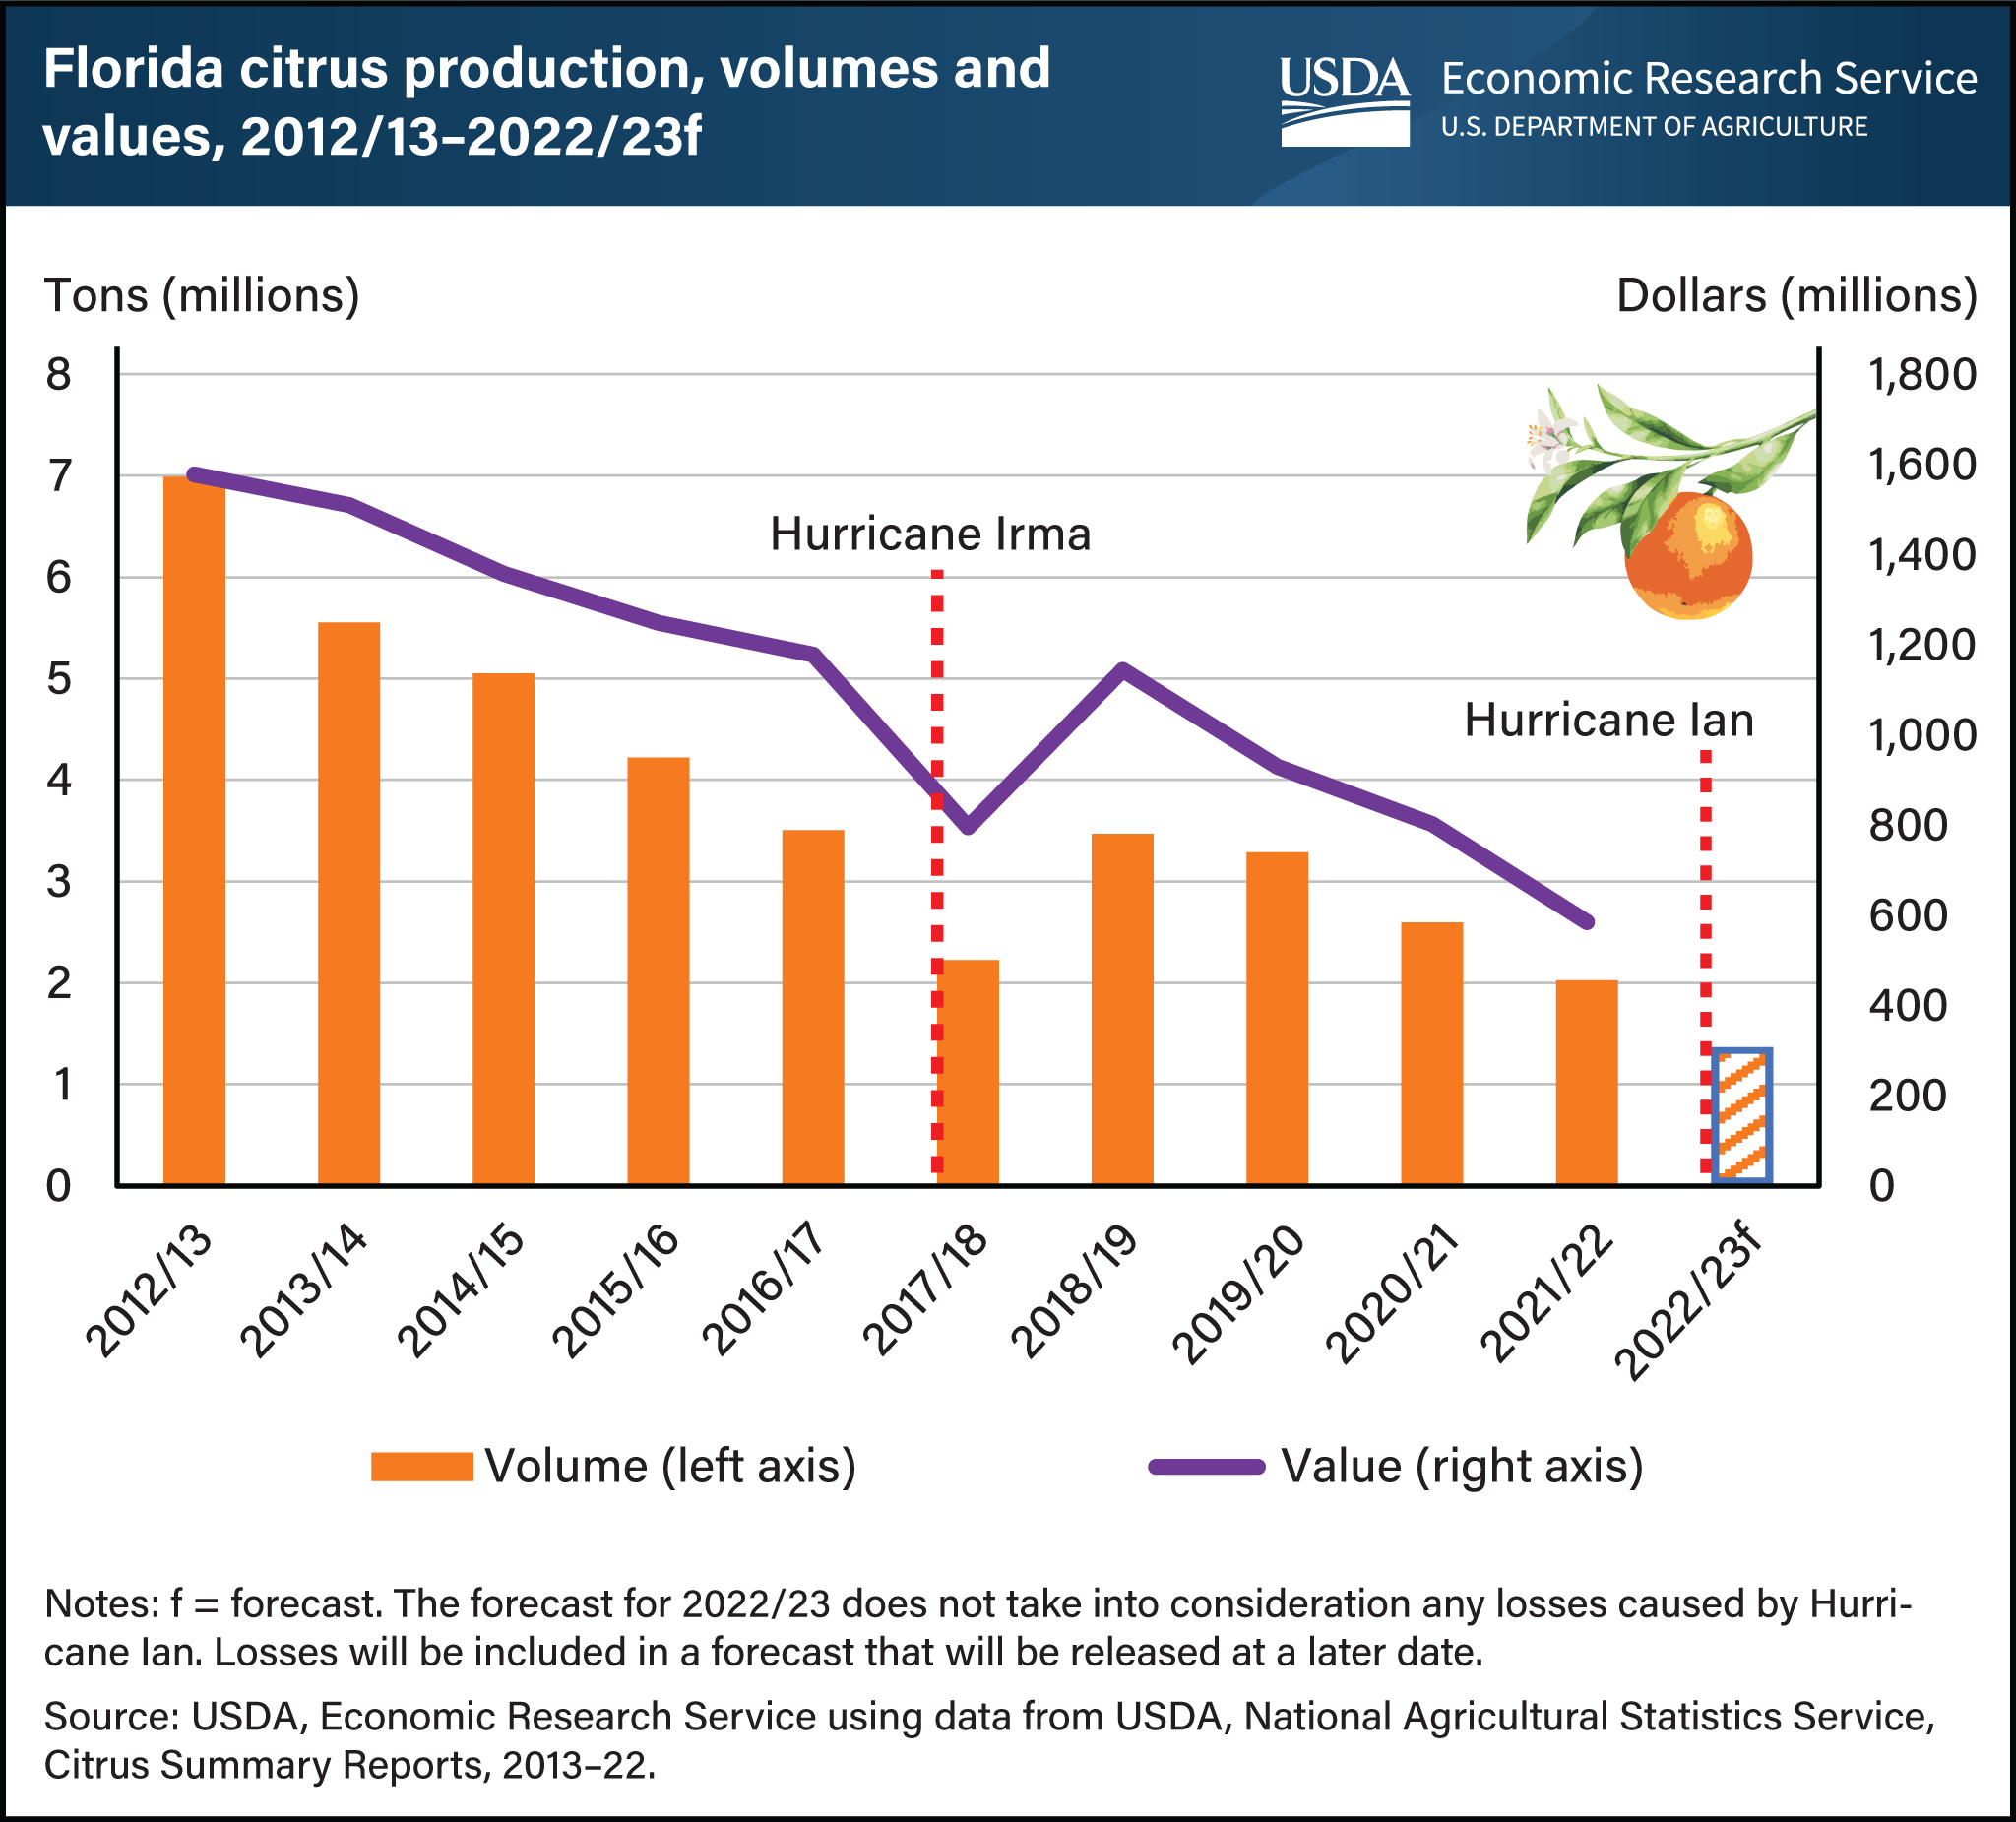
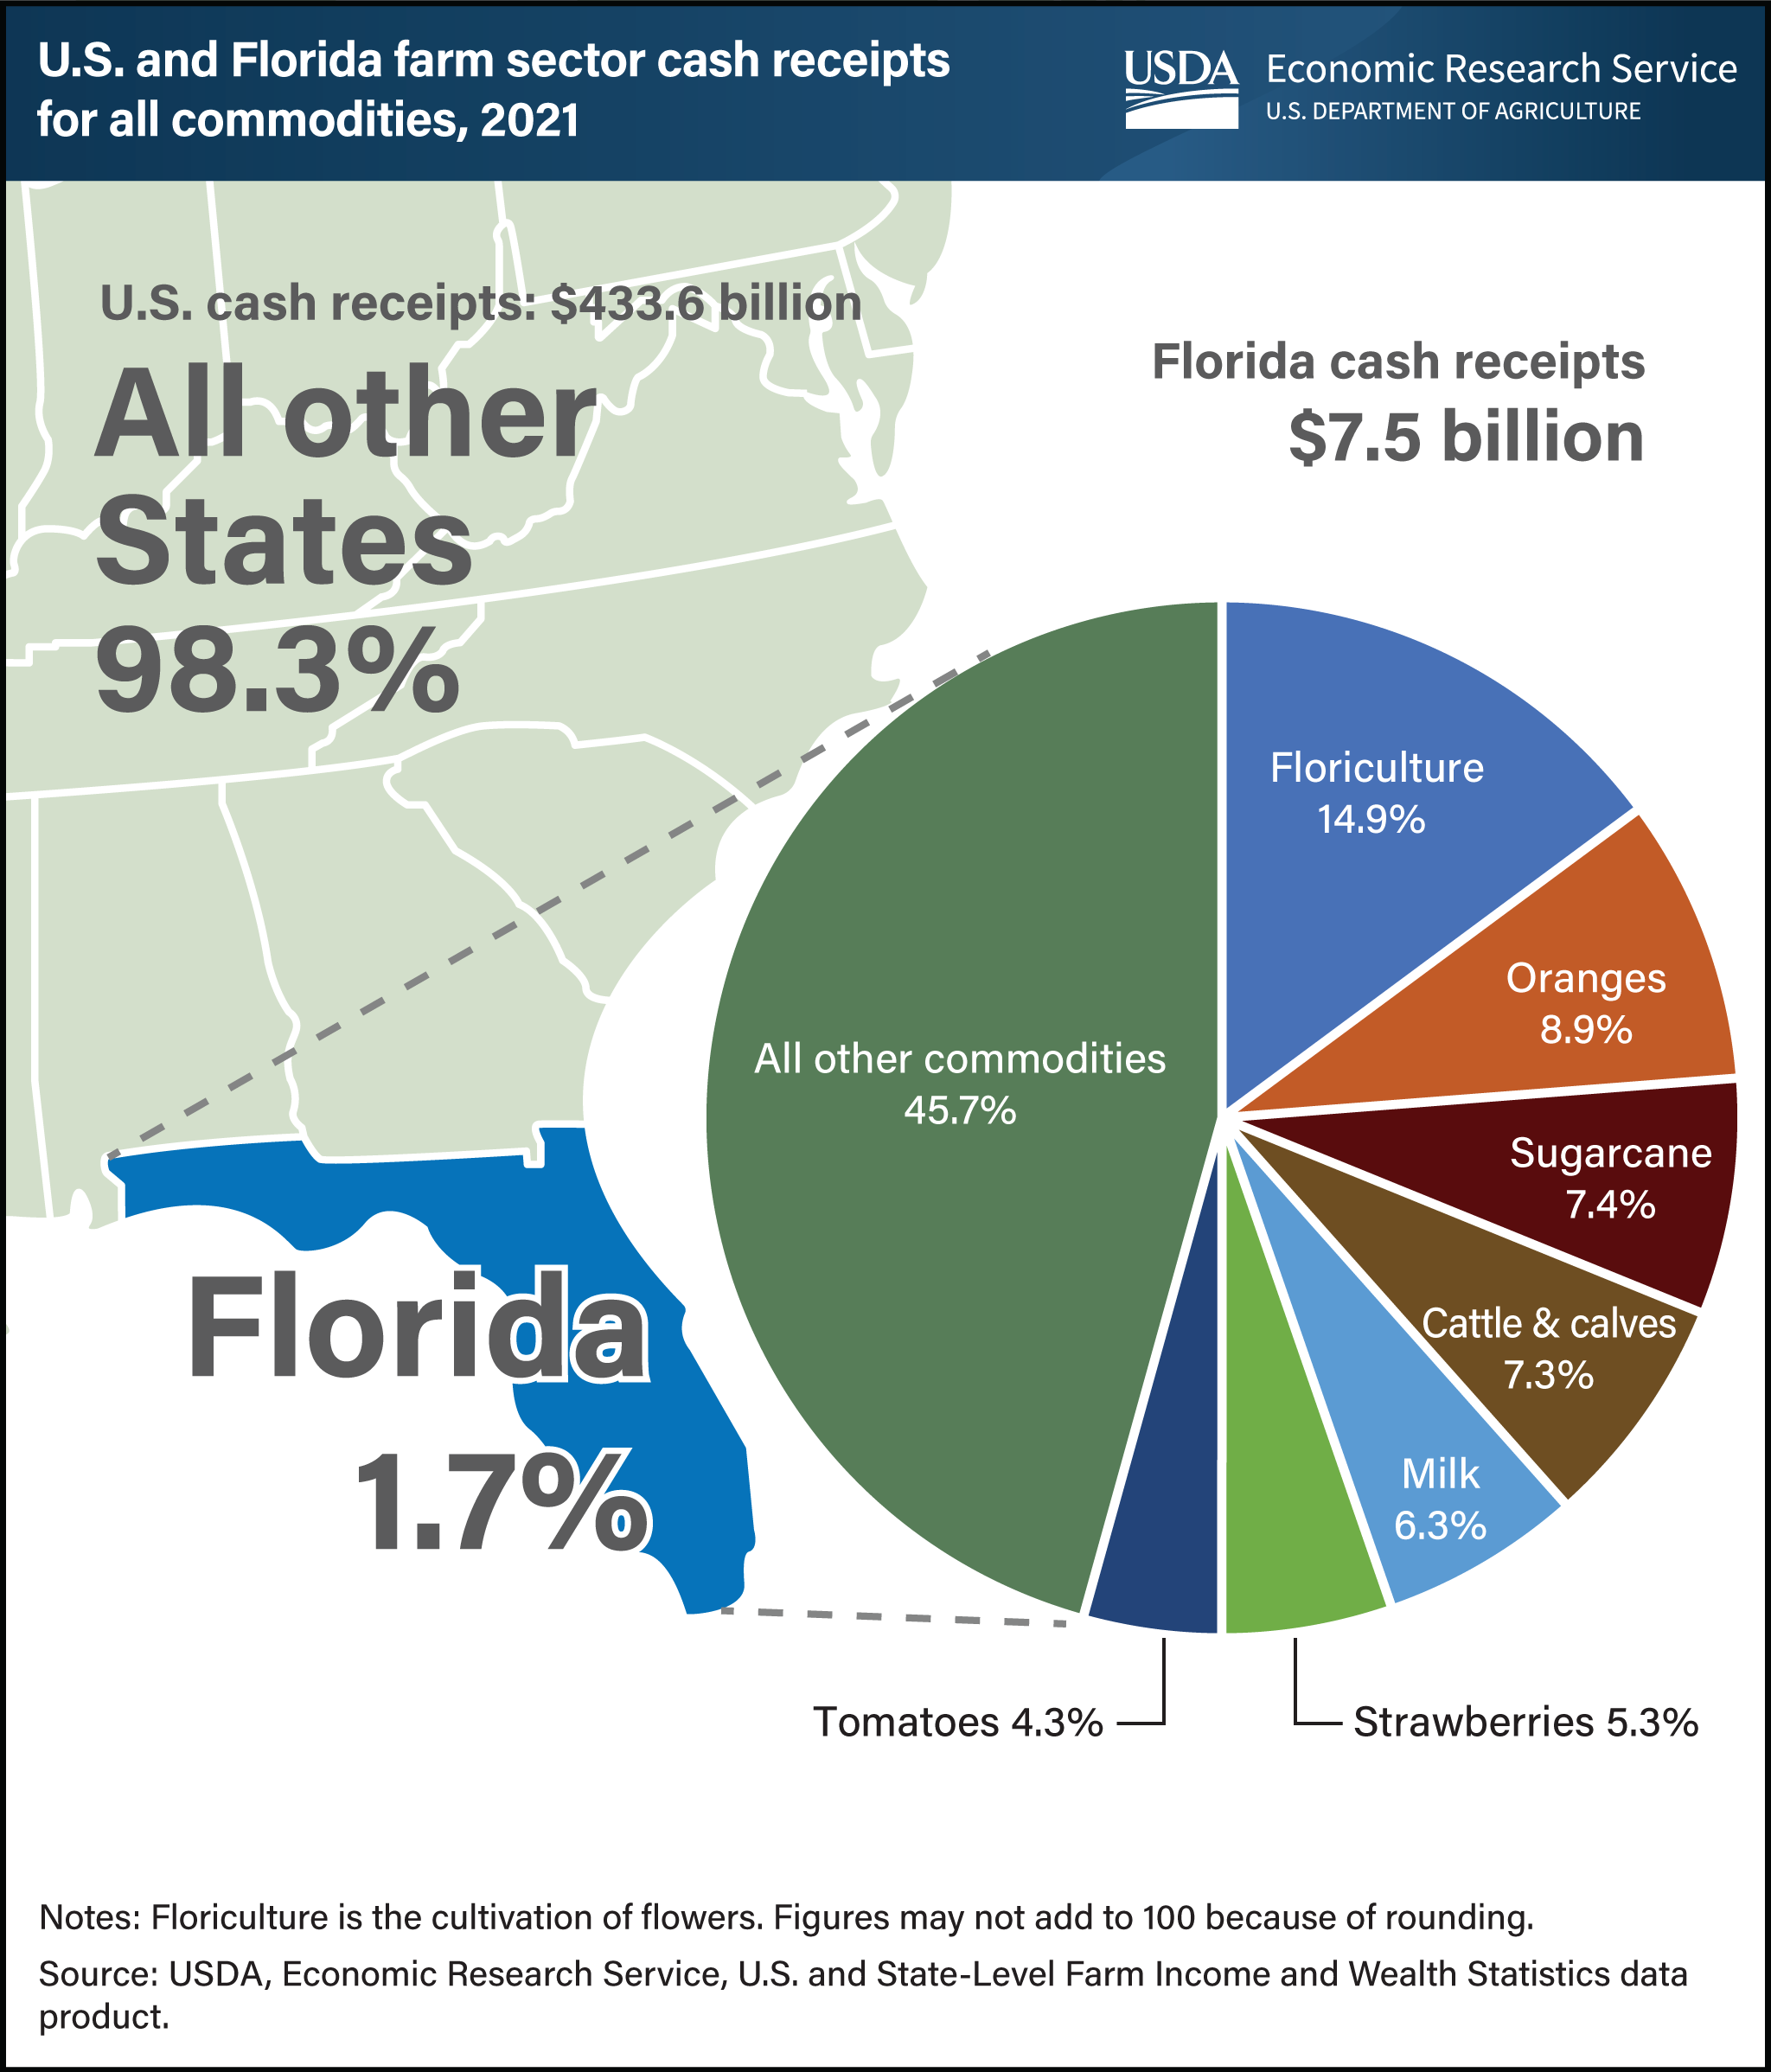
ERS and USDA resources covering recent hurricane impacts, as well as historical and background information reporters may find useful.
Hurricane Information
- Visit FEMA.gov to see how FEMA and the Department of Homeland Security are supporting disaster response and recovery.
- Visit USA.gov for comprehensive federal resources on hurricane preparedness, food assistance, agriculture, and more.
USDA Resources
- USDA Disaster Resources includes information on how USDA can assist those affected by recent hurricanes.
- USDA Hurricane Preparation and Recovery Commodity Guides includes hurricane preparation and recovery guidance and state-specific resource links for the most economically important agricultural commodities in the southeastern states.
State Fact Sheets
Background Information on Past Hurricane Impacts
Reports:
Charts of Note:


