ERS Charts of Note
Subscribe to get highlights from our current and past research, Monday through Friday, or see our privacy policy.
Get the latest charts via email, or on our mobile app for  and
and 
Thursday, November 10, 2016
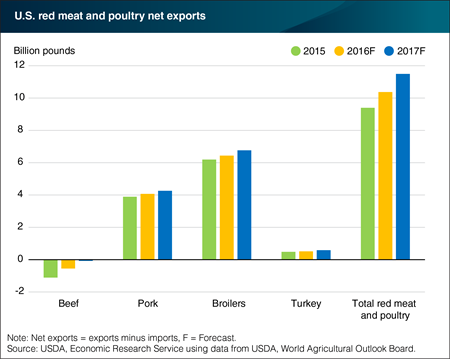
USDA forecasts for net exports (exports minus imports) of U.S. red meat and poultry in 2016 and 2017 show successive increases, largely due to higher beef production and expectations of solid growth in poultry exports. U.S. beef exports are expected to increase by almost 9 percent in 2016 and by almost 7 percent in 2017, as the beef sector recovers from a multi-year drought in major beef-producing States and U.S. production increases. U.S. beef imports are forecast to decline by about 10 percent in 2016 and 11 percent in 2017, as supplies in Oceania tighten with herd rebuilding and larger supplies of U.S. beef become available at lower prices. U.S. net poultry exports (broiler meat and turkey) are forecast to increase in both 2016 and 2017 reflecting higher production, lower prices, and strong foreign demand for relatively low-priced meat protein. In total, U.S. net exports of red meat and poultry are expected to be 10.3 billion pounds in 2016 and 11.5 billion pounds in 2017. This chart appears in the ERS Livestock, Dairy, and Poultry Outlook report released in October 2016.
Monday, September 26, 2016
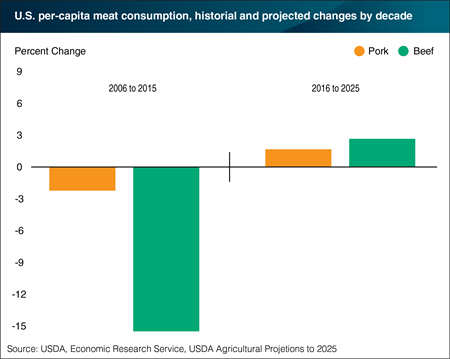
USDA baseline projections provide a long-term view of the U.S. farm sector. These projections show that production of beef and pork will expand steadily between 2016 and 2025, driven by lower feed costs and strong meat demand domestically and abroad. As a result of this greater production, beef and pork prices are projected to drop 10.6 percent and 11.6 percent, respectively, over the same period. Cheaper prices will help reverse a multiyear decline in meat consumption in the United States. Per capita consumption of beef is also forecast to increase 2.7 percent by 2025, outpacing growth in consumption of broilers (2.3 percent) and pork (1.7 percent). USDA expects this will increase the total amount of meat consumed per person in the U.S. from 211 pounds in 2015 to nearly 219 pounds by 2025. This chart appears in the ERS Amber Waves finding U.S. Beef and Pork Consumption Projected to Rebound released September 2016.
Wednesday, May 25, 2016
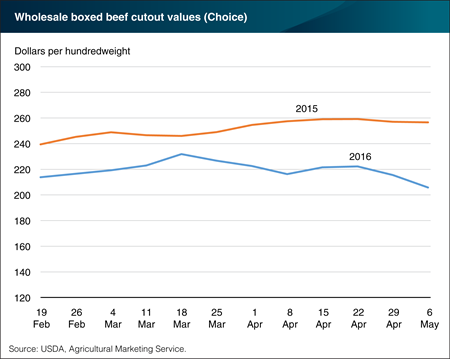
Memorial Day is the traditional start to the summer grilling season, and beef is one of the most popular grilling items. Conditions in the livestock markets have changed considerably over the past year and suggest lower beef prices through the summer months. Historically heavy slaughter weights coupled with larger-than-anticipated cattle slaughter volumes in late April and early May have driven beef supplies higher and pushed wholesale beef prices lower. At the same time, soft demand for ground beef products and the popular beef “middle meat” grilling items—such as ribeye and sirloin steaks—ahead of the grilling season has kept prices under pressure. The Choice cutout value—a common indicator of wholesale prices for beef graded as Choice—for the week ending May 6 was $205.72 per hundredweight/cwt, down nearly $17 from the first week of April and almost $51 lower than the same time last year when supplies were much tighter. These lower wholesale prices should translate to lower foodstore prices, but the degree to which retailers feature beef in June and July will depend on demand as well as the market conditions for pork and chicken. This chart is based on the Livestock, Dairy and Poultry Outlook report, released May 16, 2016.
Friday, April 8, 2016
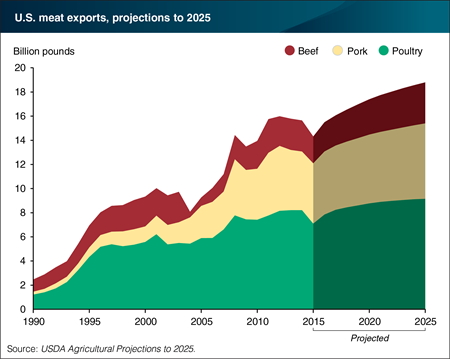
A strengthening U.S. dollar coupled with poultry trade restrictions related to highly pathogenic avian influenza (HPAI) led to a reduction in U.S. meat and poultry exports in 2015. However, U.S. red meat and poultry exports are expected to rise over the next decade as steady global economic growth supports demand for high-quality animal proteins. Poultry is the largest U.S. meat export category, and broiler export growth is expected to resume over the next decade with strong near-term gains reflecting a rebound from HPAI-related import restrictions. China and Mexico are major US broiler export markets. U.S. pork exports are projected to continue rising, with Pacific Rim nations and Mexico among the key growth markets. U.S. beef exports are projected to grow as well, consisting mostly of high-quality, grain-fed beef shipped to Mexico, Canada, and Pacific Rim nations. This chart is from the interagency USDA report, USDA Agricultural Projections to 2025.
Friday, June 19, 2015
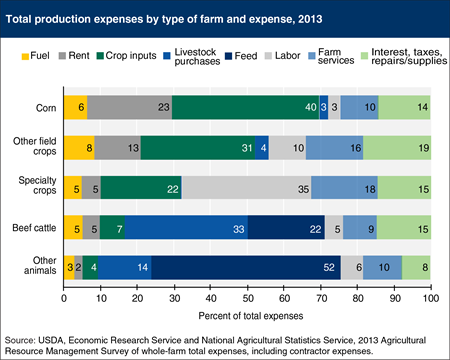
The variation in the percent of total expenses represented by individual expenses across different types of farms reflects how specialized U.S. agriculture has become. While wide differences generally exist between crop and livestock farms, USDA’s Agricultural Resource Management Survey (ARMS) allows a breakdown of expense shares within the major farm types. Livestock purchases are the largest component of total expenses for beef cattle farms, primarily because of the relatively high cost of feeder steers. Because of the lower cost of their animal purchases, feed expenses are the largest component of total expenses for other animal farms (primarily hog, poultry, and dairy). Specialty crop farms (fruit/nuts, vegetables, and nursery/greenhouse) have a higher share of labor expenses than field crop farms, because they occupy fewer acres and are less mechanized. In contrast, field crop farms, especially corn farms, have higher shares of expenses going to principal crop-related expenses (fertilizer, seeds, and chemicals), and rent. Fuel expenses are relatively consistent, varying between 3 percent of total expenses for other animal farms to 8 percent for other field crop farms. This chart is based on results from USDA’s ARMS Farm Financial and Crop Production Practices data.
Wednesday, January 28, 2015
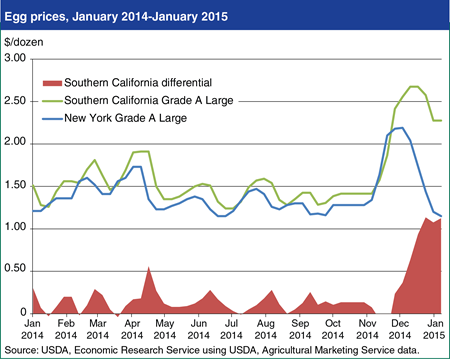
Over the last 2 months of 2014, egg prices in most markets experienced a brief and very sharp price spike. Egg prices traditionally are strong in the fourth quarter, but the spike in 2014 was larger than usual, considering that table egg production increased in November 2014. The high prices nationwide in the fourth quarter of 2014 are likely the result of both strong exports of table eggs to Mexico in November and uncertainties about the future of the table egg market in California due to new cage size regulations that went into effect on January 1, 2015. In the short term, the new regulations have widened the price difference between the California market and other parts of the United States. At the end of October 2014, the difference between the wholesale prices of Grade A large eggs in the Southern California market and the New York City market was around 12 cents per dozen. Prices in Southern California rose to average $2.68 per dozen by the middle of December. Like in other markets, prices then began to decline, but by the beginning of 2015 had only fallen to around $2.28 per dozen, resulting in a price differential between the Southern California market and the New York City market of over $1.00 per dozen. This chart is based on information from the report, Livestock, Dairy and Poultry Outlook: January 2015.
Monday, November 17, 2014
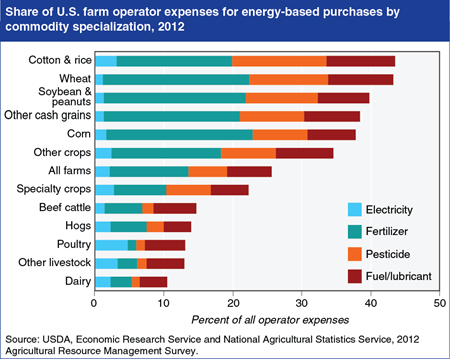
Agricultural businesses, particularly those specializing in crop production, are heavy users of energy and energy-intensive inputs. Ignoring the energy embodied in purchased machinery and services, energy-based purchases accounted for over 25 percent of farm operator expenses in 2012, on average. U.S. farm businesses are classified as industrial users of electricity; poultry production has the highest share of electricity expenses (5 percent) among all types of agricultural producers, while cotton and rice producers have the highest share of electricity expenses (3 percent) among crop producers, primarily for irrigation. While motor fuel accounts for about 6 percent of operator expenses, the farm sector is a heavy indirect consumer of natural gas. For example, up to 80 percent of the manufacturing cost of fertilizer can be for natural gas. Expenditures for fertilizer were over 11 percent of total operator expenses among farm businesses in 2012, with much higher expenditures for most crop farms. Natural gas as a source of electric power has been increasing in recent years, reaching 27 percent of electricity generation in 2013. As a result, the farm sector is particularly sensitive to fluctuations in the price of natural gas. This chart is found in the September 2014 Amber Waves data feature, "Agricultural Energy Use and the Proposed Clean Power Plan."
Monday, June 24, 2013
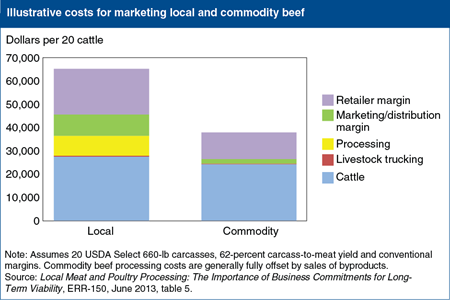
Locally produced and processed beef—defined as product marketed direct-to-consumer or direct-to-restaurant/grocer within 400 miles of its origin—is a small, but growing segment of the U.S. beef market. Evidence indicates that firms marketing local beef face substantially higher costs, particularly processing and marketing costs, than the large-scale sellers of conventional commodity beef. Local beef producers are typically unable to access the facilities of large commodity beef processors, and are unable to offset processing costs with byproduct sales to the same extent as commodity processors. Small, fee-for-service processors lack the scale to refine and effectively market byproducts, generate relatively little from byproduct sales and, therefore, have higher net processing costs. Local beef purveyors also face higher marketing and distribution costs than larger, vertically integrated processors of commodity beef. This chart is based on table 5 in Local Meat and Poultry Processing: The Importance of Business Commitments for Long-Term Viability, ERR-150, June 2013.
Tuesday, February 5, 2013
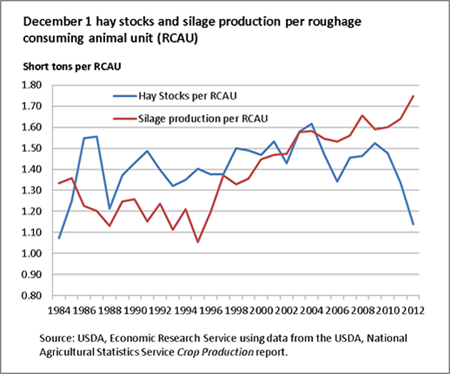
Stocks of all U.S. hay stored on farms totaled 76.5 million tons on December 1, 2012, down sharply from a year ago because of the effects of the 2012 U.S. drought. When measured relative to the demand for hay, by converting livestock inventories into roughage consuming animal units (RCAU), 2012 hay stocks were the lowest since 1984. The drought-reduced 2012 commercial hay harvest, coupled with diminished availability of forage on pasturelands, led to the drawdown of onfarm hay stocks. The decline in hay supplies is partially compensated by record production of silage, as growers facing poor grain yields chose to convert their corn and sorghum crops to silage. Also, to assist livestock producers affected by the prolonged drought of 2012, a record 2.8 million acres of Conservation Reserve Program (CRP) land was opened to haying and grazing. This chart appears in Feed Outlook, FDS-13a, January 2013.
Tuesday, October 16, 2012
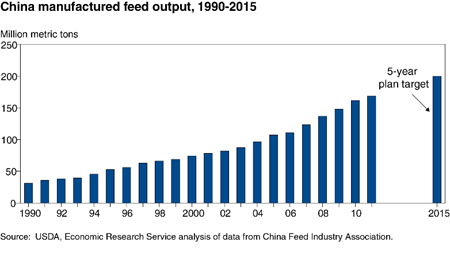
China imports distillers dried grain with solubles, a co-product from corn-based ethanol production, for use by commercial feed compounders who combine various ingredients to meet the nutritional needs of livestock at minimum cost. Traditionally, Chinese animals and poultry were fed household and processing wastes, crop byproducts, vines, tubers and forages, but the use of feed grains, oilseed meals, and feed additives has increased rapidly since the 1980s. China's commercial feed production rose from under 36 million metric tons in 1991 to 169 million metric tons in 2011. China's 5-year plan anticipates that commercial feed production will grow to 200 million metric tons in 2015. The projected annual increase of 4.7 percent is much faster than the projected growth in livestock and poultry output. This rapid growth reflects a shift from traditional feed sources to commercial feed in China's livestock industry. This chart is found in China's Market for Distillers Dried Grains and the Key Influences on Its Longer Run Potential, FDS-12g-01, August 2012.
Monday, July 23, 2012
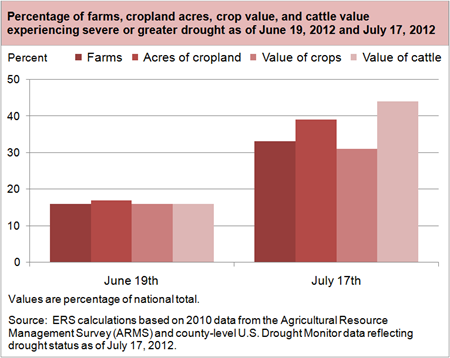
The 2012 drought in the U.S. is more extensive than any drought since the 1950's. A striking aspect of the drought is how rapidly it has increased in severity in early July, which is a critical time for crop development. This chart shows the growth in severe or greater drought within the agricultural sector between mid-June and mid-July. The share of farms under severe or greater drought increased from 16 percent of all farms to 33 percent. Total cropland under severe or greater drought increased from 17 percent to 39 percent, while the total value of crops and the total value of cattle exposed increased from 16 to 31 percent and 16 to 44 percent, respectively. For more information on the drought, visit U.S. Drought 2012-13: Farm and Food Impacts information page in the ERS Newsroom.
Monday, January 9, 2012
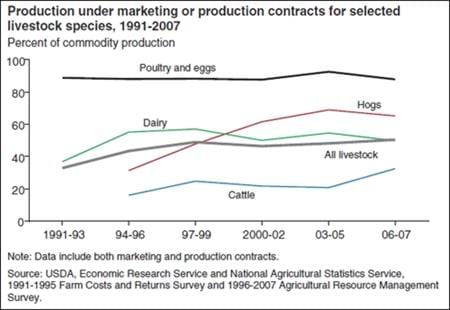
For farmers, contracts offer two main advantages. First, farmers can use marketing or production contracts to ensure outlets for their commodities, especially in thin markets or in markets for perishable products. Second, contracts can reduce production and price risks. Although the share of aggregate farm production under contract has stabilized at around 40 percent, the aggregate data mask large changes for specific commodities or commodity groups. In particular, the share of livestock production under contract grew from 33 percent in 1991-93 to 50 percent in 2006-07, led by hogs and cattle under production contracts. Production under contract was more stable for dairy production (mostly marketing contracts) and poultry and egg production (generally production contracts). This chart is found in the ERS report, The Changing Organization of U.S. Farming, EIB-88, December 2011.
Monday, November 28, 2011
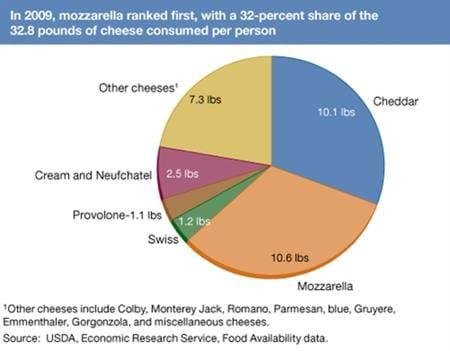
In 2009, U.S. cheese availability (a proxy for consumption) stood at 32.8 pounds per person. Mozzarella edged out cheddar as America's favorite cheese, with the two cheeses together accounting for 63 percent of cheese availability in 2009. Per capita cheese availability has almost tripled since 1970, when it was 11.4 pounds per person. Cheese owes much of its growth to the spread of Italian and Mexican eateries in the U.S. and to innovative, convenient packaging, such as shredded cheese for recipes and string cheese for lunch boxes. This chart appeared in the December 2011 issue of Amber Waves magazine. More information can be found in the Food Availability (Per Capita) Data System on the ERS website.
Friday, November 18, 2011
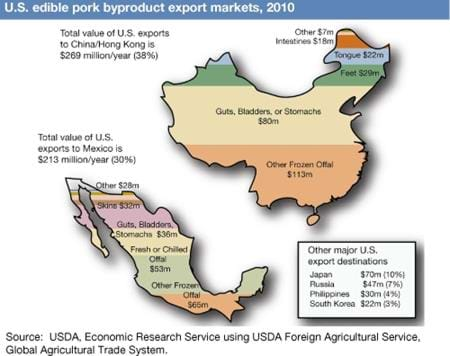
U.S. pork byproduct exports totaled $700 million in 2010, almost 15 percent of the total value of U.S. pork exports. Fresh or chilled offal is the leading edible byproduct export (13 percent). Other exports include hog feet (11 percent), rinds (8 percent), guts, bladders, and stomachs (8 percent), frozen intestines (7 percent) and all other frozen pork offal (45 percent). China and Mexico accounted for 68 percent of U.S. edible pork byproduct exports in 2010. In foreign markets, demand for U.S. edible offal is high because of its superior quality and low prices relative to domestic products. This chart appears in the December 2011 issue of Amber Waves magazine.
Wednesday, October 26, 2011
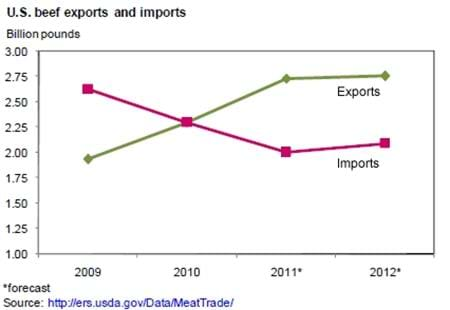
As of October, total U.S. beef exports are forecast at over 2.73 billion pounds in 2011, up nearly 19 percent over 2010. Beef exports in 2012 are forecast slightly higher, at 2.76 billion pounds. Growth in beef exports to several major U.S. beef export markets continues to be strong. Through August, exports to South Korea and Japan were 50 and 38 percent higher than a year earlier, respectively. Exports to Russia have continued to outpace year-earlier levels through August (up 72 percent), placing the United States behind Paraguay as the sixth largest exporting country of beef to Russia thus far in the year. U.S. beef imports for 2011 are forecast at 2 billion pounds-a year-over-year decline of almost 13 percent. Tightened exports to the United States from Oceania, in part a function of the exchange rate, continue to constrain U.S. import totals. This chart if from the October 18, 2011 Livestock, Dairy, and Poultry Outlook, LDP-M-208.
Friday, October 14, 2011
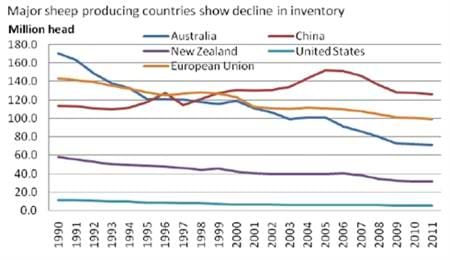
Though global sheep numbers have remained fairly stable since 1960, with inventories remaining close to 1.1 billion throughout the period, sheep numbers in some of the major sheep-consuming and export-oriented producing countries declined steadily. Australia and New Zealand, the largest exporters of lamb and mutton globally, have seen drastic declines, with inventories falling by 17 and 18 percent, respectively, in the last 5 years. The European Union (EU) and the United States-major consumers of high-value lamb-have seen declines in their sheep numbers as well. Much of the decline in these countries' sheep inventories stems from an underlying long-run decline in demand for raw wool and low returns for wool relative to returns from prime lamb production and other farm enterprises. This chart comes from Livestock, Dairy, and Poultry Outlook, LDP-M-207, September 16, 2011.


