ERS Charts of Note
Subscribe to get highlights from our current and past research, Monday through Friday, or see our privacy policy.
Get the latest charts via email, or on our mobile app for  and
and 
Monday, July 2, 2012
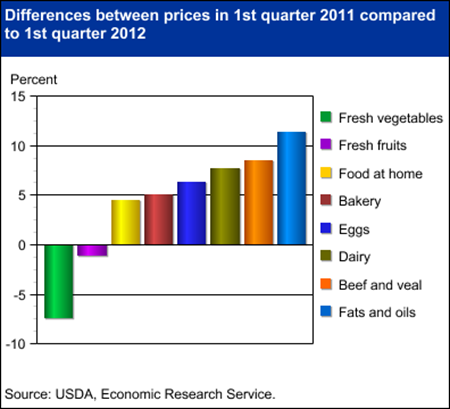
For most food categories and for food at home in general, prices in the first quarter of 2012 were higher than they were a year ago. Consumers faced 4.5 percent higher food prices on average at the grocery store in January-March 2012, compared to January-March 2011. Fats and oils prices were 11.3 percent higher in first quarter 2012 versus first quarter 2011, and beef prices were 8.5 percent higher. However, the warm 2011-12 winter and favorable growing conditions resulted in a year-over-year decrease in produce prices for the first quarter of 2012, with fruit prices down 1.1 percent and vegetable prices down 7.4 percent. More information on food price changes and forecasts can be found in the Food Price Outlook data product on the ERS website, updated June 25, 2012.
Tuesday, August 2, 2011
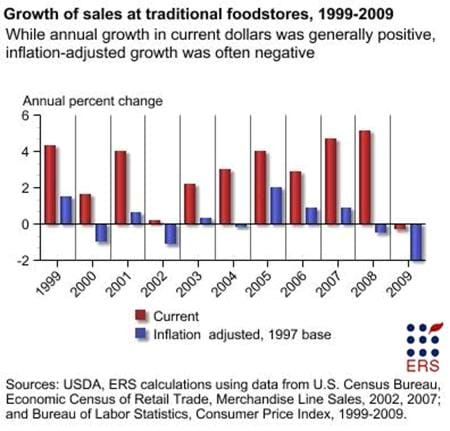
During the past decade, there were many years in which grocery store sales growth (in current dollars) exceeded the rate of inflation. In 2008 and 2009-a period of recession and economic uncertainty-traditional grocery retailers experienced negative inflation-adjusted growth. The slow and negative inflation-adjusted growth in annual sales at traditional grocery stores was likely due in part to increased competition from nontraditional food retailers-such as warehouse clubs, supercenters, drugstores, and other retailers-as more consumers economized on food spending. This chart is from the Food Marketing System in the U.S. briefing room on the ERS website, updated in November 2010.
Thursday, July 28, 2011
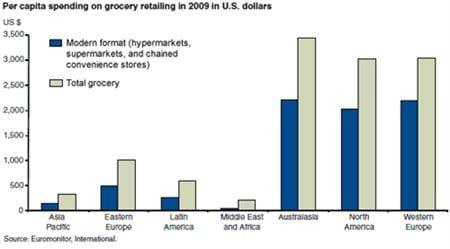
Though modern formats-hypermarkets, supermarkets, and chained convenience stores-are proliferating in developing countries, the developed world continues to have the largest per capita market for both total grocery expenditures and total grocery sales in modern formats. Per capita expenditures in North America (excluding Mexico), Western Europe, and Australasia (Australia and New Zealand) dwarfed those of other regions in 2009; grocery expenditures were at least 3 times larger than in Eastern Europe and over 10 times larger than in Asia, the Middle East, and Africa. These regional differences widen for the share of grocery expenditures in modern formats. This graph comes from the ERS report, The Expansion of Modern Grocery Retailing and Trade in Developing Countries, ERR-122, July 2011.
Wednesday, July 13, 2011
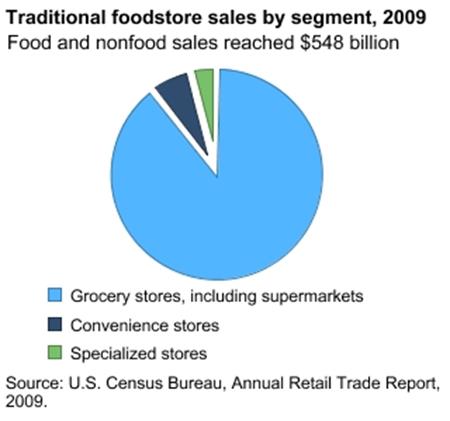
Traditional foodstores in the U.S. sold $548 billion of retail food and nonfood products in 2009. Grocery stores, including supermarkets, accounted for the largest share of foodstore sales (89.6 percent), followed by convenience stores without gasoline (6.4 percent). Specialized foodstores, including meat and seafood markets, produce markets, retail bakeries, and candy and nut stores, accounted for the remaining 4 percent of the total. This chart is from the Food Marketing System in the U.S. briefing room on the ERS website, updated in November 2010.
Friday, July 8, 2011
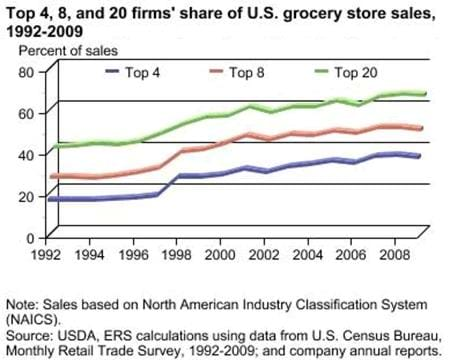
U.S. sales by the 20 largest food retailers totaled $404.2 billion in 2009, amounting to 64.2 percent of U.S. grocery store sales, an increase from 39.2 percent in 1992. Although shares held by the largest 4, 8, and 20 supermarket and supercenter retailers decreased slightly from 2008 to 2009, the longer term trend shows an increasing concentration of sales among the Nation's largest grocery retailers. Contributing factors to these increases over the past decade include mergers and acquisitions among food retailers and the rapid growth of Wal-Mart supercenters. This chart is from ERS's Food Marketing System in the U.S. briefing room, November 2010.
Monday, May 23, 2011
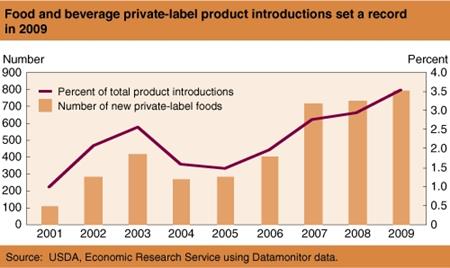
In 2009, a record-setting 810 new private-label (store brand) foods appeared on retail shelves-7 times more than in 2001. Private-label foods ranked fourth among new product claims in 2009, accounting for 3.6 percent of all new product claims-ahead of "high vitamin," "low or no trans fat," "quick," "no preservatives," and "organic." This chart appeared in the June 2010 issue of Amber Waves.
Friday, May 13, 2011
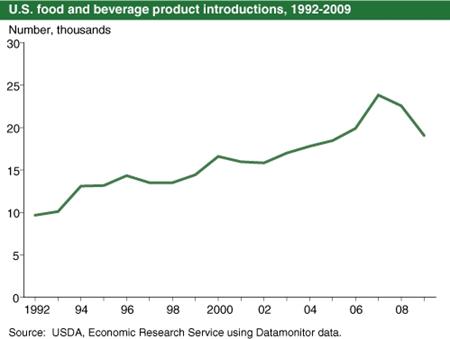
U.S. food and beverage product introductions increased for most of the last decade and a half. Product introductions include new varieties or package sizes of existing items, as well as new products. A record 24,236 new products were introduced in 2007. In 2009, however, U.S. food and beverage product introductions fell by 3,519 to 19,047, the second consecutive yearly reduction and the largest in at least 15 years. Among the top 10 new product tags or claims, "premium" and "organic" experienced the largest declines, while private label product introductions set a new record in 2009. This chart originally appeared in the June 2010 issue of Amber Waves magazine.
Wednesday, June 12, 2019
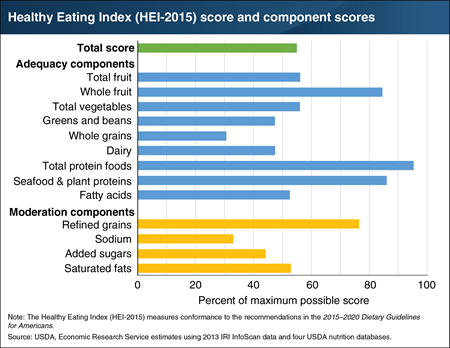
Newly established links between retail food sales data and USDA nutrition databases now allow researchers to study the healthfulness of Americans’ purchases at retail stores. ERS researchers scored the healthfulness of retail food sales using the Healthy Eating Index (HEI-2015), a measure that summarizes how well a set of foods conforms to the recommendations in the 2015–2020 Dietary Guidelines for Americans, developed jointly by the Department of Health and Human Services and the Department of Agriculture. In the Healthy Eating Index, the maximum possible score is 100, indicating conformance to Federal recommendations for 13 dietary components encompassing food groups (fruit, dairy, whole grains) and dietary elements (added sugars, fatty acids, sodium). For the nine adequacy components that make up a healthy diet, a high score indicates Americans are purchasing a sufficient amount of foods in these groups. A high score among the four components that nutritionists advise to consume in moderation indicates Americans are keeping purchases of foods containing these components in check. In total, retail food sales in 2013 scored 55, suggesting purchases are not well aligned with Federal dietary recommendations. Scores for whole grains, greens and beans, dairy, sodium, and added sugars were each below 50 percent of their maximum possible scores. This chart appears in the article “New Data Linkages Provide Healthfulness Measures for American Grocery Store Sales” from the June 2019 edition of ERS’s Amber Waves magazine.


