ERS Charts of Note
Subscribe to get highlights from our current and past research, Monday through Friday, or see our privacy policy.
Get the latest charts via email, or on our mobile app for  and
and 
Friday, May 6, 2016
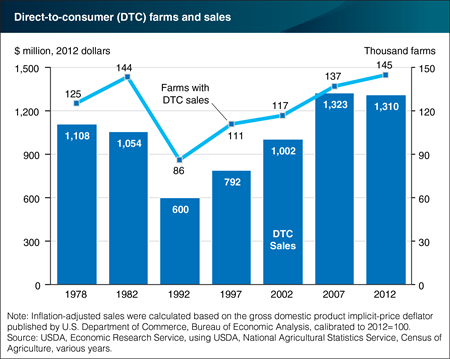
Data on direct-to-consumer (DTC) food sales were first collected in the 1978 Census of Agriculture, and DTC sales data have been collected in every agricultural census thereafter (except in 1987). In 1992, the number of DTC farms fell to the lowest level since information collection on DTC farms began; since that time, the number has slowly and steadily increased, peaking in 2012. The constant-dollar value of DTC sales increased as well, before declining slightly in 2012. Two factors may have contributed to the lack of growth in DTC sales over 2007-12. First, consumer demand for local food purchased through DTC outlets may have plateaued. Second, where local food systems have been thriving, farmers may have been able to direct more of their sales to “intermediated” outlets, such as local restaurants and retailers, institutions, and local aggregators. ERS research finds that the number of farms marketing through intermediated channels increased by 34 percent from 36,000 in 2008 to 48,300 in 2012 (not shown in graph). This chart updates one found in the ERS report, Direct and Intermediated Marketing of Local Foods in the United States, November 2011, and draws on information from Trends in U.S. Local and Regional Food Systems: A Report to Congress, January 2015.
Tuesday, April 19, 2016
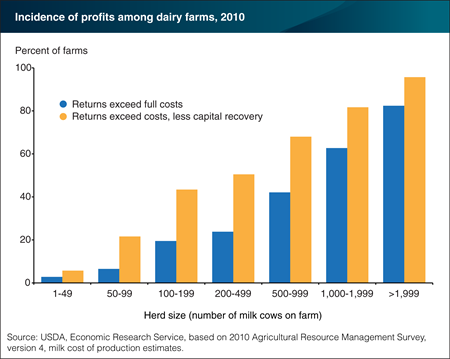
While some small U.S. dairy farms earn profits and some large farms incur losses, financial performance in the dairy sector, on average, is linked to herd size. Data from 2010 (the latest available for dairy farms by herd size) show that a majority of dairy farms with milking herds of at least 1,000 cows generate gross returns that exceed total costs, while most small and mid-size dairy farms do not earn enough to cover total costs. Total costs include annualized capital recovery as well as the cost of unpaid family labor (measured as what the farm family could earn off the farm), in addition to cash operating expenses. Many more small and mid-sized farms are able to cover total costs, except for costs associated with capital recovery. Farms can operate in this way for years, covering operating expenses and providing a reasonable income for a farm family, until the expense of maintaining aging equipment and structures begins to erode the incomes that a family can earn from the farm. At that point, many families may decide to close the farm. Some—particularly those where a younger generation intends to continue the business—may seek financing to expand the dairy herd and realize lower costs through scale economies. This chart is found in the ERS report,
Thursday, April 7, 2016
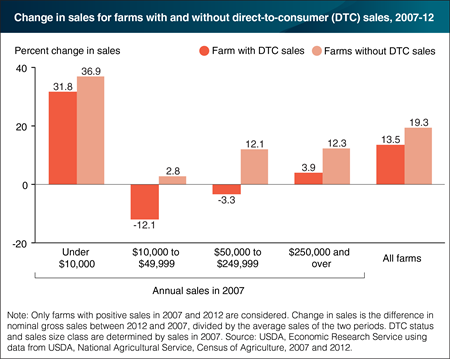
Between 2007 and 2012, farms using direct-to-consumer (DTC) marketing had smaller growth in nominal gross sales (13.5 percent), on average, than farms using traditional marketing channels (19.3 percent). In addition, gross sales on farms using DTC marketing grew more slowly in each size class (as measured by 2007 sales). The slower growth for farms with DTC sales may stem from several factors. The 2012 Census of Agriculture shows farms using DTC marketing employ substantially more labor across all sales categories than farms without direct sales. Therefore, farms with DTC sales may need to hire additional workers at a lower scale of production, and the associated transaction costs may provide an obstacle to growth. Off-farm income opportunity may also play a role, as farms with DTC sales are more likely to have total household incomes both less than $50,000, and less than $20,000. The lower total household income for farms with DTC sales may reflect fewer off-farm income opportunities, leading these farms to continue farming even if they have less ability to expand production. This chart is found in the March 2016 Amber Waves feature, “Local Foods and Farm Business Survival and Growth.”
Thursday, March 24, 2016
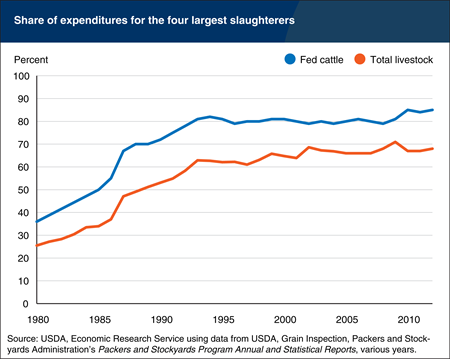
Concentration levels in many U.S. agricultural markets have risen in recent decades, resulting in fewer buyers accounting for a growing share of purchases of agricultural commodities. This is particularly true for livestock markets. The four largest packers now account for nearly 70 percent of the value of all livestock purchased for slaughter, compared to 26 percent in 1980. For fed cattle, the concentration level is even higher, as the share of the top four firms increased from 36 percent to 85 percent between 1980 and 2012. This chart is from the ERS report, Thinning Markets in U.S. Agriculture: What are the Implications for Producers and Processors?
Friday, March 11, 2016
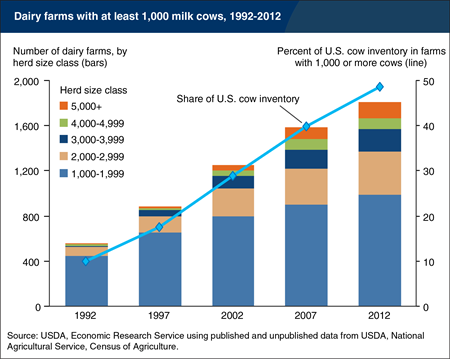
Two decades ago, most milk came from farms with fewer than 150 cows, on which a farm family handled milking, herd management, and crop production for feed. Today, while the United States still has many herds of 50 to 100 cows, most cows and milk production have moved to much larger farms, which are usually still owned and operated by families, but rely on hired labor for most farm tasks. Farms with milking herds of at least 1,000 cows accounted for nearly half of all cows in 2012, up from 10 percent of all cows in 1992. Producers continued to increase herd size in that period; there were 17 farms with herds of 4,000 or more cows in 1992, compared to 95 farms in 2002 and 234 in 2012. Costs are an important reason behind the shift, as production costs appear to be substantially lower, on average, on larger farms. The data underlying this chart are available in the ERS report, Changing Structure, Financial Risks, and Government Policy for the U.S. Dairy Industry, March 2016.
Tuesday, March 8, 2016
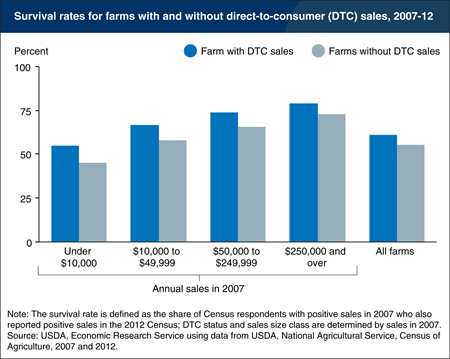
Direct-to-consumer (DTC) marketing—where producers engage with consumers face-to-face at roadside stands, farmers’ markets, pick-your-own farms, onfarm stores, and community-supported agricultural arrangements (CSAs)—brings benefits for consumers as well as the farm businesses. According to Census of Agriculture data, farmers who market food directly to consumers had a greater chance of remaining in business than those who market through traditional channels. Sixty-one percent of farms with DTC sales in 2007 were in business under the same operator in 2012, compared with 55.7 percent of all U.S. farms. Based on a comparison of farms across four size categories (defined by annual sales), farmers with DTC sales had a higher survival rate (measured as the share of farmers who reported positive sales in 2007 and 2012) in each category. The differences in survival rates were substantial—ranging from 10 percentage points for the smallest farms to about 6 percentage points for the largest. This chart is found in the March 2016 Amber Waves feature, “Local Foods and Farm Business Survival and Growth.”
Wednesday, February 24, 2016
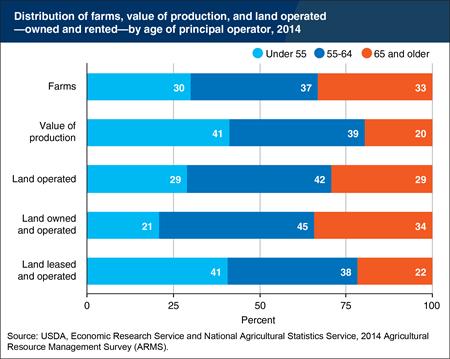
The average age of principal operators in the latest Census of Agriculture (2012) was 58 and has been greater than 50 since the 1959 Census. That farmers are older, on average, than other self-employed workers is understandable, given that the farm is the home for most farmers, and they can gradually phase out of farming over a decade or more. While older (age 65+) farmers make up a third of all farm operators, they account for a much smaller share (20 percent) of production. Nevertheless, older farmers still operate on 29 percent of all U.S. farmland (on land owned or leased, slightly less than their share of all farms). The largest portion of owned farmland is held by producers age 55-64; operators over 55 tend to own the land they farm, while younger operators are more likely to lease it. Older farmers’ land will shift to existing or new farms—or go into nonagricultural uses—as they exit agriculture. This chart is based on the information found in the Farm Structure and Organization topic page.
Friday, February 19, 2016
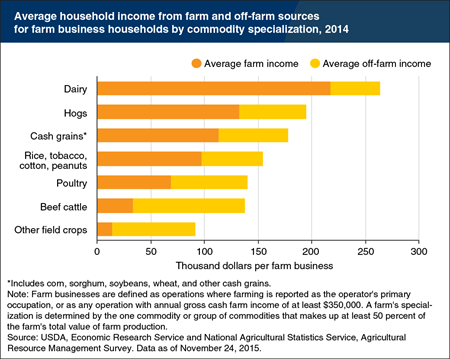
On average, households associated with farm businesses supplement farm income with income from off-farm sources. However, across different types of farm operations, the extent that off-farm income supplements farm income varies considerably. For example, with its extensive and ongoing time demands, managing a dairy farm rarely permits an operator to work many hours off-farm and is a main reason why farm income constitutes over four-fifths of these households’ total income. In 2014, households with farm businesses specializing in dairy and hogs had the highest average total household income (combining income from farm and off-farm sources), and the highest shares of household income derived from farming, followed by farms specializing in cash grains (corn, soybeans, sorghum, or wheat). Farm households with businesses specializing in beef cattle, other field crops, and poultry had the largest shares of average household income derived from off-farm activities. This chart is a variation of one found in the Farm Household Well-being topic page, and based on data available in ARMS Farm Financial and Crop Production Practices.
Friday, January 8, 2016
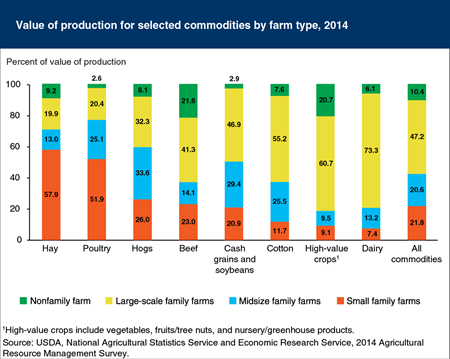
In 2014, 99 percent of U.S. farms were family farms, where the principal operator and his or her relatives owned the majority of the business. Most of U.S. farm production—68 percent—occurred on the 9 percent of farms classified as midsize or large-scale family farms having at least $350,000 in annual gross cash farm income (GCFI). Those farms together accounted for most production of dairy (87 percent of production), cotton (81 percent), and cash grains/soybeans (76 percent). Large-scale family farms alone (those with annual GCFI of $1 million or more) produced 73 percent of dairy output in 2014. Although small family farms (with less than $350,000 annual GCFI) accounted for 90 percent of U.S. farms, they contributed just 22 percent to U.S. farm production. Among some commodity specializations, though, small family farms account for a much higher share of production, accounting for over half of poultry output (mostly under production contracts) and hay. Non-family farms accounted for 10.4 percent of all production, but were most prominent in high-value crops and beef (through operating feedlots). This chart is found in America’s Diverse Family Farms: 2015 Edition, released in December 2015.
Thursday, December 10, 2015
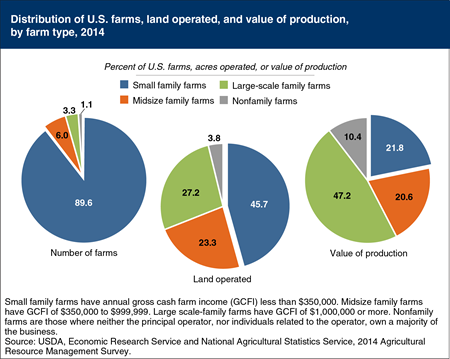
In 2014, 99 percent of U.S. farms were family farms, where the principal operator and his or her relatives owned the majority of the business. Most were small family farms, having less than $350,000 in annual gross cash farm income (GCFI)—which includes commodity cash receipts, other farm-related income (such as receipts from custom work or production contract fees), and government payments. In 2014, these small family farms accounted for 90 percent of all U.S. farms, 46 percent of the land operated by farms, and 22 percent of agricultural production. Large-scale family farms—with $1 million or more in annual GCFI—accounted for about 3 percent of all farms, but had a disproportionately large share of the value of production (47 percent). This chart is found in America’s Diverse Family Farms: 2015 Edition, released December 2015.
Monday, October 26, 2015
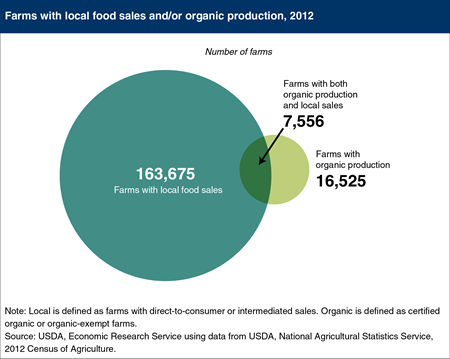
In 2012, fewer than 5 percent of farms with local food sales were organic farms (either certified organic, or certification-exempt farms because annual organic sales were under $5,000). However, nearly half (46 percent) of all organic farms sold food commodities through direct-to-consumer outlets (such as farmers’ markets and community supported agriculture arrangements), and/or through intermediated marketing channels (such as restaurants and retail outlets). Over the 2007-12 period, direct-to-consumer outlets continued to be the most frequently used local food marketing channel for selling organic—41 percent of organic farms used this marketing channel in 2007 versus 39 percent in 2012. Certification-exempt farms, which often tend to be very small and/or beginning farmers, are also more likely to rely on local markets. In 2012, they were twice as likely as certified organic farms to use direct-to-consumer outlets (63 percent versus 32 percent). This chart is found in Trends in U.S. Local and Regional Food Systems: A Report to Congress, January 2015.
Wednesday, October 7, 2015
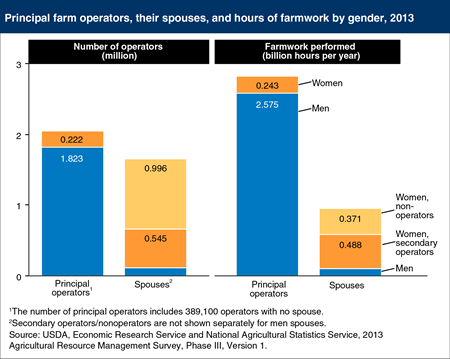
About 222,000 women are principal farm operators, or the person most responsible for making day-to-day decisions about the farm; 1.5 million women are spouses of principal operators. About one-third of these women spouses are secondary operators who work on the farm and participate in day-to-day decisions with their husband. The remaining women spouses do not make management decisions and are not farm operators. There are nearly one million of these nonoperator spouses, 46 percent of whom provide farm labor and collectively work 371 million hours on farms. Their labor amounts to 10 percent of the total hours worked on farms by principal operators and their spouses, and 34 percent of the total hours worked by female principal operators and spouses. The average hours of farm work—for persons reporting work hours—is substantial for women principal operators (1,097 hours per person per year), secondary operator spouses (895 hours/person/year), and nonoperator spouses (818 hours/person/year). Nonoperator women spouses contribute significant time to farm operations. This chart is an extension and update of information presented in the ERS report, Characteristics of Women Farm Operators and Their Farms, EIB-111, April 2013.
Friday, September 18, 2015
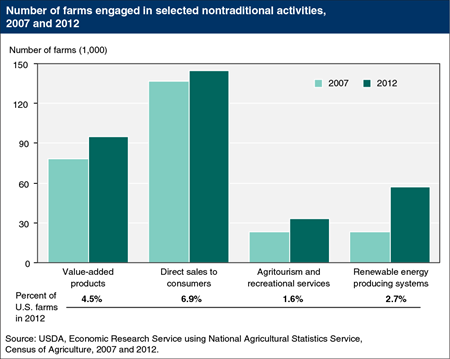
Nontraditional farm activities involve innovative uses of farm resources, such as growing/selling value-added products (such as fruit jams, preserves, cider, wine, floral arrangements, and beef jerky), selling directly to consumers, providing agritourism/recreational services, and using renewable energy producing systems (such as solar panels, wind turbines, and biodiesel). The number of farms engaged in these activities increased from 2007 to 2012, with the largest growth in farms with renewable energy producing systems. In 2012, about 57,000 U.S. farms produced renewable energy, more than double the number in 2007. By 2012, 63 percent of renewable energy producing farms had installed solar panels, which drives this increase. The number of farms that had income from agritourism/recreation increased over the 5-year period by 42 percent, with the largest increase in smaller agritourism farms with annual receipts under $5,000. In 2012, the top States in the share of farms producing and selling value-added products were Vermont (14 percent), New Hampshire (13 percent), and Maine and Rhode Island (with 11 percent each). This chart updates one from the ERS report, Farm Activities Associated With Rural Development Initiatives, ERR-134, May 2012.
Friday, August 7, 2015
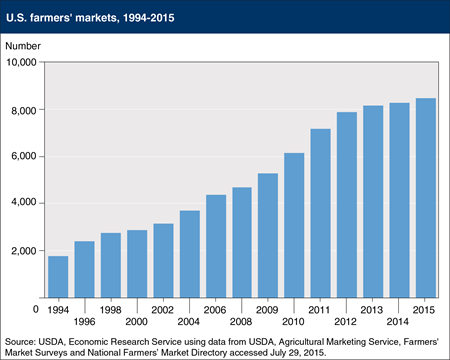
A farmers’ market is a common area where several farmers gather on a recurring basis to sell fresh produce and other farm products directly to consumers. The number of farmers’ markets rose to 8,476 in 2015, up from 2,863 in 2000 and 1,755 in 1994, according to USDA’s Agricultural Marketing Service. Farmers’ markets tend to be concentrated in densely populated areas of the Northeast, Midwest, and West Coast. Generally, farmers’ markets feature items from local food systems, although depending on the definition of “local,” some vendors may come from outside the local region, and some local vendors may not sell locally produced products. The growing number of farmers’ markets could reflect increased demand for local and regional food products based on consumer perceptions of their freshness and quality, support for the local economy, environmental benefits, or other perceived attributes relative to food from traditional marketing channels. This chart updates one found in the ERS report, Local Food Systems: Concepts, Impacts, and Issues, ERR-97, May 2010.
Tuesday, July 14, 2015
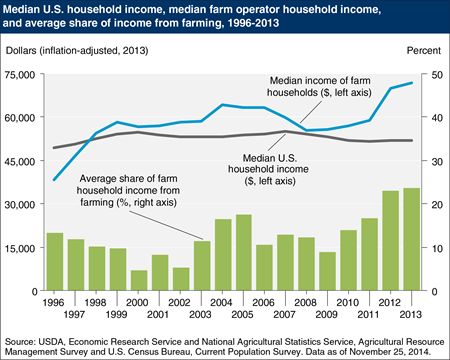
Since USDA’s Agricultural Resource Management Survey began collecting data in 1996, the median income of farm households has risen while real U.S. median household income has remained essentially flat. This may be due to a variety of factors, including farm consolidation, increasing commodity prices, and minimal increases in hourly wages for all U.S. workers. In 2013, the median household income of farm households was about $72,000, compared with $52,000 for all U.S. households. Farm households benefitted from high commodity prices in 2012 and 2013; however, many farm households experience considerable variability in their income from year-to-year compared with their non-farm counterparts. The share of farm household income from farming (shown in the green bars) varies, accounting for as little as 5 percent in the early 2000s and reaching a high of 24 percent in 2013. The importance of farm income to households also varies with the size of the operation. Households with smaller and intermediate size farms typically receive the majority of their income from off-farm sources, while large (commercial) farm households derive the bulk of total household income from their farm activities. The most recent ERS farm sector income forecast shows farm sector income for 2014 and 2015 returning to pre-2012 levels. Households operating large farms are the most vulnerable to decreases in farm income. This chart is based on data found in Farm Household Income and Characteristics and information found in the Farm Household Well-being topic page.
Friday, July 10, 2015
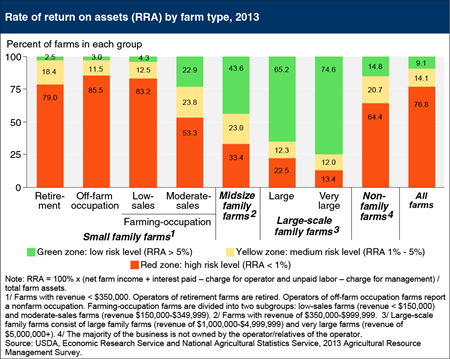
Profitability—measured here by the rate of return on assets (RRA)—is strongly associated with farm size. Seventy-nine to 86 percent of retirement, off-farm occupation, and low-sales farms are in the "red zone" (farms with an RRA of less than 1 percent), indicating a very low return to farming. The share of farms in the red zone drops rapidly for the remaining family farm types, those with moderate sales and higher. Likewise, the share of farms in the green zone—with a RRA greater than 5 percent—increases with farm size. Larger farms can often use their resources more productively than smaller farms, generating more dollars of sales per unit of capital. Given the high share of small farms in the red zone, many operators stay in business by undervaluing their labor, effectively ignoring the value of the unpaid labor they provide. Such small-farm households typically receive substantial off-farm income and do not rely primarily on their farms for their livelihood, often using off-farm income to cover farm expenses and make investments in their farm operations. This chart is found on the ERS topic page, Farm Structure and Organization, updated July 2015.
Friday, June 5, 2015
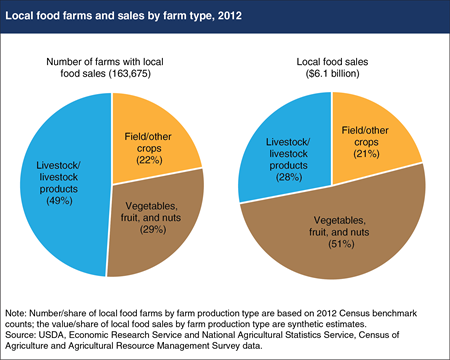
In 2012, 34 percent of all U.S. produce farms—those producing vegetables, fruit, or nuts—sold food through local food marketing channels, whereas only 3 percent of field/other crop farms and 8 percent of livestock/livestock product farms did so. The nearly 48,000 produce farmers with local sales in 2012 represented 29 percent of all local food farmers but generated $3.1 billion, or 51 percent of all local food sales. Farmers have two main channels through which to sell their food locally: directly to consumers (at farmers' markets, roadside stands, farm stores, etc.), and through intermediated marketing channels (defined to include sales to grocers, restaurants, schools, universities, hospitals, and regional distributors). Among local food farmers who elected to sell through direct-to-consumer outlets, intermediated marketing channels, or a mixture of both, produce farmers generated higher local food sales per farm than did field/other crop farms or livestock/livestock product farms. This suggests that opportunities to market locally are important to produce farmers, and their disproportionate presence (through local food sales) shapes the profile of a typical local food farm. This chart is found in the ERS report, Trends in U.S. Local and Regional Food Systems: Report to Congress, January 2015.
Friday, March 13, 2015
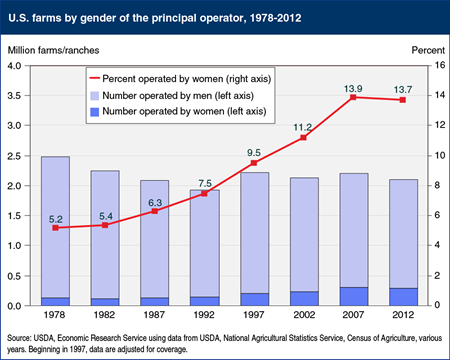
The share of U.S. farms operated by women nearly tripled over the past three decades, from 5 percent in 1978 to about 14 percent byThe share of U.S. farms operated by women nearly tripled over the past three decades, from 5 percent in 1978 to about 14 percent by 2012. Although there have always been women farm operators, national-level statistics to track their numbers and examine their characteristics were not available until the Census of Agriculture began asking for principal farm operators’ gender in 1978. 2012 marked the first census, however, in which the number (and share) of women-operated farms did not increase. The number of women-operated farms declined 6 percent between 2007 and 2012, similar to the 4-percent decline for men-operated farms. For both genders, most of the decline (about 75 percent) occurred in the smallest size category of farms (those with annual sales less than $1,000). Between the 1992 and 2007 censuses, the number of farms in this category increased substantially—in part because of increased efforts to find all small farms, including those operated by women. Fewer of these very small farms are overlooked now, resulting in more stable farm numbers. This chart updates one found in the ERS report, Characteristics of Women Farm Operators and Their Farms, EIB-111, April 2013. 2012. Although there have always been women farm operators, national-level statistics to track their numbers and examine their characteristics were not available until the Census of Agriculture began asking for principal farm operators? gender in 1978. 2012 marked the first census, however, in which the number (and share) of women-operated farms did not increase. The number of women-operated farms declined 6 percent between 2007 and 2012, similar to the 4-percent decline for men-operated farms. For both genders, most of the decline (about 75 percent) occurred in the smallest size category of farms (those with annual sales less than $1,000). Between the 1992 and 2007 censuses, the number of farms in this category increased substantially?in part because of increased efforts to find all small farms, including those operated by women. Fewer of these very small farms are overlooked now, resulting in more stable farm numbers. This chart updates one found in the ERS report, Characteristics of Women Farm Operators and Their Farms, EIB-111, April 2013.
Tuesday, February 17, 2015
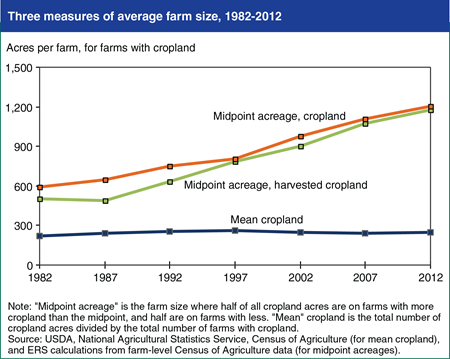
The average (mean) number of acres on crop farms has changed little over 3 decades, with a slight increase from 241 acres in 2007 to 251 in 2012. However, the mean misses an important element of changing farm structure; it has remained stable because while the number of mid-size crop farms has declined over several decades, farm numbers at the extremes (large and small) have grown. With only modest changes in total cropland and the total number of crop farms, the size of the average (mean) farm has changed little. However, commercial crop farms, which account for most U.S. cropland, have gotten larger, aided by technologies that allow a single farmer or farm family to farm more acres. The midpoint acreage (at which half of all cropland acres are on farms with more cropland than the midpoint, and half are on farms with less) effectively tracks cropland consolidation over time. The midpoint acreage of total and harvested cropland has increased over the last three decades, from roughly 500-600 acres in 1982 to about 1,200 acres in the most recent census of agriculture data (2012). This chart is extended through 2012 from one found in the ERS report, Farm Size and the Organization of U.S. Crop Farming, ERR-152, August 2013.
Tuesday, February 3, 2015
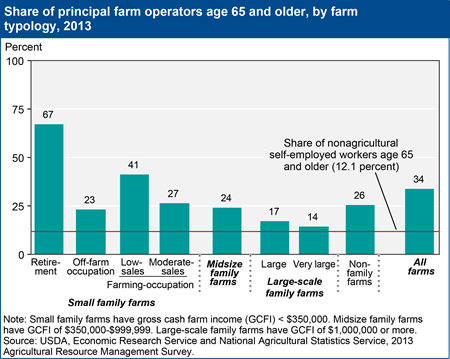
In 2013, roughly 34 percent of all U.S. principal farm operators were at least 65 years old, nearly 3 times the U.S. average share of older nonagricultural self-employed workers. Retirement farms had the highest percentage of older operators (67 percent)—as might be expected—followed by low-sales farms (41 percent). The advanced age of farm operators is understandable, given that the farm is the home for most farmers, and farmers can gradually phase out of farming over a decade or more. Improved health and advances in farm equipment also allow operators to farm later in life than in past generations. Principal operators of more commercially oriented farms—large farms with gross cash farm income (GCFI) of a million dollars or more—more closely resembled the nonagricultural self-employed workforce, with 14-17 percent age 65 and over. This chart updates one found in the ERS report brochure, America’s Diverse Family Farms, EIB-133, December 2014.


