ERS Charts of Note
Subscribe to get highlights from our current and past research, Monday through Friday, or see our privacy policy.
Get the latest charts via email, or on our mobile app for  and
and 
Tuesday, February 17, 2015
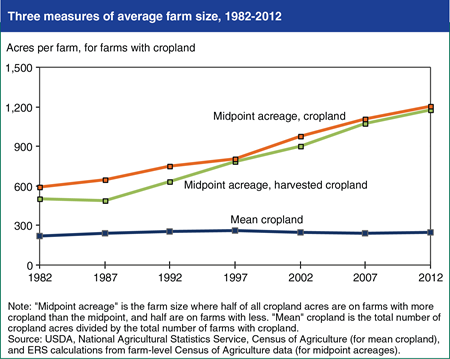
The average (mean) number of acres on crop farms has changed little over 3 decades, with a slight increase from 241 acres in 2007 to 251 in 2012. However, the mean misses an important element of changing farm structure; it has remained stable because while the number of mid-size crop farms has declined over several decades, farm numbers at the extremes (large and small) have grown. With only modest changes in total cropland and the total number of crop farms, the size of the average (mean) farm has changed little. However, commercial crop farms, which account for most U.S. cropland, have gotten larger, aided by technologies that allow a single farmer or farm family to farm more acres. The midpoint acreage (at which half of all cropland acres are on farms with more cropland than the midpoint, and half are on farms with less) effectively tracks cropland consolidation over time. The midpoint acreage of total and harvested cropland has increased over the last three decades, from roughly 500-600 acres in 1982 to about 1,200 acres in the most recent census of agriculture data (2012). This chart is extended through 2012 from one found in the ERS report, Farm Size and the Organization of U.S. Crop Farming, ERR-152, August 2013.
Monday, January 12, 2015
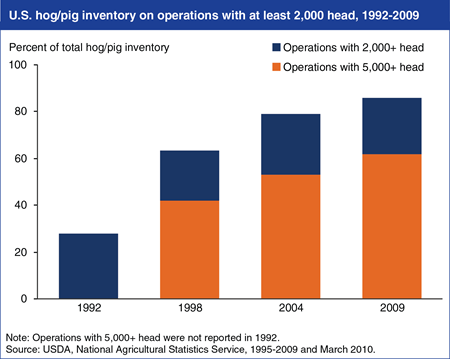
While the number of all farms in the United States remained fairly constant, the number of hog farms fell by about 70 percent between 1992 and 2009, from over 240,000 to about 71,000. Despite fewer hog farms, the Nation’s hog inventory was stable during the period, averaging about 60 million head, with cyclical fluctuations between 56 and 68 million head. Thus, hog production consolidated as fewer, larger farms accounted for an increased share of total output. From 1992 to 2009, the share of the U.S. hog and pig inventory on farms with 2,000 head or more increased from less than 30 percent to 86 percent. In 2009, farms with 5,000 head or more accounted for 61 percent of all hogs and pigs. This chart is found in the ERS report, U.S. Hog Production From 1992 to 2009: Technology, Restructuring, and Productivity Growth, ERR-158, October 2013.
Tuesday, December 16, 2014
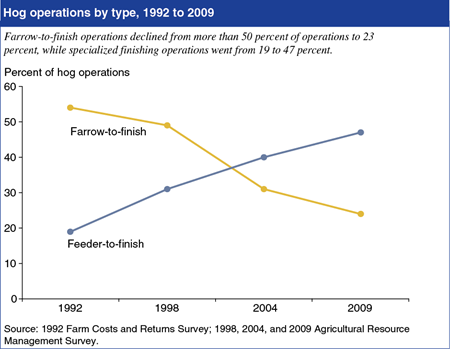
The traditional approach of farrow-to-finish hog production in the U.S.—where breeding and gestation, farrowing, nursery, and finishing to market weight are performed on one operation—is being replaced by operations that specialize in a single production phase. In 1992, more than 50 percent of U.S. hog operations used the farrow-to-finish approach. By 2009, less than 25 percent were farrow-to-finish producers. In contrast, hog operations specializing in raising feeder pigs weighing 30-80 pounds to market weights of 225-300 pounds (feeder-to-finish) accounted for less than 20 percent of hog producers in 1992, but nearly 50 percent in 2009. Specialized operations produced more than 70 percent of U.S. finished hog output in 2009, and were more likely to be producing hogs under contract than were farrow-to-finish farms. This chart is found in the ERS report, U.S. Hog Production From 1992 to 2009: Technology, Restructuring, and Productivity Growth, ERR-158, October 2013.
Monday, November 3, 2014
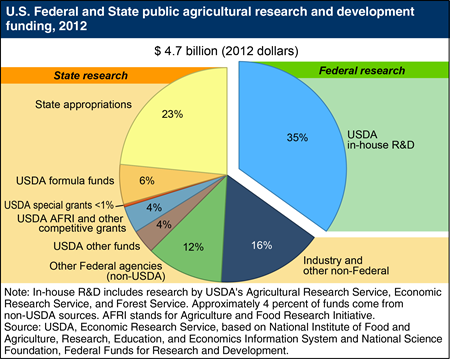
In 2012, U.S. public sector agricultural research and development (R&D) investment totaled about $4.7 billion. After adjusting for inflation, this represents a decline of nearly 25 percent since the mid-2000s. Expenditures for State Agricultural Experiment Stations and other State-based cooperating institutions accounted for a little under two-thirds of all public agricultural R&D, while USDA agencies accounted for the remaining third. Internal funding sources account for almost all of USDA’s in-house R&D expenditures while State institutions rely on a variety of funding sources. USDA-administered funding to States was about $660 million in 2012. Of this, there were two notable funding streams: $284 million in “formula funds,” and $189 million in competitive grants for the Agriculture and Food Research Initiative. In 2012, State appropriations provided $1.1 billion in State R&D funds, while non-USDA Federal agencies provided about $550 million, and private industry, product sales, and other non-Federal sources provided about $750 million. This chart updates one found in the Amber Waves finding, "Sources of Public Agricultural R&D Changing," June 2007.
Tuesday, October 14, 2014
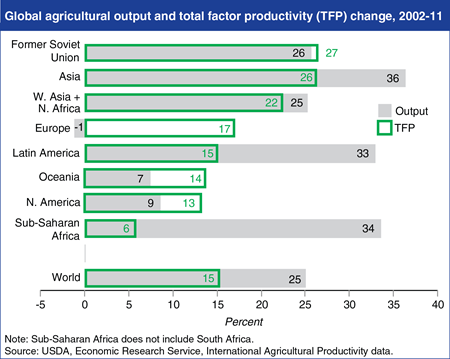
Continued progress in improving agricultural productivity—producing more output from a unit of aggregate inputs—is key to meeting expanding global food needs. Total factor productivity (TFP) in agriculture is an indicator of the rate of technical change based on a comprehensive measure of the amount of output attained from all of the land, labor, capital, and material resources employed in production. Over the 2002-2011 decade, agricultural TFP rose in every region of the world. In all regions except Latin America and Sub-Saharan Africa, gains in TFP accounted for most of the increase in agricultural output. In regions like Europe, Oceania, and North America, positive TFP growth compensated for declining input use to keep output growth positive in all cases except Europe. While Asia, Latin America, and Sub-Saharan Africa achieved the most rapid expansion in agricultural output over the decade, the former Soviet Union, Asia, and West Asia/North Africa regions recorded the most rapid gains in TFP. Estimates of TFP growth are derived by ERS using data from the Food and Agriculture Organization of the United Nations. This chart is based on data found in ERS's International Agricultural Productivity dataset.
Tuesday, September 23, 2014
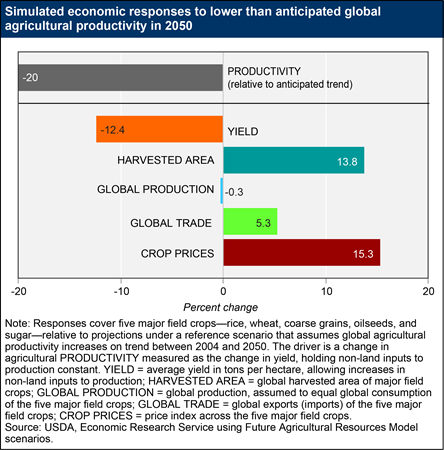
If future agricultural productivity growth is less than anticipated, how will farmers and consumers respond? Using the ERS Future Agricultural Resources Model, researchers simulated the world in 2050 assuming productivity growth similar to past trends, and then simulated the world with a lower rate of agricultural productivity (20 percent lower than anticipated) in 2050. These scenarios reflect considerable uncertainty about future growth in agricultural productivity in the face of global climate change, unpredictable public and private agricultural research and development investments, and myriad other factors that could affect productivity trends. ERS researchers find that reduced productivity growth could lead to a decline in average crop yields, more area planted in crops, and shifts in the location of production, with only a small decline in world average production and consumption of major field crops in 2050. International trade allows worldwide crop consumption to adjust to geographic variation in crop production. Actual yield does not fall as much as land productivity because other inputs increase as crop prices increase. The productivity shock is largely absorbed through intensification of agricultural production and an increase in harvested area. This chart is found in the ERS report, Global Drivers of Agricultural Demand and Supply, ERR-174, September 2014.
Thursday, August 7, 2014
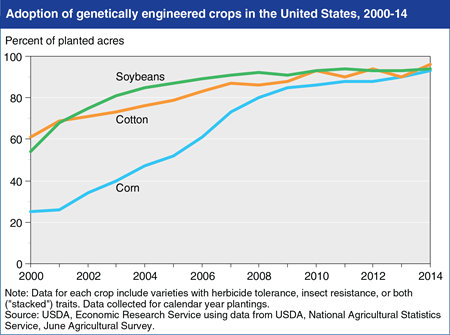
U.S. farmers have adopted genetically engineered (GE) seeds in the 19 years since their commercial introduction, despite their typically higher seed prices. Herbicide-tolerant (HT) crops, developed to survive the application of specific herbicides that previously would have destroyed the crop along with the targeted weeds, provide farmers with a broader variety of options for weed control. Insect-resistant crops contain a gene from the soil bacterium Bt (Bacillus thuringiensis) that produces a protein toxic to specific insects, protecting the plant over its entire life. “Stacked” seed varieties carry both HT and Bt traits and now account for a large majority of GE corn and cotton seeds. In 2014, adoption of GE varieties, including those with herbicide tolerance, insect resistance, or stacked traits, reached 96 percent of cotton acreage, 94 percent of soybean acreage (soybeans have only HT varieties), and 93 percent of corn acreage planted in the United States. This chart comes from the ERS data product, Adoption of Genetically Engineered Crops in the U.S., updated July 2014.
Thursday, June 19, 2014
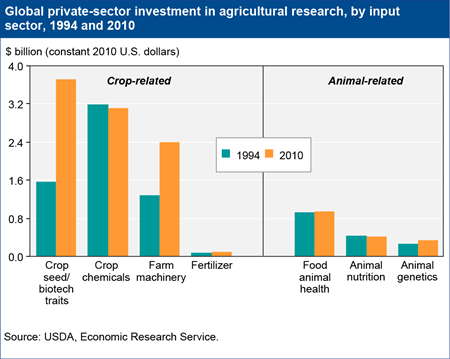
Total worldwide private R&D expenditures on agricultural inputs increased from $5.6 billion in 1994 to $11 billion in 2010, an average annual growth rate of 3.6 percent, or 1.4 percent adjusted for inflation. Crop improvement accounted for most of the increase in R&D spending between 1994 and 2010, with inflation-adjusted R&D spending in the animal-related inputs remaining flat. The most rapid growth in agricultural R&D over 1994-2010 was for crop seed and biotechnology traits. Seed-biotechnology research expenditures grew rapidly in the 1990s and between 2007 and 2010. By 2008, they surpassed research expenditures in crop protection chemicals for the first time. Farm machinery research also increased substantially, with much of the growth occurring since 2006. This change reflects both the rising demand for farm mechanization, and the response to more stringent regulatory requirements on farm vehicle exhaust emissions in the United States. This chart updates one found in ”Private Industry Investing Heavily, and Globally, in Research To Improve Agricultural Productivity” in the June 2012 issue of Amber Waves.
_450px.png?v=535.2)
Monday, May 5, 2014
Productivity growth in agriculture enables farmers to produce a greater abundance of food at lower prices, using fewer resources. A broad measure of agricultural productivity performance is total factor productivity (TFP). Unlike other commonly used productivity indicators like yield per acre, TFP takes into account a much broader set of inputs—including land, labor, capital, and materials—used in agricultural production. ERS analysis finds that globally, agricultural TFP growth accelerated in recent decades, largely because of improving productivity in developing countries and the transition economies of the former Soviet Union and Eastern Europe. During 2001-2010, agricultural TFP growth in North America and the transition economies offset declining input use to keep agricultural output growing. By contrast, declining input use in Europe offset growing TFP, resulting in a slight decline in agricultural output over the decade. In most regions of the developing world, improvements in TFP are now more important than expansion of inputs as a source of growth in agricultural production. Sub-Saharan Africa is the only major region of the world where growth in agricultural inputs accounts for a higher share of output growth than growth in TFP. This chart is based on the table found in “Growth in Global Agricultural Productivity: An Update,” in the November 2013 Amber Waves online magazine, and the ERS data product on International Agricultural Productivity.
Monday, March 31, 2014
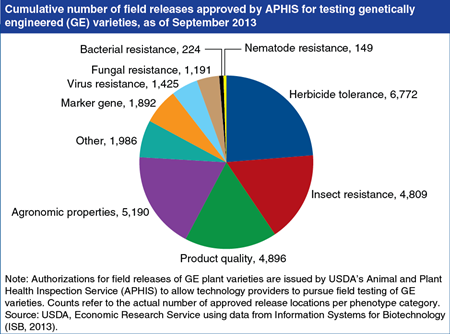
The successful commercialization of GE varieties culminates earlier research and development (R&D) efforts in agricultural biotechnology. One measure of previous and ongoing R&D activity is the number of field releases for testing of GE varieties approved by USDA’s Animal and Plant Health Inspection Service (APHIS). As of September 2013, about 7,800 releases were approved for GE corn, more than 2,200 for GE soybeans, more than 1,100 for GE cotton, and about 900 for GE potatoes. Field releases were approved for GE varieties with herbicide tolerance, insect resistance, product quality such as flavor or nutrition, agronomic properties like drought resistance, and virus/fungal resistance. After successful field testing, deregulation allows seed companies to commercialize the seeds that they have developed. As of September 2013, APHIS had received 145 petitions for deregulation and had approved 96 petitions after having determined that the organism (i.e., the GE plant) is unlikely to pose a plant pest risk. In addition to corn, cotton, and soybeans, APHIS has approved petitions for deregulation for GE varieties of tomatoes, rapeseed/canola, potatoes, sugarbeets, papaya, rice, squash, alfalfa, plum, rose, tobacco, flax, and chicory. This chart is found in “Adoption of Genetically Engineered Crops by U.S. Farmers Has Increased Steadily for Over 15 Years” in the March 2014 edition of Amber Waves online magazine.
Monday, March 17, 2014
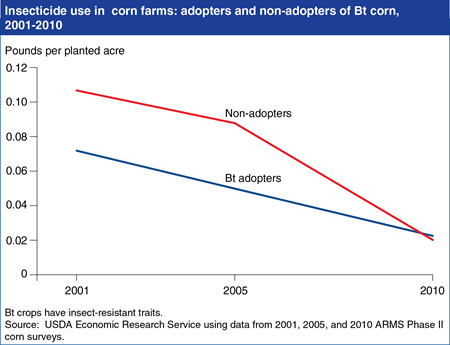
Since their first successful commercial introduction in the United States in 1996, genetically engineered (GE) seeds have been widely adopted by U.S. corn, cotton, and soybean farmers. In 2013, 169 million acres of GE corn, cotton, and soybean were planted, accounting for about half of U.S. land used for crops. One trait engineered into GE corn and cotton is resistance to certain insects (by introducing a gene from the soil bacterium Bacillus thuringiensis (Bt)), protecting the plant over its entire life cycle. Bt corn was planted on 19 percent of corn acres in 2000, 35 percent in 2005, and 76 percent in 2013. Over this period, insecticide use on corn has declined for both Bt adopters and nonadopters. These trends are consistent with research findings that area-wide suppression of certain insects is associated with Bt crop use, benefiting not only Bt adopters but non-adopters as well. However, there are some recent indications that insect resistance is developing to some Bt traits in some areas, which may increase insecticide use compared to the 2010 low levels. This chart can be found in Genetically Engineered Crops in the United States, ERR-162, February 2014.
Wednesday, December 4, 2013
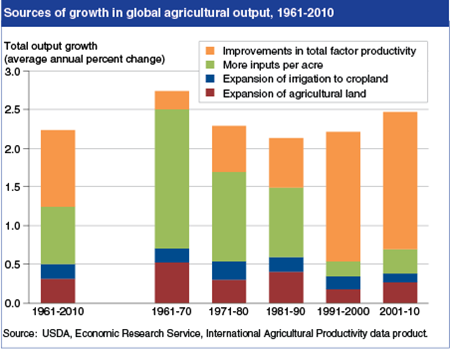
The average annual rate of global agricultural growth slowed in the 1970s and 1980s but then accelerated in the 1990s and 2000s. In the decades prior to 1990, most output growth came about from intensification of input use (i.e., using more labor, capital, and material inputs per acre of agricultural land). Bringing new land into agriculture production and extending irrigation to existing agricultural land were also important sources of growth. Over the last two decades, however, the rate of growth in agricultural resources (land, labor, capital, etc.) slowed. In 2001-10, improvements in productivity—getting more output from existing resources—accounted for more than three-quarters of the total growth in global agricultural output, reflecting the use of new technology and changes in management by agricultural producers around the world. This chart is found in the ERS data product, International Agricultural Productivity, on the ERS website, updated November 2013.
Tuesday, October 29, 2013
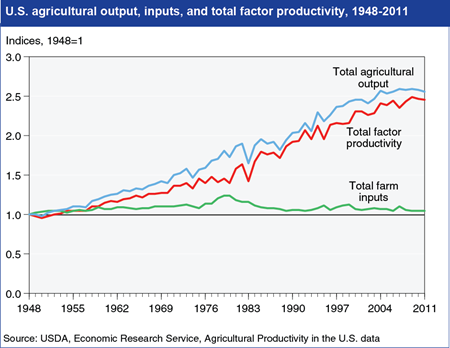
The level of U.S. farm output more than doubled between 1948 and 2011, growing at an average annual rate of 1.49 percent. Aggregate input use increased at a modest 0.07 percent annually over this period, so growth in farm sector output was almost entirely due to an increase in productivity (as measured by total factor productivity, or TFP, growth). Growth in output has not been constant—it slowed to an average annual rate of 0.78 percent during 2000-07 and was negative between 2007 and 2011, reflecting adverse growing conditions. Measured productivity growth slowed as well, averaging 0.31 percent per annum during 2000-07, but still accounted for 40 percent of the growth in output over this period. TFP growth rebounded somewhat between 2007 and 2011, as aggregate input use dropped faster than agricultural output. This chart is found in the ERS data product Agricultural Productivity in the U.S., on the ERS website, updated September 2013.
Monday, September 16, 2013
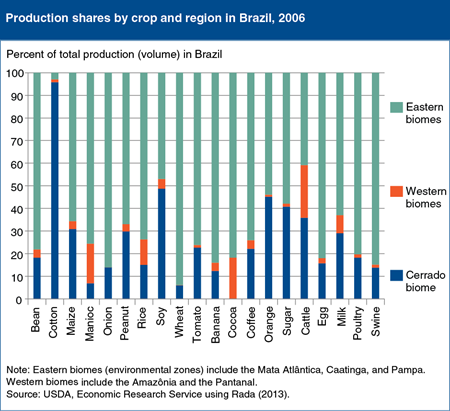
The successful agricultural transformation of Brazil’s Cerrado, a broad savannah that accounts for 24 percent of the country’s total area, has driven past growth in farm output in Brazil and is likely to remain important to future growth. The average output of Cerrado farms increased 192 percent in volume terms between 1985 and 2006. By 2006, Brazil was the second-largest global producer of soybeans after the United States, with 49 percent of that production coming from the Cerrado. The Cerrado’s tropical soils, with good physical structure but low fertility, high acidity, and susceptibility to degradation, are generally deficient in important nutrients, but improved varieties and management practices developed by Brazilian research institutions were central to making crops and pastures more productive. ERS research examining productivity across Brazilian environmental zones—or biomes—indicates that average farms in the Cerrado achieved a total factor productivity (TFP—a measure of total output to total input) growth rate of less than 1 percent per year between 1985 and 2006, far less than the 4.3 percent achieved by the biome’s most-efficient farms. This productivity gap suggests considerable room for continued output growth for most farms in the region. This chart can be found in “Evaluating the Resource Cost and Transferability of Brazil’s Cerrado Agricultural ‘Miracle’” in ERS’s September 2013 Amber Waves magazine.
Wednesday, April 17, 2013
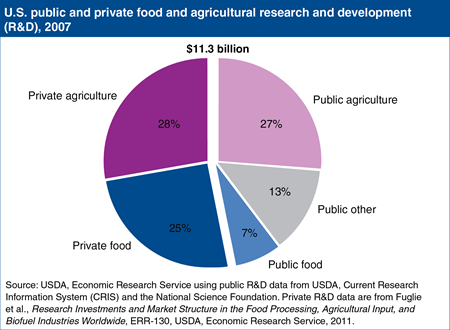
Private spending on food and agricultural research and development (R&D) in the United States has exceeded public-sector agricultural research expenditures most years since the late 1970s. In 2007 (the latest year for which complete data are available), the private sector accounted for about 53 percent of total food and agriculture-related research. Private research is nearly equally divided between food and agriculture. Public research is more oriented toward basic or fundamental science and scientific training, as well as topics like food safety—research that has high social value but for which private incentives are relatively weak. In addition, some public agricultural research funds are devoted to “other” governmental responsibilities, such as improving the environment and protecting natural resources, community development and related social goals, and economic and policy analysis. The public sector nearly matches the private sector’s investments in agricultural R&D, but spends far less on food-related research (with more emphasis on food safety rather than the private sector’s emphasis on product development). Public investment in conservation, community development, and other governmental functions has little counterpart in the private sector. This chart is a revised and updated version of one found in the June 2012 Amber Waves article, Private Industry Investing Heavily, and Globally, in Research To Improve Agricultural Productivity.
Monday, February 25, 2013
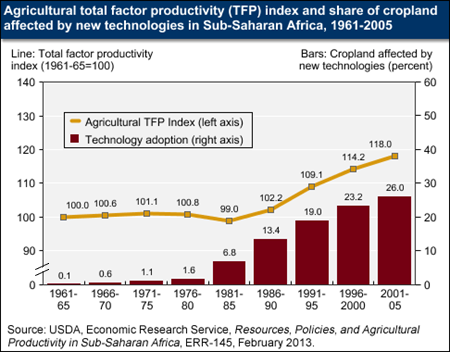
Agricultural productivity growth is a critical factor in controlling the economic and environmental costs of feeding the world’s growing population. New ERS research finds that agricultural productivity in Sub-Saharan Africa has been growing by about one percent per year since the 1980s. A major driver has been adoption of new agricultural technologies developed through agricultural research. Investment by the CGAIR Consortium of international agricultural research centers has been particularly important, providing about $6 in productivity impacts for every $1 spent by these centers on research. However, rates of new technology adoption and agricultural productivity in Sub-Saharan Africa are still low relative to other developing countries. Resource degradation, policies that reduce economic incentives to farmers, the spread of HIV/AIDS, armed conflicts, and low national research and extension capacity have hindered agricultural productivity improvement in the region. This chart is based on the ERS report, Resources, Policies and Agricultural Productivity in Sub-Saharan Africa, ERR-145, released February 2013.
Monday, January 28, 2013
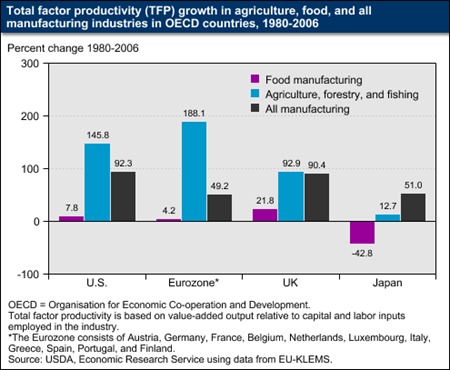
Productivity growth in food manufacturing has been far below growth rates for agriculture and manufacturing as a whole in the world’s major economies over the past three decades. Total factor productivity (TFP) measures the value added per combined unit of labor and capital employed in an industry. From 1980 to 2006, TFP growth in food manufacturing was substantially below that for total manufacturing and agriculture in the United States, the United Kingdom (UK), the “Eurozone,” and Japan. Only in the UK did food manufacturing productivity increase more than minimally; in Japan, productivity growth in food manufacturing was negative over this period. The TFP changes shown in the graph indicate the rate of capital- and labor-saving technical change in each industry, and reveal that relatively little of this innovation occurred in food manufacturing. This chart is based on data found in table 9.3 of Research Investments and Market Structure in the Food Processing, Agricultural Input, and Biofuel Industries Worldwide, ERR-130, December 2011.
Friday, November 30, 2012
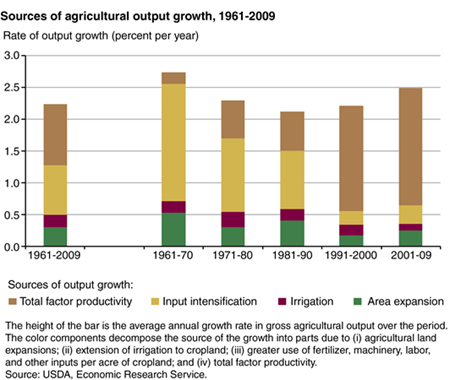
Agricultural output arises from either bringing more resources into production or by raising the productivity of those resources. Productivity of the sum of land, labor, capital and material resources is known as "total factor productivity" or TFP. Between 1961 and 2009, about 60 percent of the tripling in global agricultural output was due to increases in input use, implying that improvements in TFP accounted for the other 40 percent. TFP's share of output growth, however, grew over time, and by the most recent decade (2001-09), TFP accounted for three-fourths of the growth in global agricultural production. The rate of expansion in use of natural resources (land and water) has slowed slightly over time while the rate of growth in input intensification has fallen sharply. As such, the source of increase in agricultural yield has shifted markedly from input intensification to improvement in TFP. This chart appears in "New Evidence Points to Robust But Uneven Productivity Growth in Global Agriculture" in the September 2012 issue of ERS's Amber Waves magazine.
Tuesday, November 13, 2012
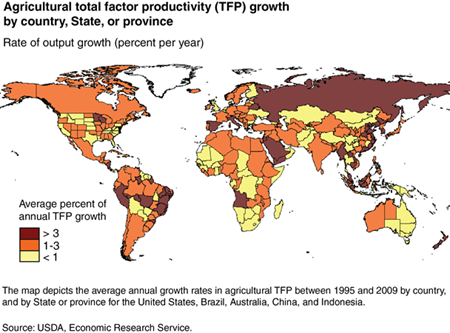
Estimates of agricultural total factor productivity (TFP) growth vary widely among and within countries. In China, TFP growth is strong in coastal areas but less so in the interior. Brazil has robust TFP growth in coastal areas and in some parts of the interior where soybeans and cotton are now produced. Productivity growth is concentrated in the western and northern regions of Indonesia where production of export commodities like palm oil and cocoa is expanding rapidly. In the United States, productivity growth is moderately strong in the Corn Belt and Lake States but low in the Plains States, Appalachia, and major horticultural States of California and Florida. While a few countries in Sub-Saharan Africa are experiencing growth, others are recovering from earlier decades when their agricultural sectors suffered from the effects of war. Raising agricultural productivity growth in Sub-Saharan Africa will likely require significantly higher public and private investments, especially in agricultural research and extension, as well as policy reforms to strengthen incentives for farmers. This chart appears in "New Evidence Points to Robust But Uneven Productivity Growth in Global Agriculture" in the September 2012 issue of ERS's Amber Waves magazine.
Wednesday, November 7, 2012
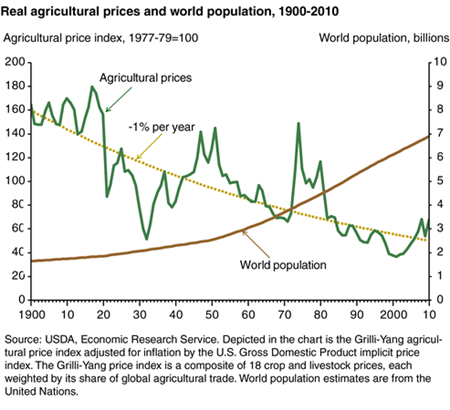
Improving agricultural productivity has been the world's primary safeguard against the needs of a growing population outstripping the ability of man and resources to supply food. Over the past 50 years, global gross agricultural output has more than tripled in volume, and productivity growth in agriculture has enabled food to become more abundant and cheaper. In inflation-adjusted dollars, agricultural prices fell by an average of 1 percent per year between 1900 and 2010, despite an increase in the world's population from 1.7 billion to nearly 7.0 billion over the same period. Nonetheless, food prices have been rising since around 2001. This has renewed concerns about the pace of agricultural productivity growth. If productivity growth slows, then more resources--land, labor, energy, fertilizers, and other inputs--would be needed to meet rising demand, raising the cost of food. This chart appears in "New Evidence Points to Robust But Uneven Productivity Growth in Global Agriculture" in the September 2012 issue of ERS's Amber Waves magazine.


