ERS Charts of Note
Subscribe to get highlights from our current and past research, Monday through Friday, or see our privacy policy.
Get the latest charts via email, or on our mobile app for  and
and 
Monday, May 22, 2017
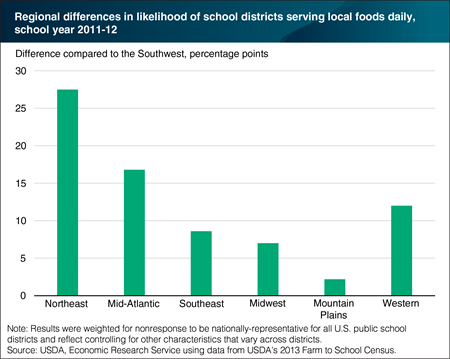
In 2013, ERS and USDA’s Food and Nutrition Service collaborated on the first Farm to School Census to collect data from public school districts on the use of local foods in school meals. The information collected included how frequently local foods were served and which ones were served more often. Milk, fruit, and vegetables were the most frequently served locally-produced foods. ERS researchers found that, after controlling for other characteristics that vary across school districts, districts in the Northeast and the Mid-Atlantic were 28 and 17 percentage points, respectively, more likely to serve local foods daily than those in the Southwest. School districts in cities were 11 percentage points more likely to serve local foods daily than districts in rural areas, and districts with 5,000 or more students were 9 percentage points more likely to do so than districts with less than 5,000 students. This chart appears in "School Districts in the Northeast Are Most Likely to Serve Local Foods on a Daily Basis" in the May 2017 issue of ERS’s Amber Waves magazine.
Tuesday, August 23, 2016
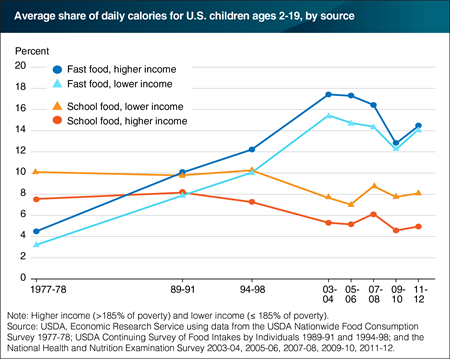
Federal food intake surveys conducted between 1977 and 2012 reveal that, in the 1990s, fast food overtook school food as the largest source of food prepared away from home in children’s diets. However, school foods have remained a more important source of calories for lower income children than for higher income children. The mandated cutoff for free or reduced-price USDA school meals is a household income at or below 185 percent of the Federal poverty level. In 1977-78, school meals provided 10.1 percent of the calories consumed by lower income children eligible for free or reduced-price school breakfasts and lunches and 7.5 percent of higher income children’s total calories. In that same year, fast food provided 4.5 percent of higher income children’s average daily energy intake and 3.2 percent of lower income children’s calories. School food continued to provide about 10 percent of lower income children’s total calories in 1994-98 but, by 2011-12, the school food share fell to 8.1 percent and the fast food share rose to 14.2 percent. This chart appears in “Linking Federal Food Intake Surveys Provides a More Accurate Look at Eating Out Trends” in the June 2016 issue of ERS’s Amber Waves magazine.
Monday, June 6, 2016
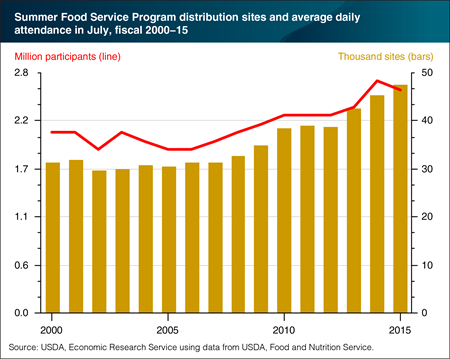
The Summer Food Service Program provides nutritious meals and snacks at no charge to children in low-income areas when their schools are not in session. Summer Food Service Program sites include schools, camps, parks, playgrounds, housing projects, community centers, churches, and other public sites where children gather in the summer. Sites are eligible to offer free USDA-funded meals and snacks if the sites operate in areas where at least half of the children come from families with incomes at or below 185 percent of the Federal poverty level or if more than half of the children the site serves meet this income criterion. The number of sites offering summer meals rose from 45,170 sites in 2014 to 47,585 in 2015. Participation on an average operating day in July dropped slightly from 2.7 million children in 2014 to 2.6 million in 2015. Many low-income children also obtain free meals while school is out through the Seamless Summer Option of the National School Lunch and Breakfast Programs. This chart is from the Child Nutrition Programs: Summer Food Service Program topic page on the ERS website, updated May 25, 2016.
Thursday, May 19, 2016
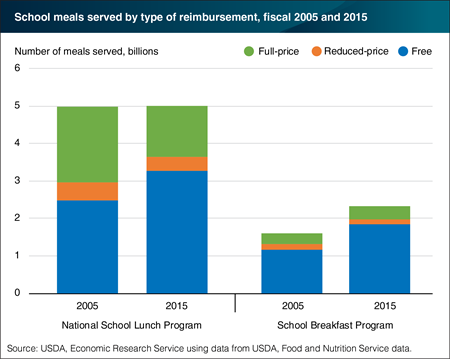
On a typical school day in fiscal 2015, 30 million children participated in USDA’s National School Lunch Program and 14 million in the School Breakfast Program. Children from families with incomes at or below 130 percent of Federal poverty guidelines are eligible for free meals, and those from families with incomes between 130 and 185 percent of poverty guidelines are eligible for reduced-price meals. Children from families with incomes over 185 percent of poverty guidelines pay full price, although their meals are subsidized to a small extent. Over twice as many meals were served in the National School Lunch Program (5 billion) as in the School Breakfast Program (2.3 billion) in FY 2015. About 80 percent of breakfasts were served free compared with 65 percent of lunches. Another 6 percent of breakfasts and 7 percent of lunches were served at a reduced price. The share of free meals served in both programs has increased since 2005. Increases in the poverty rate for children and the recent Community Eligibility Provision, which allows schools in areas with high poverty rates to offer breakfast and lunch at no charge to all students, may be among the factors that contributed to the increase in children receiving free school meals. The 2015 data for this chart are from the ERS report, The Food Assistance Landscape: FY 2015 Annual Report, March 2016.
Tuesday, March 15, 2016
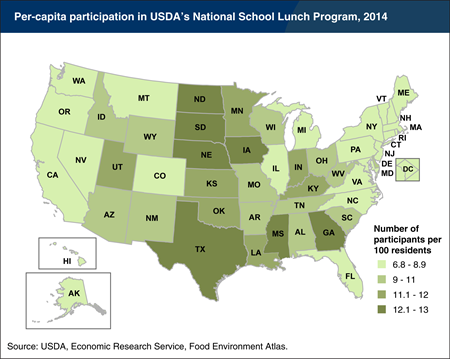
In fiscal year 2014 (October to September), 30.5 million students participated in USDA’s National School Lunch Program (NSLP) on an average school day, with 72 percent of participants receiving the meals for free or at a reduced price. On a per-capita basis, this translates into 9.4 NSLP participants per 100 U.S. residents. Per-capita participation in the NSLP ranged from 6.8 participants per 100 residents in Alaska to 13 per 100 residents in Mississippi. Per-capita participation reflects both the percentage of the population that are enrolled in schools offering USDA meals, as well as the proportion of those students who take school lunch. For example, in Utah, where per-capita participation is 11.2 participants per 100 residents, school-aged children in schools offering USDA meals make up 21.5 percent of the population, and 52 percent of those students participate in the NSLP. Alaska’s lower rate reflects a low percentage of residents that are of school age (16 percent) and a lower rate of children participating in the program (42 percent of students). This map is from ERS’s Food Environment Atlas.
Friday, January 29, 2016
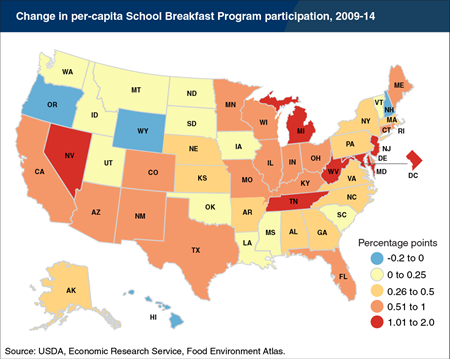
Per-capita participation in USDA’s School Breakfast Program (SBP) has increased from 3.6 participants per 100 U.S. residents in 2009 to 4.2 participants per 100 residents in 2014, and most States’ per-capita SBP participation levels rose. For most States, changes in population and in enrollment in schools that serve USDA school meals were less important than changes in the share of students who take school breakfast. For example, West Virginia’s increase from 5.1 to 7.1 SBP participants per 100 residents reflected small increases in the State’s population and school enrollments, and a large jump in the number of students taking school breakfast—increasing from 31 to 44 percent of students. In only four States did per-capita SBP participation levels decline, and these declines were 0.2 percentage point or less. School Breakfast Program participation across the whole United States has increased steadily from 11.1 million students in 2009 to 13.6 million in 2014 due to a variety of factors, including more schools offering the program, more schools offering free breakfast for all students, and increasing use of formats such as breakfast in the classroom, which reduces arrival-time barriers for many children. This map is from ERS’s Food Environment Atlas.
Wednesday, January 20, 2016
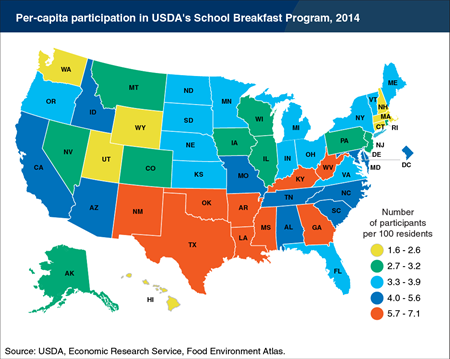
In fiscal year 2014, 13.6 million students participated in USDA’s School Breakfast Program (SBP) on an average school day, with 85 percent of participants receiving the meals for free or at a reduced price. On a per-capita basis, this translates into 4.2 SBP participants per 100 U.S. residents. Per-capita participation in the SBP ranged from 1.6 participants per 100 residents in New Hampshire to 7.1 per 100 residents in New Mexico and West Virginia. Per-capita participation reflects both the percentage of the population that are enrolled in schools offering USDA meals, as well as the proportion of those students who take school breakfast. For example, in Texas, where per-capita participation is 6.9 participants per 100 residents, school-aged children in schools offering USDA meals make up 19 percent of the population, and 35 percent of those students participate in the SBP. New Hampshire’s lower rate reflects a low percentage of residents that are of school age (14 percent) and a lower rate of children participating in the program (11 percent of students). This map is from ERS’s Food Environment Atlas.
_450px.png?v=1073.2)
Monday, January 4, 2016
Across America, on a typical school day more than 30 million children sit down to meals prepared and served through USDA’s National School Lunch Program and 13.5 million through the School Breakfast Program. Some school districts serve as many breakfasts as lunches, but other districts serve mainly lunches. Since production costs often depend on volume, this smaller number of breakfasts served raises questions about how per-breakfast costs compare with per-lunch costs. To examine how size affects costs, ERS researchers used data from a 2004 national survey (latest regionally representative cost data available) of local school food authorities (SFAs). The researchers constructed cost indices to examine how breakfast and lunch costs would vary if more meals were served. They found that for all three urbanicity types—urban, suburban, and rural—per-breakfast costs dropped by about 50 percent as the number of breakfasts grew from below average to above average. Because SFAs were already serving more lunches, lunch costs also dropped, but by just 20 percent. This chart appears in “Schools Vary—And That Means Meal Costs Vary Too” in the December 2015 issue of ERS’s Amber Waves magazine.
Thursday, November 12, 2015
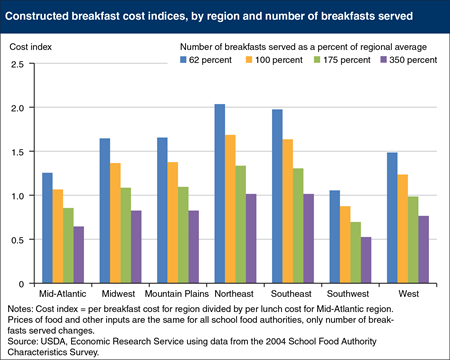
Through the National School Lunch and School Breakfast Programs, USDA reimburses school food authorities (SFAs) for providing meals that meet USDA nutritional standards. School districts generally expect SFA revenues—a combination of USDA reimbursements, payments by participating students, revenue from non-reimbursable food sales, and other non-Federal resources—to cover meal costs. Using data from a 2004 national study, ERS researchers constructed cost indices to allow comparisons across SFAs of how per meal costs would vary if more meals were served. Researchers found that the number of meals served had a large impact on per meal costs, especially for breakfasts. In all seven U.S. regions, breakfast costs dropped as the number of breakfasts increased. Per breakfast costs for the smallest SFAs were about twice that of the largest SFAs. Serving more breakfasts would allow SFAs to gain economies of scale—reduced per unit costs due to volume discounts in purchases, more efficient use of labor, or other efficiencies. This chart appears in the ERS report, Economies of Scale, the Lunch-Breakfast Ratio, and the Cost of USDA School Breakfasts and Lunches, released on November 5, 2015.
Friday, November 6, 2015
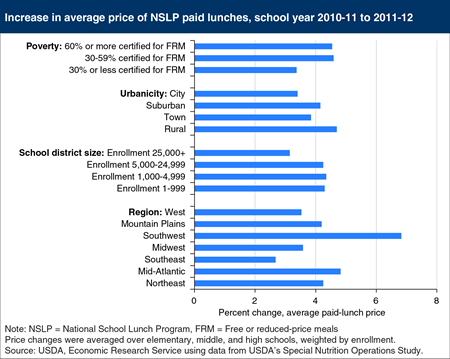
In 2014, over 30 million U.S. schoolchildren participated in USDA’s National School Lunch Program on an average school day. Seventy-two percent of them received their meals for free, or paid a reduced price; the remaining 28 percent purchased the full-price, or paid, lunch. Until a few years ago, prices charged for paid lunches generally increased slowly to cover rising costs of producing school lunches. Starting in school year 2011-12, many districts raised prices more sharply to comply with the Paid Lunch Equity provision, which went into effect that year. This provision requires school districts to gradually ensure that average revenue per paid lunch plus the USDA paid lunch reimbursement is at least as high as the USDA reimbursement for free lunches. Paid-lunch prices rose by an average of 6.8 percent for school districts in the Southwest and 4.8 percent in the Mid-Atlantic between school years 2010-11 and 2011-12, according to ERS calculations using data from a USDA-sponsored study. Rural school districts reported an average increase of 4.7 percent in paid-lunch prices compared to an increase of 3.4 percent for city districts. Areas with higher price increases may experience greater reductions in paid-lunch participation since research shows that some families cut back on school lunch purchases when lunch prices rise. This chart appears in “A Look at What’s Driving Lower Purchases of School Lunches” in the October 2015 issue of ERS’s Amber Waves magazine.
Monday, October 19, 2015
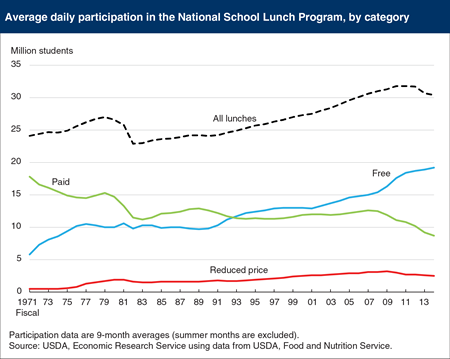
In fiscal 2014, 30 million children participated in USDA’s National School Lunch Program on an average school day, down from a peak of 32 million in 2011. The decline since 2011 reflects a drop in students taking full-price, or “paid,” lunch that began in 2008. A sharp increase in students taking free lunch during 2008-11 as a result of the 2007-09 recession made up for the drop in students taking paid lunch. During 2011-14, students taking free lunch grew more slowly, while students taking paid lunch continued to fall at roughly the same pace. Participation also fell in the early 1980s in response to tightened access to free lunches, reduction in USDA reimbursements to schools, increases in prices for paid lunch, and the 1980-82 recession. This chart appears in “A Look at What’s Driving Lower Purchases of School Lunches” in the October 2015 issue of ERS’s Amber Waves magazine.
Wednesday, September 2, 2015
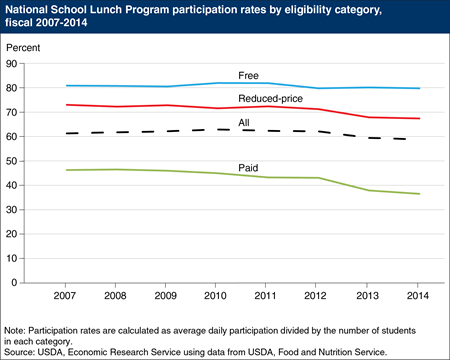
Since its start in 1946, USDA’s National School Lunch Program (NSLP) has offered and served lunches to children of all income levels. Based on household income, eligible students can receive their lunches for free or at a reduced price. Students not approved for free or reduced price lunches can purchase NSLP lunches at the “paid lunch” price. For reduced price and paid lunches, participation rates—the share of students in each certification category who participate—have fallen in recent years. In fiscal 2014, 67 percent of students approved to receive reduced price meals took the reduced price lunch, down from 73 percent in fiscal 2009. After increasing during the 2000s, the paid lunch participation rate fell from 47 percent in fiscal 2008 to 37 percent in fiscal 2014. The participation rate for free lunches has been fairly constant at around 80 percent over 2007-2014. A combination of reasons may be affecting NSLP participation, including tougher economic times leading more parents to pack their children’s lunches rather than buy lunch, as well as recent changes to NSLP meal requirements and price increases for paid lunches. This chart is from the ERS report, School Meals in Transition, released on August 20, 2015.
Monday, June 15, 2015
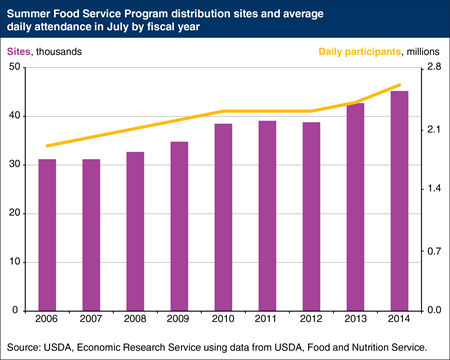
When school lets out for the summer, low-income children who participate in USDA’s National School Lunch and School Breakfast Programs lose access to weekday free and reduced-price meals, which may be a hardship for income-strapped families. Through the Summer Food Service Program, USDA reimburses schools, camps, non-profit organizations, and community agencies for nutritious meals and snacks served at no charge to children at eligible sites. A site is eligible for USDA reimbursement if it operates in an area where at least half of the children come from families with incomes at or below 185 percent of the Federal poverty level or if more than half of the children the site serves meet this income criterion. The number of sites offering summer meals rose 16 percent from 38,845 sites in 2012 to 45,170 sites in 2014. Participation on an average operating day in July increased from 2.3 million children in 2012 to 2.6 million children in 2014. In summer 2014, the program provided over 160 million meals and snacks to children at a cost to USDA of $465 million. This chart is from the Child Nutrition Programs: Summer Food Service Program topic page on the ERS website
Thursday, June 4, 2015
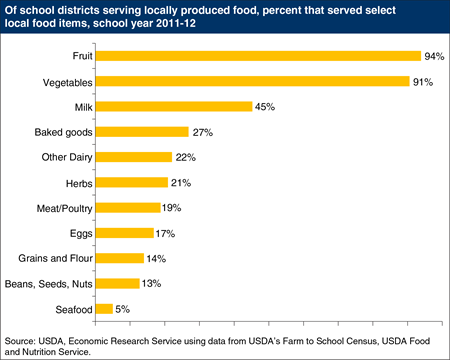
According to USDA’s Farm to School Census, 36 percent of the U.S. public school districts that completed the questionnaire reported serving at least some locally produced foods in school lunches or breakfasts during school years 2011-12 or 2012-13. While fruits and vegetables topped the list of local foods served in schools in 2011-12, 45 percent of the school districts that used local foods reported serving locally produced milk, and 27 percent reported serving locally produced baked goods. Some States have State-produced foods, such as fruits and vegetables, grains, meats, and dairy products included in the products donated by USDA for use in school meals (a program called USDA Foods). The DOD Fresh Program allows districts to use USDA funds to obtain fresh fruits and vegetables through the Department of Defense, which provides information to districts on foods that are sourced locally. This chart appeared in “Many U.S. School Districts Serve Local Foods” in the March 2015 issue of ERS’s Amber Waves magazine.
Tuesday, April 7, 2015
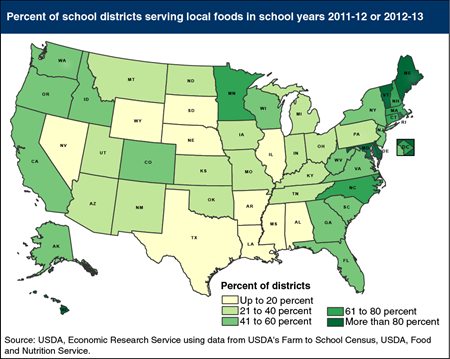
The Healthy Hunger-Free Kids Act of 2010 established the USDA Farm to School Program to encourage school districts to use locally produced food for school-provided breakfasts and lunches. USDA’s Farm to School Census, covering school years 2011-12 and 2012-13, found that 36 percent of the 9,887 public school districts that responded to the Census served locally produced food in their school meal programs, and an additional 9 percent planned to serve local foods in the future. Many States have legislation encouraging local sources of foods for school meals, and in a handful of States (Rhode Island, Maryland, Delaware, Vermont, Maine, and Hawaii) more than 80 percent of school districts that completed the questionnaire reported serving some local foods. In 10 other States, 20 percent or fewer districts reported serving local foods. Some of the hurdles to serving local foods cited by school districts included lack of year-round availability of key items, high prices for local foods, and lack of availability of local foods from primary vendors. This map appears in “Many U.S. School Districts Serve Local Foods” in the March 2015 issue of ERS’s Amber Waves magazine.
Friday, February 27, 2015
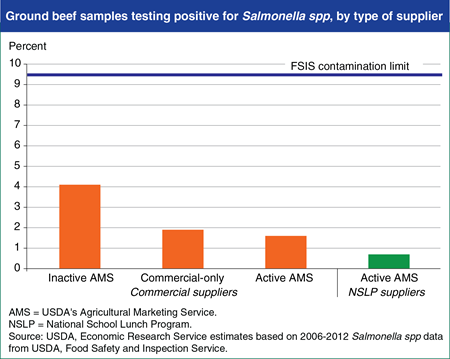
USDA’s Agricultural Marketing Service (AMS) provides about half of the ground beef served in the National School Lunch Program (NSLP) by purchasing raw and cooked ground beef products from U.S. meat producers. AMS-approved suppliers must meet AMS’s basic standards. AMS suppliers can be “active” and sell to the NSLP or be “inactive” and sell in commercial markets only. Active ground beef suppliers must adhere to a strict Salmonella standard. A recent ERS study found that on average, ground beef from all groups of producers examined had levels of Salmonella below the limit set by USDA’s Food Safety and Inspection Service. Researchers also found that AMS standards incentivize producers to supply ground beef to the NSLP that has lower levels of Salmonella contamination (0.7 percent of samples testing positive) than the ground beef the same suppliers sell to commercial buyers (1.6 percent of samples testing positive). Plants supplying ground beef to the NSLP performed better on Salmonella tests than commercial-only and inactive AMS plants. This chart appears in “Strict Standards Nearly Eliminate Salmonella From Ground Beef Supplied to Schools” in the February 2015 issue of ERS’s Amber Waves magazine.
Wednesday, February 4, 2015
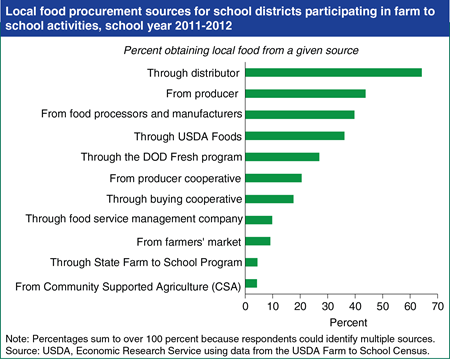
USDA encourages school districts to source locally-produced food through its Farm to School Program established as part of the Healthy Hunger-Free Kids Act of 2010. Data from USDA’s Farm to School Census, reflecting responses from 9,887 public school districts (75 percent of all U.S. public school districts), reveal that 4,322 districts were serving at least some local foods in school year 2011-2012 or started to in 2012-2013. The top local foods categories were fruits and vegetables, milk, and baked goods. Nearly two-thirds of districts participating in farm to school activities purchased local foods through a distributor. A little over 40 percent of these districts obtained local foods directly from farmers and other producers, while 40 percent sourced local foods from food processors and manufacturers. Some States arrange to have State-produced fruits and vegetables included in the commodities donated by USDA for use in school meals. This chart appears in Trends in U.S. Local and Regional Food Systems released January 29, 2015.
Wednesday, July 30, 2014
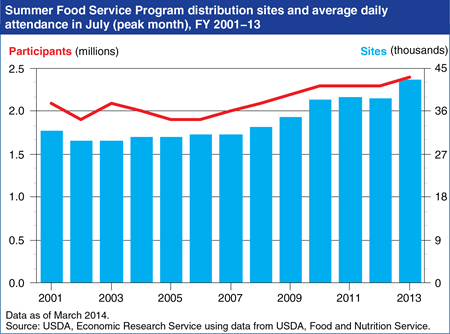
USDA’s Summer Food Service Program provides nutritious meals and snacks to children in low-income areas during the summer months, and during long vacation periods for schools on year-round schedules. USDA reimburses schools, local government agencies, camps, private non-profit organizations, and other sponsors for meals and snacks served to children at eligible sites. The program served 151 million meals and snacks at a cost to USDA of more than $427 million in fiscal 2013. After rising in 2008 and 2009, the number of sites offering summer meals to children remained about the same from 2010 to 2012 but rose from 38,845 in 2012 to 42,654 in 2013. Participation also increased in 2013, with the program serving more than 2.4 million children on an average operating day in July. This chart is from the Child Nutrition Programs: Summer Food Service Program topic page on the ERS website, updated June 23, 2014.
Friday, July 11, 2014
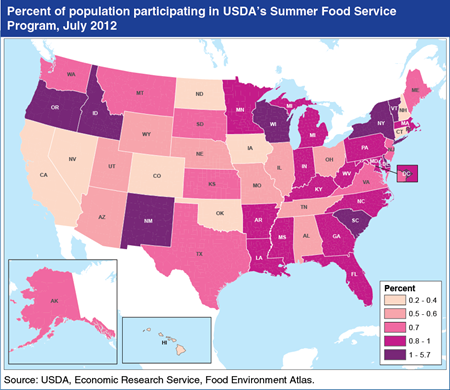
When school is not in session, USDA’s Summer Food Service Program (SFSP) provides free meals and snacks to children and teens at approved sites such as schools, churches, parks, community centers, and day camp programs. SFSP meals must meet Federal nutrition guidelines and are served in areas with high concentrations of low-income children. In July 2012, the percent of a State’s total population participating in SFSP ranged from 0.2 percent in Nevada to 1.9 percent in New Mexico and New York. That same year, 5.7 percent of the District of Columbia’s population participated in the program. Demographic factors help explain differences in program participation as a percentage of total population; higher SFSP participation rates could reflect a higher proportion of school-age children relative to total population, or a higher number of low-income children relative to the overall school-age population. Differences in availability and accessibility of SFSP sites also play an important role in the variability across States. This map is from ERS’s Food Environment Atlas.
Monday, June 9, 2014
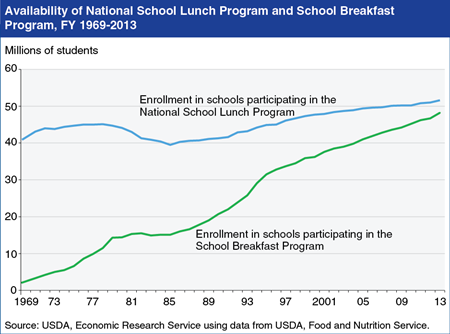
USDA’s National School Lunch Program (NSLP) was established in 1946 and has been available in nearly all public schools and many private schools since the 1970s. In fiscal 2013, about 52 million children attended schools where NSLP lunches were offered to students and 59 percent of children enrolled in those schools participated in the program. USDA’s School Breakfast Program (SBP) is a newer program—the SBP was not granted permanent authorization until 1975. As SBP funding increased and grants to schools to help start up the program became more available, the number of schools offering the program steadily grew. By fiscal 2013, 94 percent of the students who had access to the NSLP also had access to the SBP (48 million school children). However, only 27 percent of children enrolled in schools offering the SBP participated in that program in fiscal 2013. This chart appears in ERS’s The Food Assistance Landscape: FY 2013 Annual Report.


