ERS Charts of Note
Subscribe to get highlights from our current and past research, Monday through Friday, or see our privacy policy.
Get the latest charts via email, or on our mobile app for  and
and 
Thursday, May 3, 2018
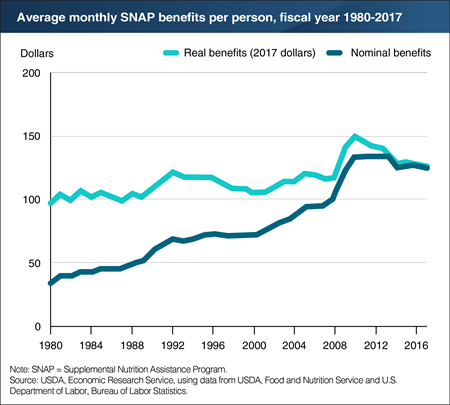
USDA’s Supplemental Nutrition Assistance Program (SNAP) provides low-income households with monthly benefits to supplement their resources for purchasing food. Benefit amounts increase with household size and decrease with household income. Between 1980 and 2017, average monthly benefits grew from $34 per person to $126 per person. Much of this increase reflects the fact that SNAP benefit levels are updated annually for food price inflation so that their purchasing power does not erode. However, even when benefits are adjusted for inflation, average per person benefits rise and fall as characteristics of SNAP households, such as income, change in response to economic conditions and policy changes. Measured in 2017 dollars to adjust for inflation, average monthly SNAP benefits increased from $99 per person in 1980 to $119 in 2008. The 2009 American Recovery and Reinvestment Act (ARRA) provided all recipients with increased SNAP benefits, and average inflation-adjusted SNAP benefits jumped to $143 per person in that year, climbed to $152 in 2010, and then began falling as the ARRA increase was phased out and economic conditions improved. Inflation-adjusted and nominal benefit amounts have been similar in the past few years, as food price increases have been small. This chart appears in ERS’s Supplemental Nutrition Assistance Program (SNAP) topic page.
Friday, April 20, 2018
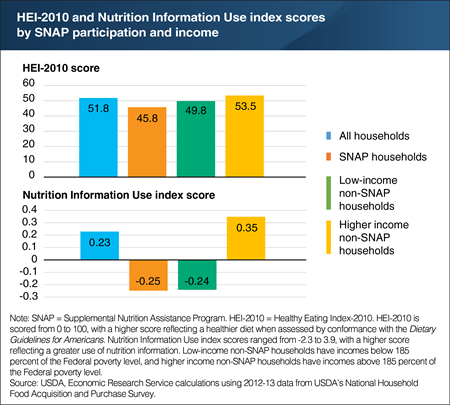
A new ERS study used nine questions from USDA’s 2012-13 National Household Food Acquisition and Purchase Survey (FoodAPS) to create a Nutrition Information Use index. The index is based on answers from FoodAPS primary respondents related to their awareness and use of various nutrition education initiatives, such as USDA’s MyPlate guidance and Nutrition Facts labels. The index summarizes the answer scores into one score, giving more weight to more important questions. When answers to questions with more weight are above average (e.g., the person uses Nutrition Facts labels all the time), the score is positive. If the answers are below average (e.g., the person never uses Nutrition Facts labels), the score is negative. Index scores for FoodAPS households ranged from -2.3 to 3.9, with a higher score indicating a greater use of nutrition information. The average score for all households was 0.23, and 58 percent of households had scores between -1.0 and 1.0. Higher income households that did not participate in USDA’s Supplemental Nutrition Assistance Program (SNAP) had an average index score that was two and half times higher than SNAP households and low-income non-SNAP households. However, index score differences did not seem to explain why higher income non-SNAP households’ food purchases were more healthful than the other two groups. The statistics for this chart are drawn from the ERS report, The Association Between Nutrition Information Use and the Healthfulness of Food Acquisitions, released on April 19, 2018.
Wednesday, April 4, 2018
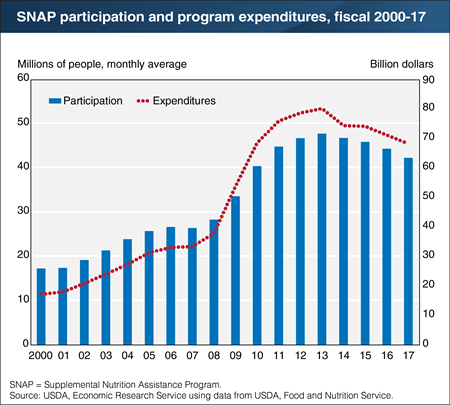
Fiscal 2017 marked the fourth consecutive year that participation in USDA’s largest food and nutrition assistance program, the Supplemental Nutrition Assistance Program (SNAP), decreased. On average, 42.2 million people—or about 13 percent of the Nation’s population—participated in the program each month in fiscal 2017. Participants received an average of about $126 of benefits per month to purchase food at authorized foodstores. Fiscal 2017’s caseload was almost 5 percent fewer than in the previous fiscal year and 11 percent fewer than the historical high average of 47.6 million per month in fiscal 2013. Fiscal 2017’s decrease in the number of SNAP participants in large part reflects the continued improvement in the U.S. economy in recent years. Federal spending for SNAP fell by 4 percent in fiscal 2017 to $68.0 billion—15 percent less than the historical high of $79.9 billion set in fiscal 2013. This chart appears in "Number of People Participating in USDA’s Supplemental Nutrition Assistance Program Continues to Fall" from the April 2018 issue of ERS’s Amber Waves magazine.
Monday, March 19, 2018
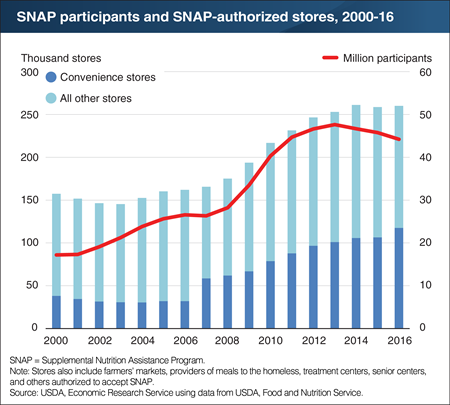
In 2016, low-income participants in USDA’s Supplemental Nutrition Assistance Program (SNAP) received an average of about $126 in benefits each month to purchase eligible food items in authorized retail food stores. To become an authorized SNAP store, retailers are required to meet various criteria based in part on the types of food offered for sale. As of September 2016, over a quarter million (260,115) food retailers were authorized to redeem SNAP benefits. From 2007 to 2013, the number of SNAP-authorized stores grew by 53 percent. This increase coincided with a sharp rise in the number of SNAP participants that was largely due to the economic downturn, including the Great Recession of 2007-09, which increased demand for food assistance. Much of the growth in the number of SNAP stores was the result of more convenience stores applying for and receiving authorization to accept SNAP benefits. The number of SNAP-authorized convenience stores doubled from 2007 to 2016. By 2016, convenience stores accounted for 45 percent of all SNAP-authorized stores, but these stores accounted for just 6 percent of SNAP redemptions. This chart is from "Eligibility Requirements for SNAP Retailers: Balancing Access, Nutrition, and Integrity" in ERS’s Amber Waves magazine, January 2018.
Tuesday, February 20, 2018
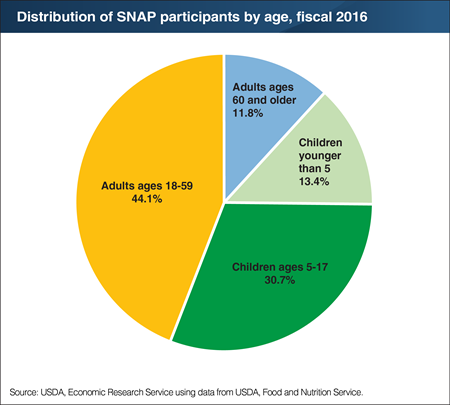
In an average month in fiscal 2017, USDA's Supplemental Nutrition Assistance Program (SNAP) provided 42.1 million low-income Americans with benefits to purchase food at authorized food stores. The number of people receiving SNAP benefits has declined by 11.5 percent since the historical high of an average 47.6 million per month in fiscal 2013. In the 2016 fiscal year (the latest year for which demographic data are available), adults age 18-59 accounted for 44.1 percent of participants, children younger than age 5 accounted for 13.4 percent of participants, school-age children accounted for 30.7 percent of participants, and the elderly accounted for 11.8 percent of participants. The composition of SNAP participants, as well as the overall SNAP caseload, can be affected by both changing economic conditions and modifications to program requirements. The composition shifted after the 2007-09 recession, as more working-age adults became eligible for the program and applied for benefits. Working-age adults' share of the SNAP caseload increased from 42.1 percent in 2006 to 46.4 percent in 2013, and has declined each year since 2013. This chart is from ERS's data product, Ag and Food Statistics: Charting the Essentials.
Thursday, February 15, 2018
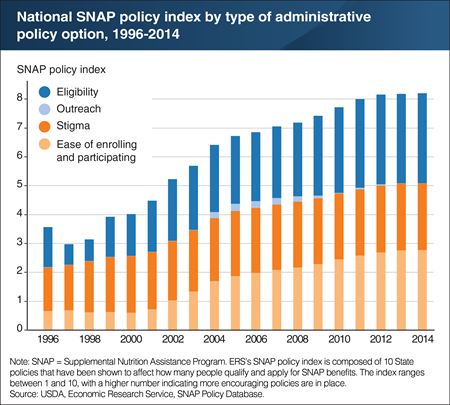
USDA’s Supplemental Nutrition Assistance Program (SNAP) is the Nation’s largest food assistance program. For much of the program’s history, administration of SNAP was largely uniform across States. However, welfare reform legislation in 1996 and subsequent legislative and regulatory changes have allowed States increased flexibility to administer some components of the program. ERS researchers recently developed an index that reflects how accommodative, or encouraging, State policies are to enrolling individuals in SNAP. This SNAP policy index is composed of 10 State policies related to eligibility, ease of enrolling and participating, participation stigma, and outreach to attract new participants. The index ranges between 1 and 10, with a higher number indicating more accommodative policies are in place. For the Nation as a whole, the index grew steadily from 1997 to 2014, meaning that States tended to adopt policies encouraging enrollment. Between 1997 and 2000, policies that relaxed eligibility and reduced stigma played the largest roles in the rising index. After 2000, policies that made enrolling and remaining in the program easier played a larger role. This chart appears in the ERS report, "Using a Policy Index to Capture Trends and Differences in State Administration of USDA’s Supplemental Nutrition Assistance Program", released on February 5, 2018.
Friday, February 2, 2018
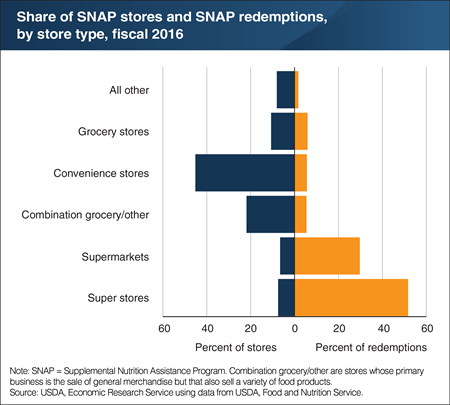
USDA’s Supplemental Nutrition Assistance Program (SNAP) provides participants with electronic benefits to purchase food in authorized retail food stores. In fiscal 2016, over $66 billion in SNAP benefits were redeemed, accounting for about 10 percent of the Nation’s spending on food at home. As of September 2016, 260,115 stores were authorized to accept SNAP. Convenience stores accounted for the largest share of SNAP stores (45 percent), but less than 6 percent of all SNAP benefits were redeemed in these smaller stores. Conversely, large super stores, which sell a wide variety of food and nonfood items, and supermarkets together accounted for only 14 percent of SNAP stores, but 81 percent of national SNAP redemptions. Super stores and supermarkets generally have a wider variety of foods and lower prices than smaller stores. Because SNAP benefits are for a fixed dollar amount, participants have an incentive to stretch their benefits by seeking out the best values when choosing where to spend their benefits. This chart appears in the ERS report, Design Issues in USDA’s Supplemental Nutrition Assistance Program: Looking Ahead by Looking Back, released on January 25, 2018.
Thursday, December 7, 2017
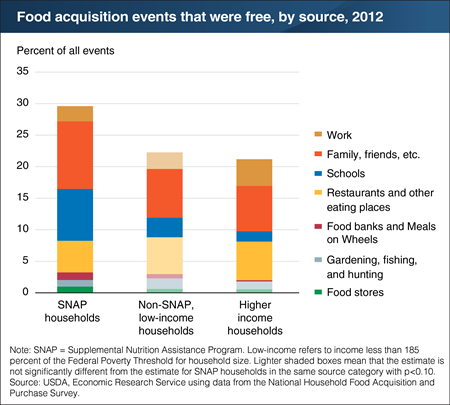
U.S. households obtain food from a variety of sources, including retail food stores, restaurants, schools, and work places. Some of these aquistions—such as meals at family gatherings and employer-provided meals and snack—are free to the household. Participants in USDA’s National Household Food Acquisition and Purchase Survey (FoodAPS) were asked to report each food acquisition event over the course of 7 days between April 2012 and January 2013, noting where the food was obtained and how much the household paid for each item or if the food was free. A food acquisition event can involve a single meal or snack, multiple meals, or a grocery store visit to obtain the week’s groceries. The share of free events was higher among SNAP participants (30 percent of total food acquisitions) as compared to low-income and higher-income nonparticipants (22 and 21 percent, respectively). SNAP participants reported larger shares of free events from schools and from social gatherings of family, friends, and others. Children from SNAP households are eligible to receive free meals from USDA school meals programs, which may make it easier for SNAP households to access these free meals. Further research is needed to understand the reasons for differences in free food events across groups. This chart is from "Nearly 30 Percent of the Times That SNAP Households Acquire Food, the Food Is Free" in the November 2017 issue of ERS’s Amber Waves magazine.
Thursday, October 12, 2017
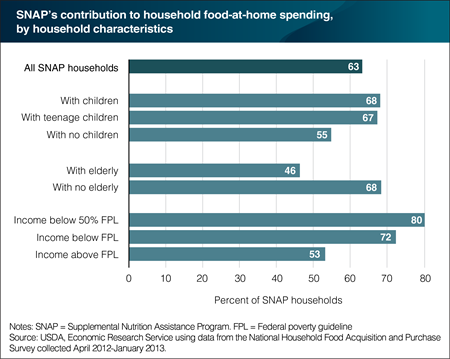
USDA’s Supplemental Nutrition Assistance Program (SNAP) is designed to increase the food purchasing power of program participants. The program provides low-income households with monthly benefits for purchasing food from authorized food stores (referred to as “food at home”). A recent ERS study found that SNAP benefits accounted for 63 percent of the average food-at-home spending of SNAP households in 2012, with households using other resources, such as their own income or benefits from other programs, to pay for the remaining 37 percent. SNAP’s contribution to food-at-home spending was higher than the average for SNAP households with children, those with no elderly members, and those in poverty. SNAP is designed so that benefits increase with household size and decrease with income, and households with lowest incomes per household member receive higher SNAP benefits. SNAP benefits accounted for 80 percent of food-at-home spending of SNAP households with incomes below 50 percent of the Federal poverty guidelines in 2012. This chart appears in the ERS report, Food Spending Patterns of Households Participating in the Supplemental Nutrition Assistance Program: Findings from USDA’s FoodAPS, August 2017.
Monday, September 18, 2017
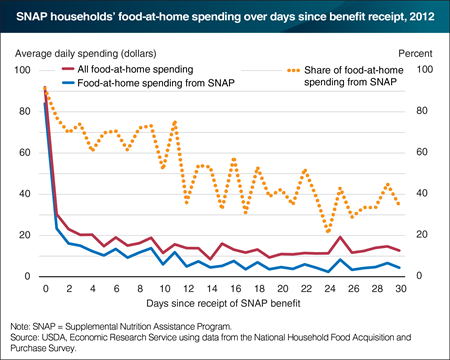
A growing number of studies find that households that participate in the Supplemental Nutrition Assistance Program (SNAP) have cyclical food purchasing patterns. A large share of these households’ grocery store (food at home) spending occurs soon after the household receives its SNAP benefits, and then declines steadily throughout the rest of the month. ERS researchers, using data from USDA’s National Household Food Acquisition and Purchase Survey (FoodAPS), found a similar monthly pattern. SNAP households spent an average of $92 on food at home on the day of benefit receipt in 2012, almost all of which was purchased with SNAP benefits. Over the rest of the month, average daily food-at-home spending ranged from $9 to $30 per day, and the share of food-at-home spending from SNAP benefits trended downward over the month. SNAP households may be able to smooth their food consumption over the month by slowly drawing down their food stores over the course of the month. However, other studies have found that SNAP participants consume fewer calories and that diet quality decreases toward the end of the month. This chart appears in "USDA’s FoodAPS: Providing Insights Into U.S. Food Demand and Food Assistance Programs" in ERS’s Amber Waves magazine, August 2017.
Thursday, August 17, 2017
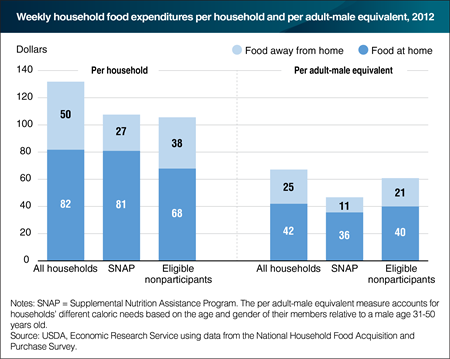
USDA’s Supplemental Nutrition Assistance Program (SNAP) is designed to increase the food purchasing power of low-income households. In fiscal 2016, the program provided participating households with monthly benefits averaging $255—about $59 a week—to purchase food at authorized foodstores. Analysis of USDA’s National Household Food Acquisition and Purchase Survey (FoodAPS) data revealed that the average SNAP household spent $108 per week on food in 2012, below the $132 average U.S. weekly food spending and similar to the $106 spent on food by eligible nonparticipants. SNAP households, however, are larger and contain more children and fewer elderly members than eligible nonparticipating households. ERS researchers adjusted for household size and composition by converting household weekly food spending into adult-male equivalents—essentially a per person measure that accounts for differing caloric needs based on age and gender. On an adult-male equivalent basis, weekly food spending by SNAP households was $47 compared with the $61 spent by those who are eligible for SNAP but chose not to participate. SNAP households spent less on both food from grocery stores and from eating out places than all U.S. households and eligible nonparticipants. The data for this chart come from the ERS report, Food Spending Patterns of Households Participating in the Supplemental Nutrition Assistance Program: Findings from USDA’s FoodAPS, released on August 16, 2017.
Monday, June 26, 2017
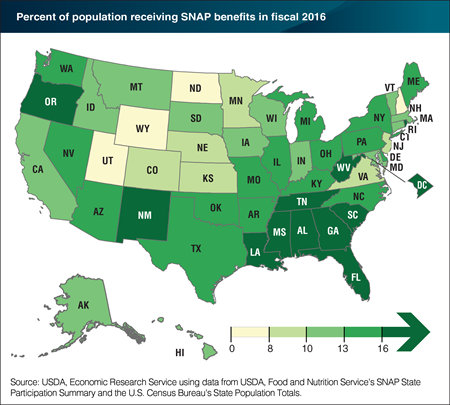
USDA’s Supplemental Nutrition Assistance Program (SNAP) served an average of 44.2 million people per month in fiscal 2016. The percent of Americans participating in the program declined from 15.0 in 2013 to 13.7 in 2016, marking the third consecutive year of a decline in the percent of the population receiving SNAP. Between 2015 and 2016, 41 States and the District of Columbia saw a decrease in the percent of residents receiving SNAP benefits, while 9 States experienced no change or increases. The percent of State populations receiving SNAP benefits ranged from a low of 5.8 in Wyoming to a high of 22.6 in New Mexico, reflecting differences in need and in program policies. Southeastern States have a particularly high share of residents receiving SNAP benefits, with participation rates of 15.0 to 19.5 percent. Kentucky had the largest decline from 2015 to 2016, with the percent of residents receiving SNAP decreasing from 17.4 to 15.0 percent. This chart appears in ERS’s Selected charts Ag and Food Statistics: Charting the Essentials, 2017, April 2017.
Wednesday, April 19, 2017
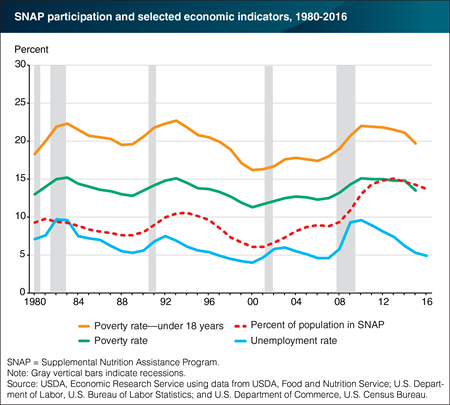
USDA’s Supplemental Nutrition Assistance Program (SNAP) is the Nation’s largest food assistance program. In an average month in fiscal 2016, 44.2 million people—about 14 percent of the Nation’s population—participated in the program. Unlike other food and nutrition assistance programs that target specific groups, SNAP is available to most needy households with limited income and assets, subject to certain work and immigration status requirements. As a means-tested program, the number of people eligible for SNAP is inherently linked to the health of the economy. The share of the population receiving SNAP benefits generally tracks the poverty rate and, to lesser degrees, the unemployment rate and the poverty rate for children under age 18. Improvement in economic conditions during the early stage of recovery may take longer to be felt by lower educated, lower wage workers who are more likely to receive SNAP benefits, resulting in a lagged response of SNAP participation to a reduction in the unemployment rate. This chart appears in the ERS report, The Food Assistance Landscape, FY 2016 Annual Report, released on March 30, 2017.
Wednesday, April 5, 2017
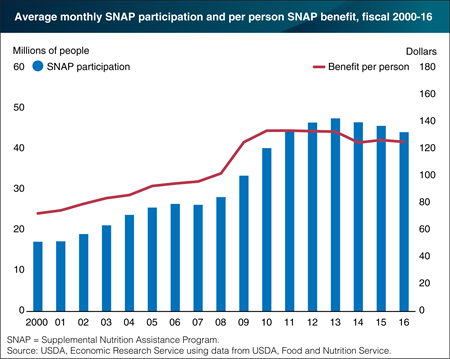
The Supplemental Nutrition Assistance Program (SNAP) is the cornerstone of USDA’s food and nutrition assistance programs, accounting for 69 percent of all Federal food and nutrition assistance spending in fiscal 2016. An average 44.2 million people per month participated in the program in fiscal 2016, 3 percent fewer than the previous fiscal year and the third consecutive year of declining participation. Fiscal 2016’s caseload was the fewest SNAP participants since fiscal 2010 and 7 percent less than the 47.6 million participants per month in fiscal 2013. The decrease in 2016 was likely due in part to the country’s continued economic growth as well as the reinstatement in many States of the time limit—3 months of SNAP benefits within any 3-year period—on participation for able-bodied adults without dependents. Per person benefits averaged $125.51 per month in fiscal 2016, 1 percent less than the previous fiscal year and 6 percent less than the historical high of $133.85 set in fiscal 2011. This chart appears in the ERS report, The Food Assistance Landscape: FY 2016 Annual Report, released on March 30, 2017.
Tuesday, March 14, 2017
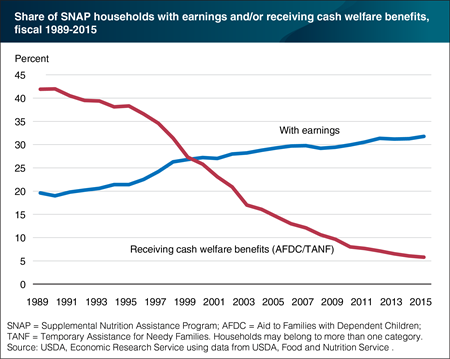
USDA’s Supplemental Nutrition Assistance Program (SNAP) serves a large and diverse population of low-income households. In a typical month in fiscal 2015, SNAP provided average monthly benefits of $127 per person to 45.8 million people living in 22.5 million households. Increasingly, SNAP is serving a larger share of households where one or more members are employed. Between fiscal 1989 and 2015, the share of SNAP households with earnings rose from 19.6 percent to 31.8 percent. In contrast, the percent of those receiving cash welfare (AFDC/TANF) declined from 41.9 percent to 5.8 percent over the same period. In fiscal 2015, 54.9 percent of households with children had some earned income, while 7.4 percent of households with elderly individuals and 10.7 percent of households with non-elderly individuals with disabilities had earnings. In fiscal 2015, 63.8 percent of SNAP households relied on income sources other than earnings and TANF benefits. These income sources include Supplemental Security Income (SSI), Social Security, unemployment insurance, General Assistance, child support, and/or pensions. SNAP households may also receive non-cash assistance such as housing and medical care. The data for this chart are from the Supplemental Nutrition Assistance Program (SNAP) topic page on the ERS Web site.
Friday, March 10, 2017
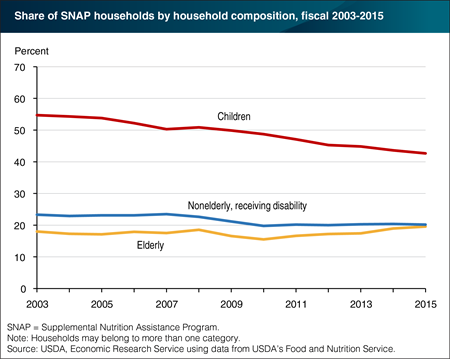
In fiscal 2015, USDA’s Supplemental Nutrition Assistance Program (SNAP) provided 22.5 million low-income U.S. households with monthly benefits to supplement their resources for buying food. Of these households, 42.7 percent had children, 20.2 percent had a nonelderly member receiving disability benefits, and 19.6 percent contained an elderly person. The share of SNAP households with children is down from 54.7 percent in 2003, while the shares of SNAP households with an elderly member or a nonelderly member receiving Federal or State disability benefits have remained relatively constant. The fall in the share of SNAP households with children may reflect the increase in participation of households without children due to the tough economic times that accompanied the 2007-09 recession and policy changes that allowed more non-child households to be eligible for SNAP. This chart appears in the Supplemental Nutrition Assistance Program (SNAP) topic page on the ERS website, updated on February 16, 2017.
Monday, December 19, 2016
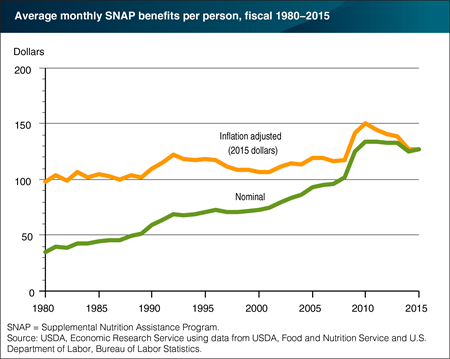
USDA’s Supplemental Nutrition Assistance Program (SNAP) provides low-income households with monthly benefits to supplement their resources for purchasing food. The amount of benefits provided increases with household size and decreases with household income. Between 1980 and 2015, average monthly benefits grew from $35 per person to $127 per person. Much of this increase reflects the fact that SNAP benefit levels are updated annually for inflation, so that rising food prices do not erode the purchasing power of the benefits. However, even when monthly benefits per person are adjusted for inflation, average benefits rise and fall as the characteristics of SNAP households, such as income, change in response to economic conditions and policy changes. Average monthly SNAP benefits increased from $98 per person in 1980 (measured in 2015 dollars) to $118 in 2008. The 2009 American Recovery and Reinvestment Act (ARRA) provided all recipients with increased SNAP benefits, and average inflation-adjusted SNAP benefits jumped to $142 per person in that year. Benefits climbed to $150 in 2010, before dropping to $127 per person in 2015, as the ARRA benefit increase was phased out and economic conditions improved. This chart appears in the Supplemental Nutrition Assistance Program (SNAP) topic page on the ERS website.
Friday, December 9, 2016
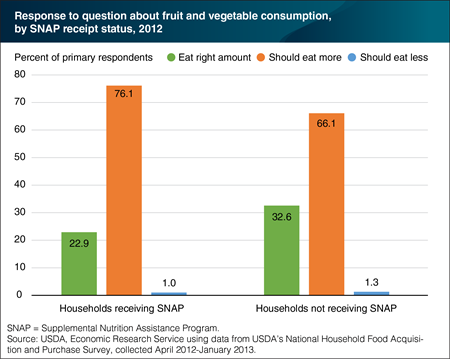
The 2015-2020 Dietary Guidelines for Americans recommends that adult men and women eat between 2 to 3 cups of vegetables per day and 1½ to 2 cups of fruit per day. To help gauge perceived dietary habits, respondents in USDA’s National Household Food Acquisition and Purchase Survey (FoodAPS) were asked a series of questions about their health and diet. When the primary respondents (the main food shopper or meal planner in the household) were asked if they think they eat the right amount of fruits and vegetables or if they should eat more, 76.1 percent of primary respondents in households receiving SNAP benefits said they should eat more. In contrast, 66.1 percent of those who reside in households not receiving SNAP felt they should eat more fruits and vegetables. By better understanding perceived health and dietary habits, food assistance programs may be modified to help Americans follow heathier diets. This chart appears in “FoodAPS Data Now Available to the General Public” in the December 2016 issue of ERS’s Amber Waves magazine.
Wednesday, November 9, 2016
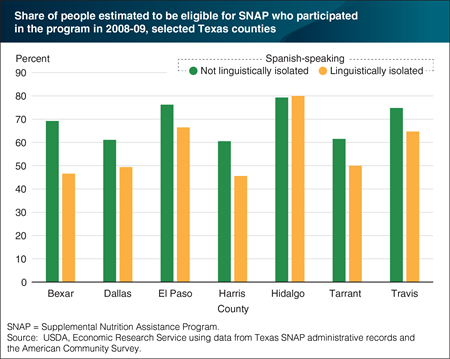
A household’s lack of English proficiency can pose a barrier to the receipt of needed food assistance. The U.S. Census Bureau developed the concept of “linguistic isolation” to measure the numbers and characteristics of households that might have difficulty interacting with government and social services. According to the Census Bureau definition, a household is considered linguistically isolated if all adults speak a language other than English and none speaks English “very well.” Estimates from Texas administrative records for USDA’s Supplemental Nutrition Assistance Program (SNAP) linked to the American Community Survey reveal that in six of Texas’ largest counties, SNAP access rates are typically lower for Spanish-speaking households that are linguistically isolated relative to those that are not (i.e., at least one adult in the household speaks English “very well”). One exception is Hildago County, in which the SNAP access rates for the two groups are roughly equal. County-level estimates like these—generated by linking survey data and administrative records—can provide SNAP administrators with important information about areas in which language barriers or other household characteristics may be linked to lower SNAP participation rates. This chart appears in “Illuminating SNAP Performance Using the Power of Administrative Data” in the November 2016 issue of ERS’s Amber Waves magazine.
Tuesday, September 20, 2016
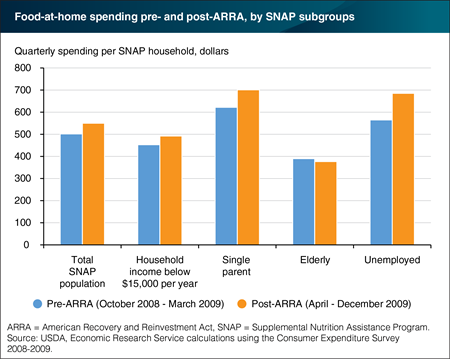
The American Recovery and Reinvestment Act of 2009 (ARRA) was implemented to address the economic crisis following the 2007-09 recession. ARRA temporarily increased benefit levels in USDA’s Supplemental Nutrition Assistance Program (SNAP) and expanded SNAP eligibility for jobless adults without children. A recent ERS report examined the effects of this benefit increase on SNAP households’ food purchases in supermarkets, supercenters, and other food retailers (food at home). Quarterly food-at-home spending by SNAP households rose from an average of $502 per household over October 2008 to March 2009 to $550 after April 2009 when ARRA was implemented. SNAP households with incomes below $15,000 per year, single-parent SNAP households, and SNAP households with an unemployed member increased their food-at-home spending in response to the increased benefit levels. While SNAP benefits can only be used for at-home food purchases, additional benefits can free up cash spent on food for other purchases. The entire benefit increase is generally not spent on food. The ERS analysis found that, on average, SNAP households spent 53 percent of the 2009 ARRA increase on food and the rest on other household needs. This chart appears in the ERS report, The Stimulus Act of 2009 and Its Effect on Food-At-Home Spending by SNAP Participants, released on August 31, 2016.


