
India, a major rice and wheat producer, sharply expands subsidized distribution of food grains in response to pandemic
- by Kayode Ajewole and Nathan Childs
- 11/30/2020
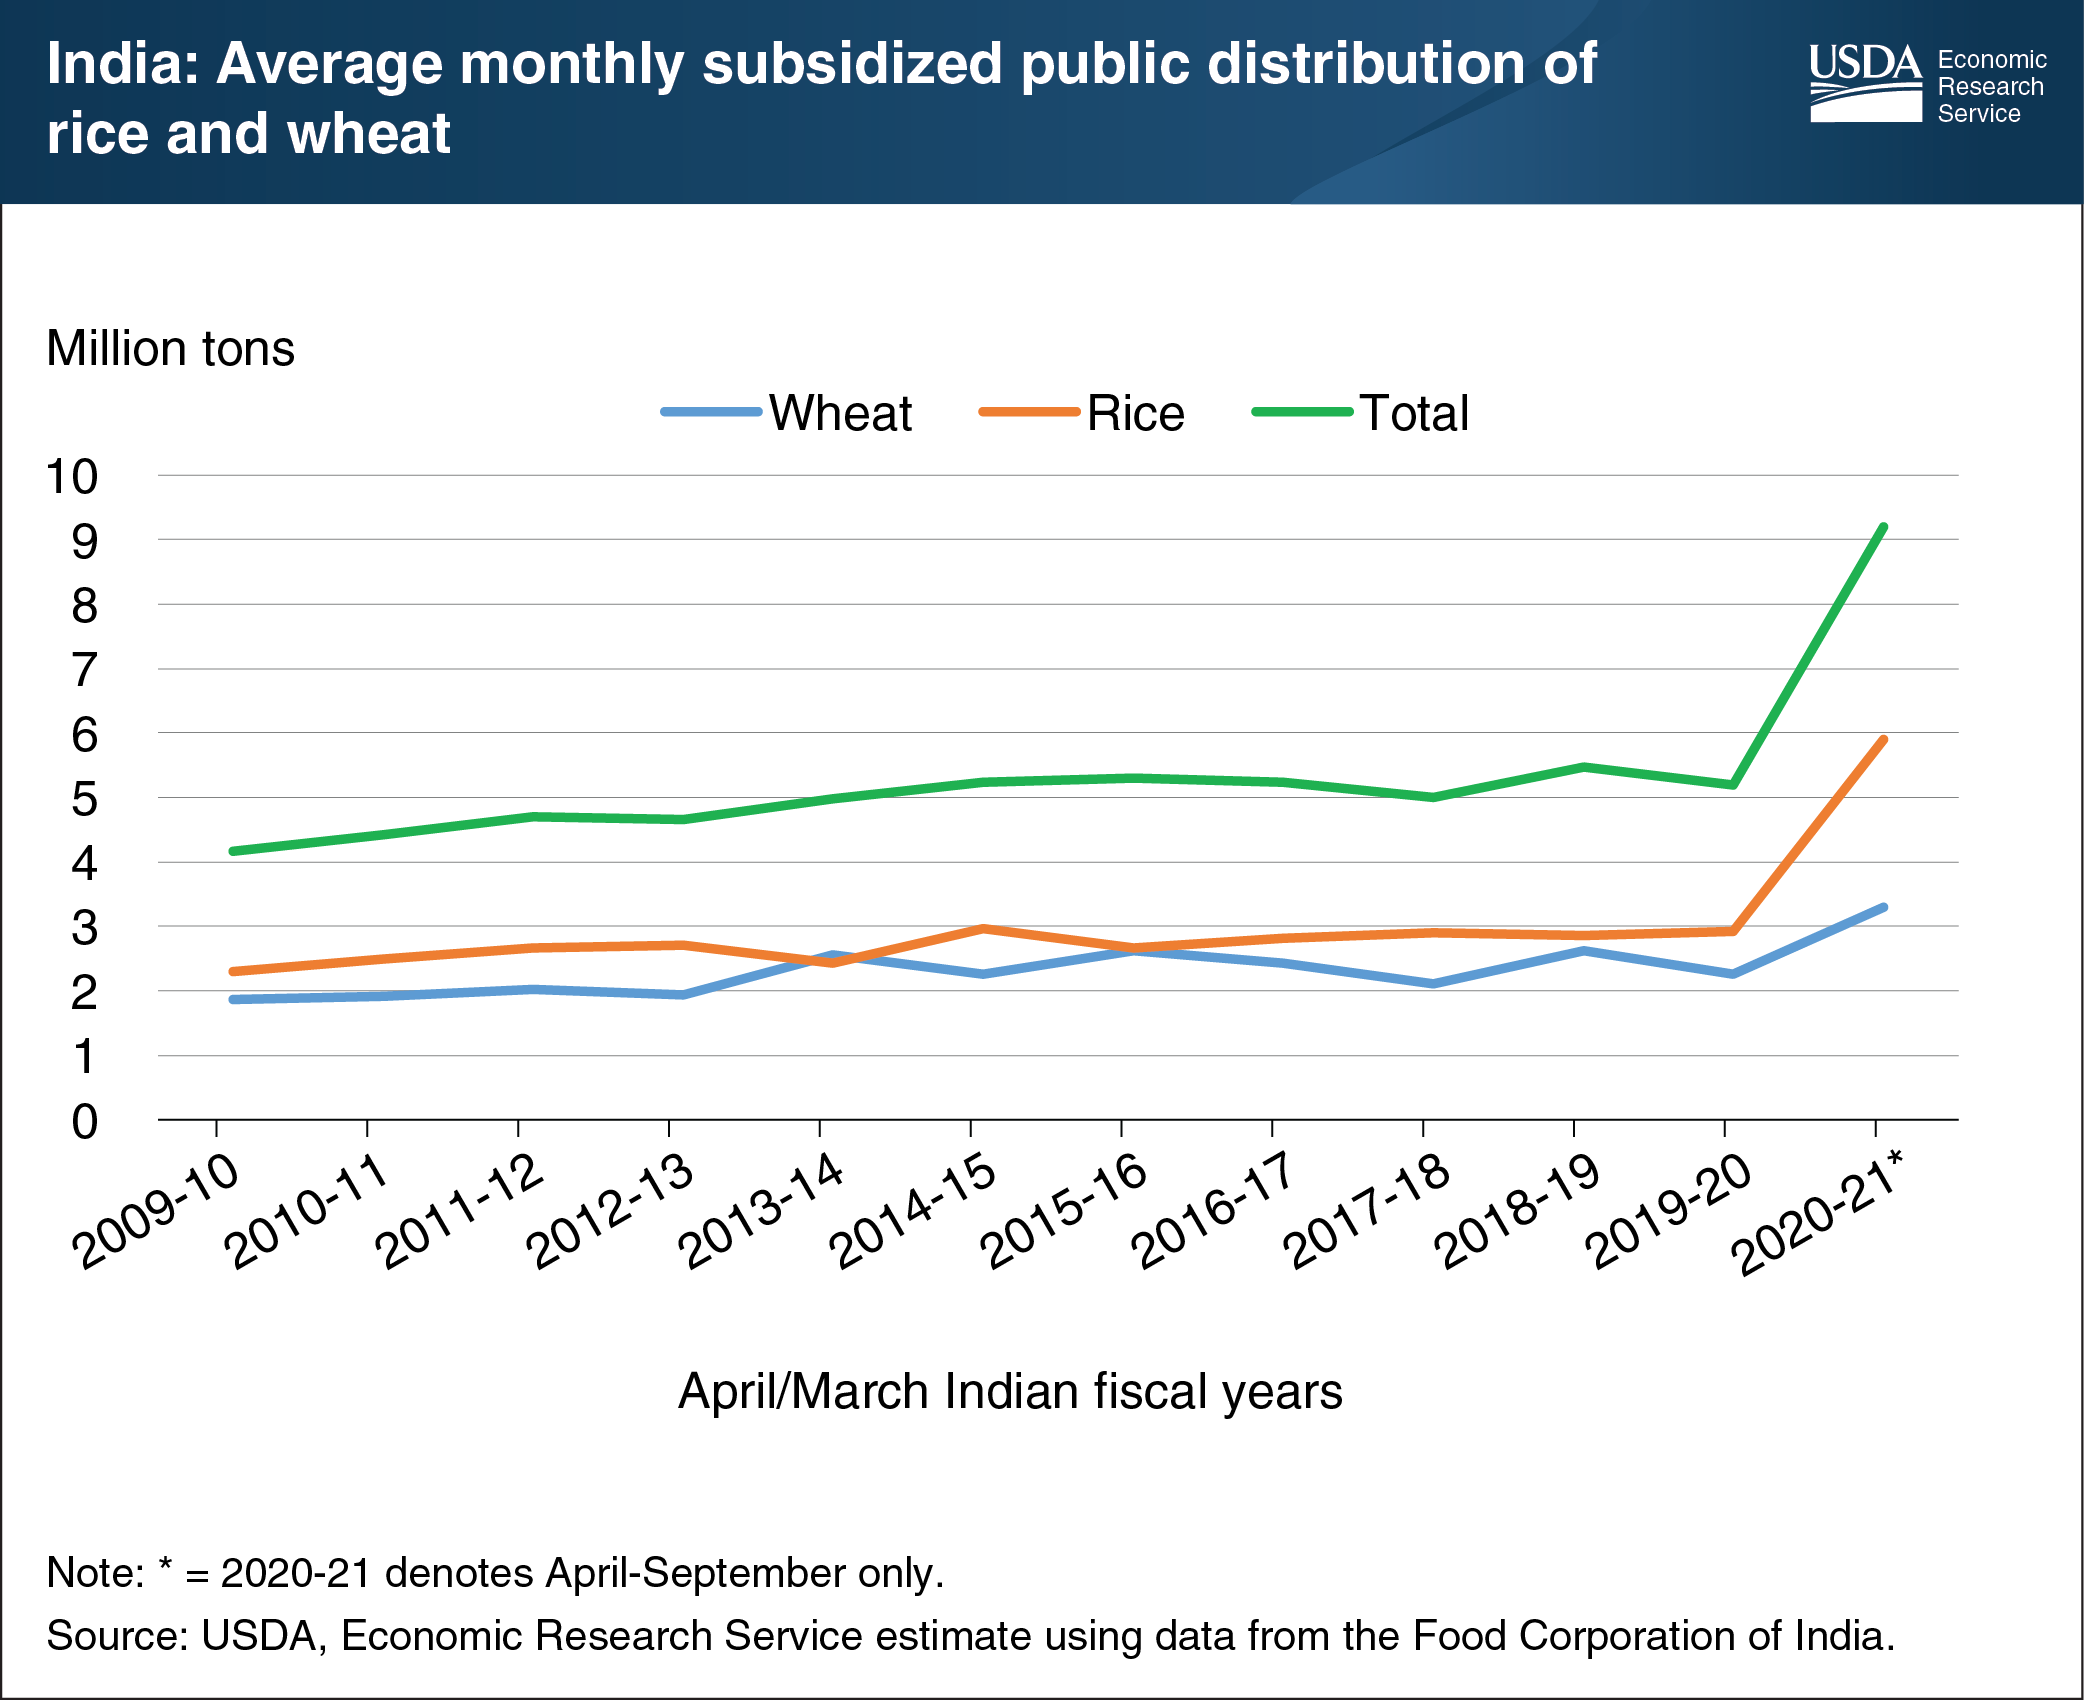
As part of its response to the economic impacts of the COVID-19 pandemic, India has sharply increased its distribution of wheat and rice to the 800 million Indian citizens (about 58 percent of the population) eligible to receive subsidized rations. Facing major shocks to employment and incomes associated with nationwide measures to control the virus, India announced a relief program in March 2020 worth $22.3 billion. The program, now extended through November 2020, supplements the highly subsidized, standard monthly ration of 5 kilograms per person of wheat or rice with an additional free allocation of 5 kilograms. Implementation of the program led to a 75-percent increase in India’s total wheat and rice distribution from April to September compared with earlier years, with the average monthly distribution of rice more than doubling. India is a major global holder of food security stocks of both rice and wheat, as well as the world’s largest rice exporter—with 2021 exports forecast at 12.5 million tons. While India is currently forecast to maintain large surpluses of wheat and rice in government stocks during the October 2020-September 2021 marketing year, the sharp increase in subsidized domestic distribution has the potential to substantially reduce those food security stocks if the COVID-19 relief program is extended beyond November 2020 into the 2020-21 marketing year. This chart was drawn from the Economic Research Service’s Rice and Wheat Outlooks, November 2020.