
Popularity of sweet potatoes, a Thanksgiving staple, continues to grow
- by Andrzej Blazejczyk
- 11/24/2020
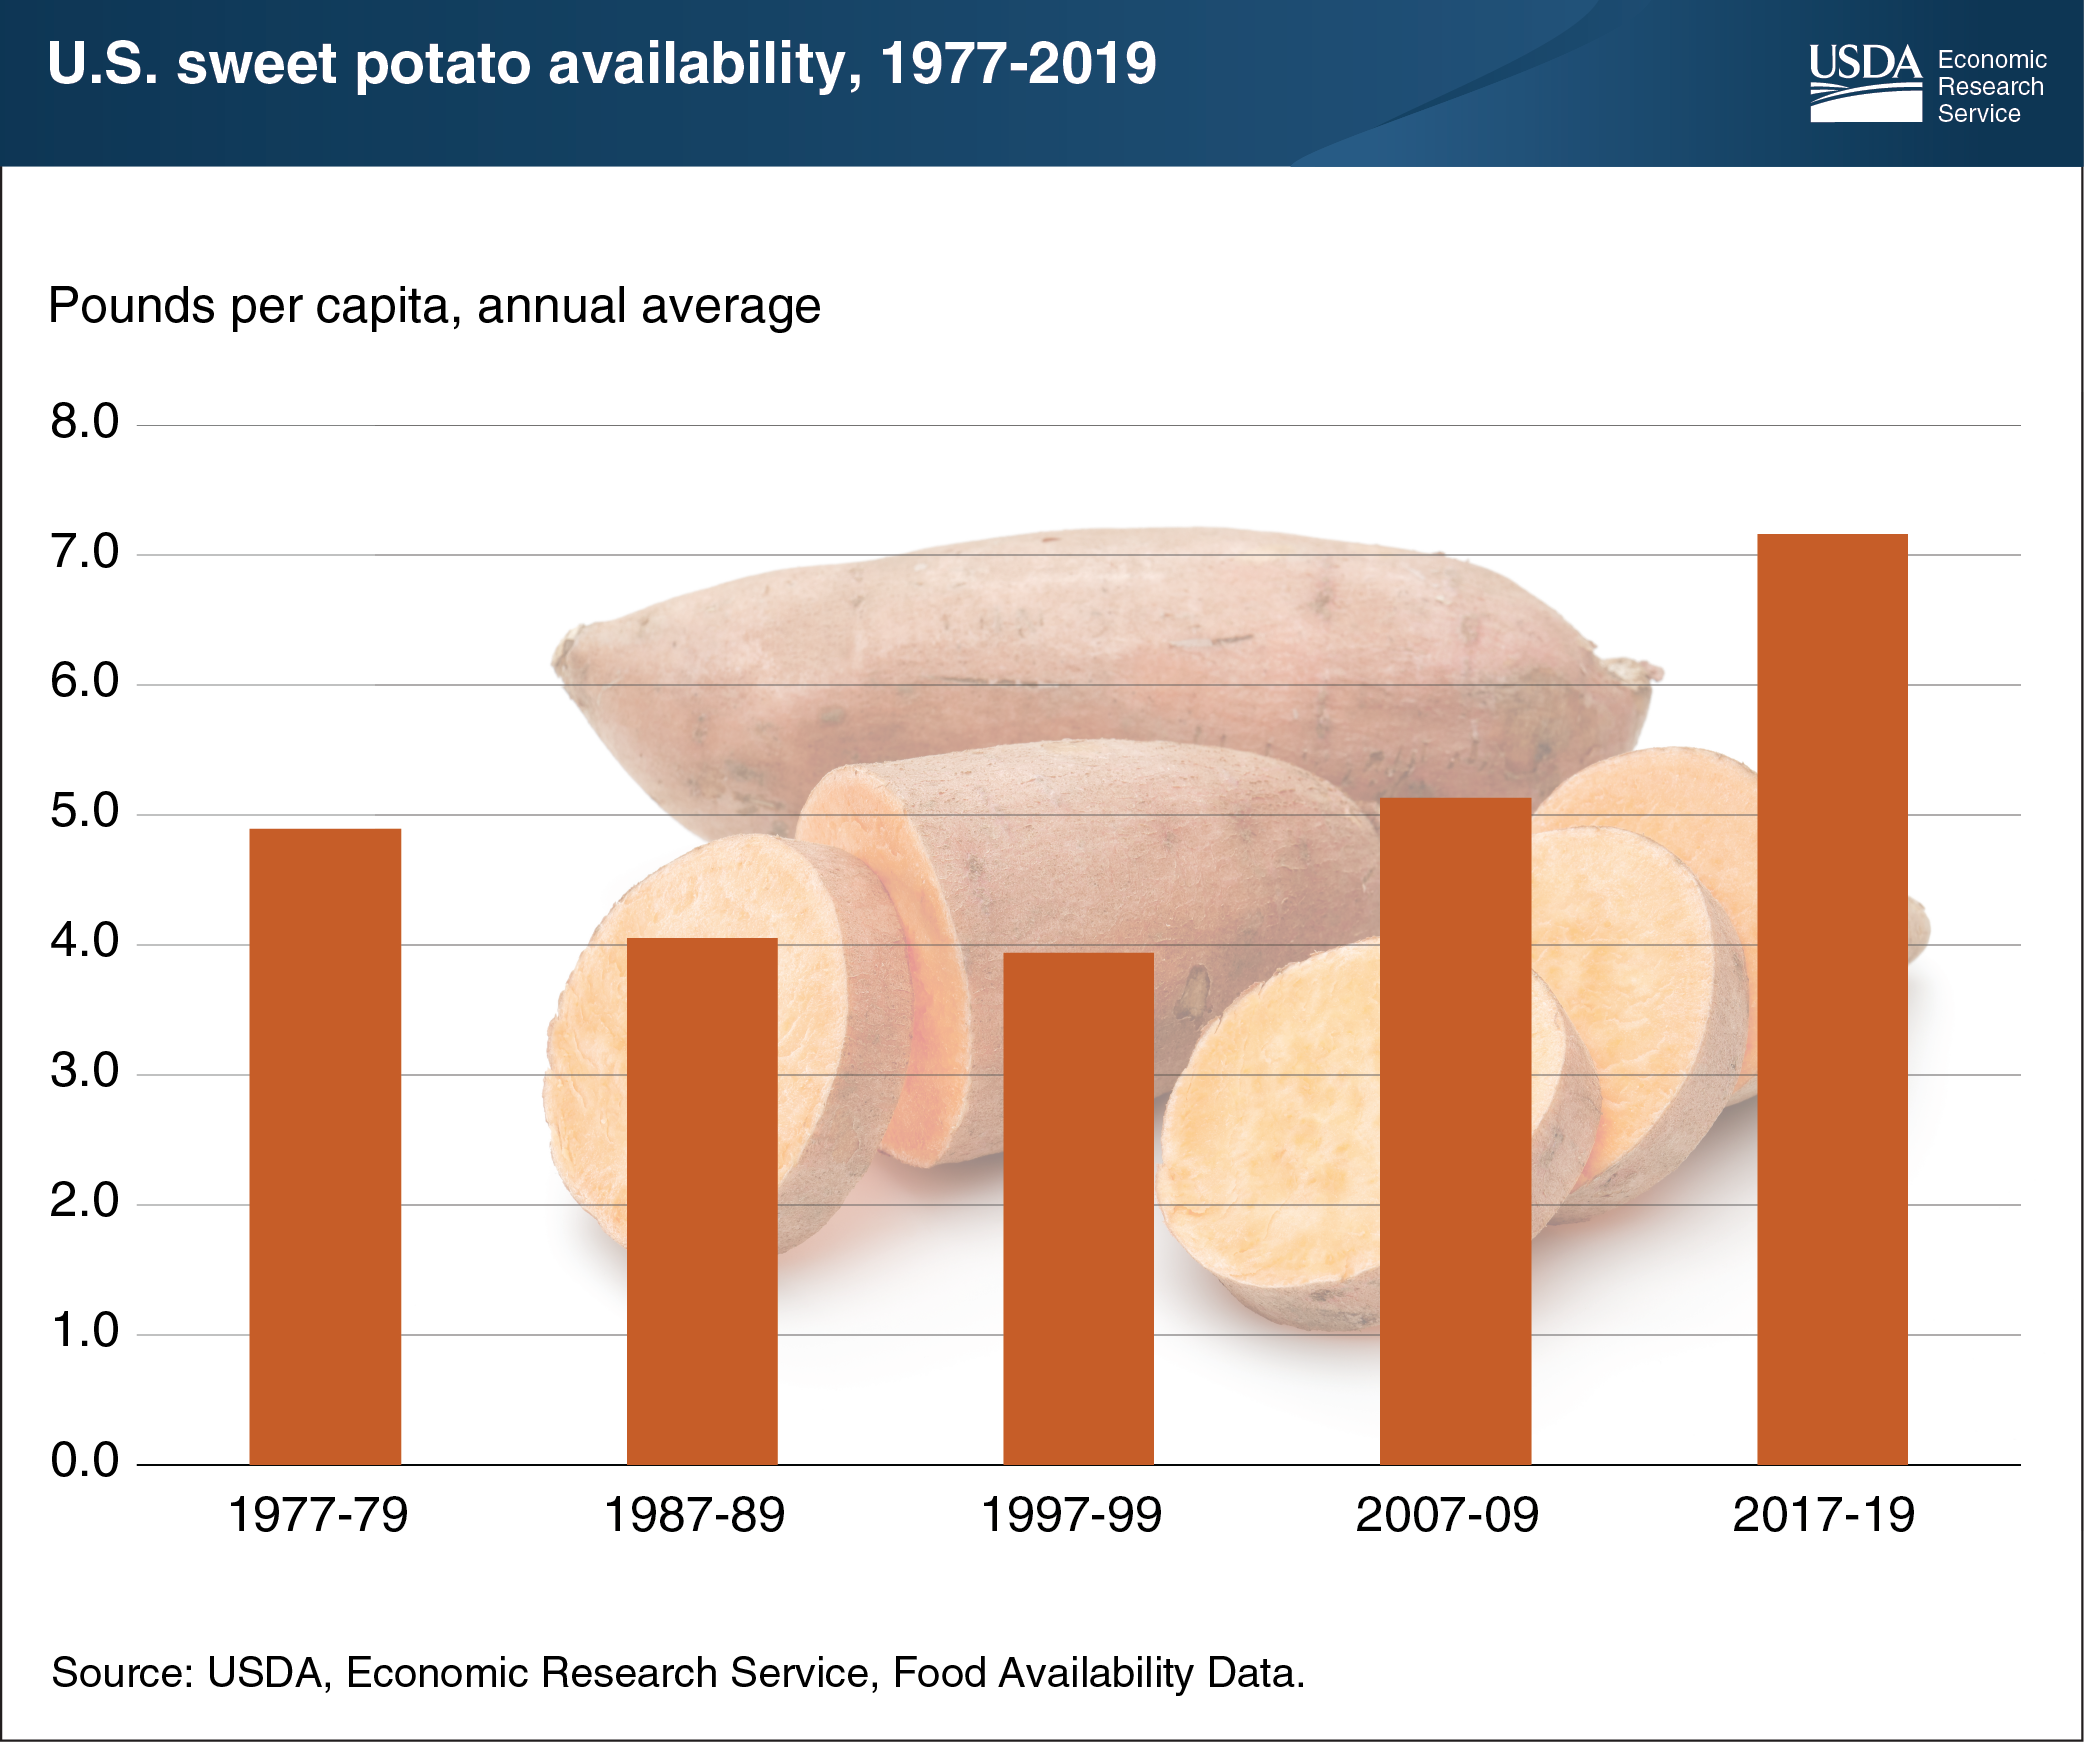
If sweet potatoes are on your Thanksgiving menu this year, you are not alone. According to the Economic Research Service’s (ERS) food availability data, supplies of sweet potatoes available for U.S. consumers to eat averaged 7.2 pounds per capita per year in 2017-19, up from an average 3.9 pounds in 1997-99. Availability is calculated by adding domestic production, initial inventories, and imports, then subtracting exports and end-of-year inventories. These national supplies are then divided by the U.S. population to estimate per capita availability. Consumer interest in nutrition and food companies expanding their sweet potato-based offerings, such as sweet potato fries, may be contributors to the rise in sweet potato availability. Sweet potatoes are high in vitamin A and vitamin C. A cup of boiled sweet potatoes without the skin (and without any added fats or marshmallow toppings) contains 249 calories and 287 percent of the daily recommended amount of vitamin A, 47 percent of vitamin C, and 29 percent of dietary fiber for a 2,000 calories-per-day diet. This chart uses data from ERS’s Food Availability (Per Capita) Data System.