
Farm production expenses forecast to decrease in 2020, the sixth year in a row
- by Okkar Mandalay and Carrie Litkowski
- 11/2/2020
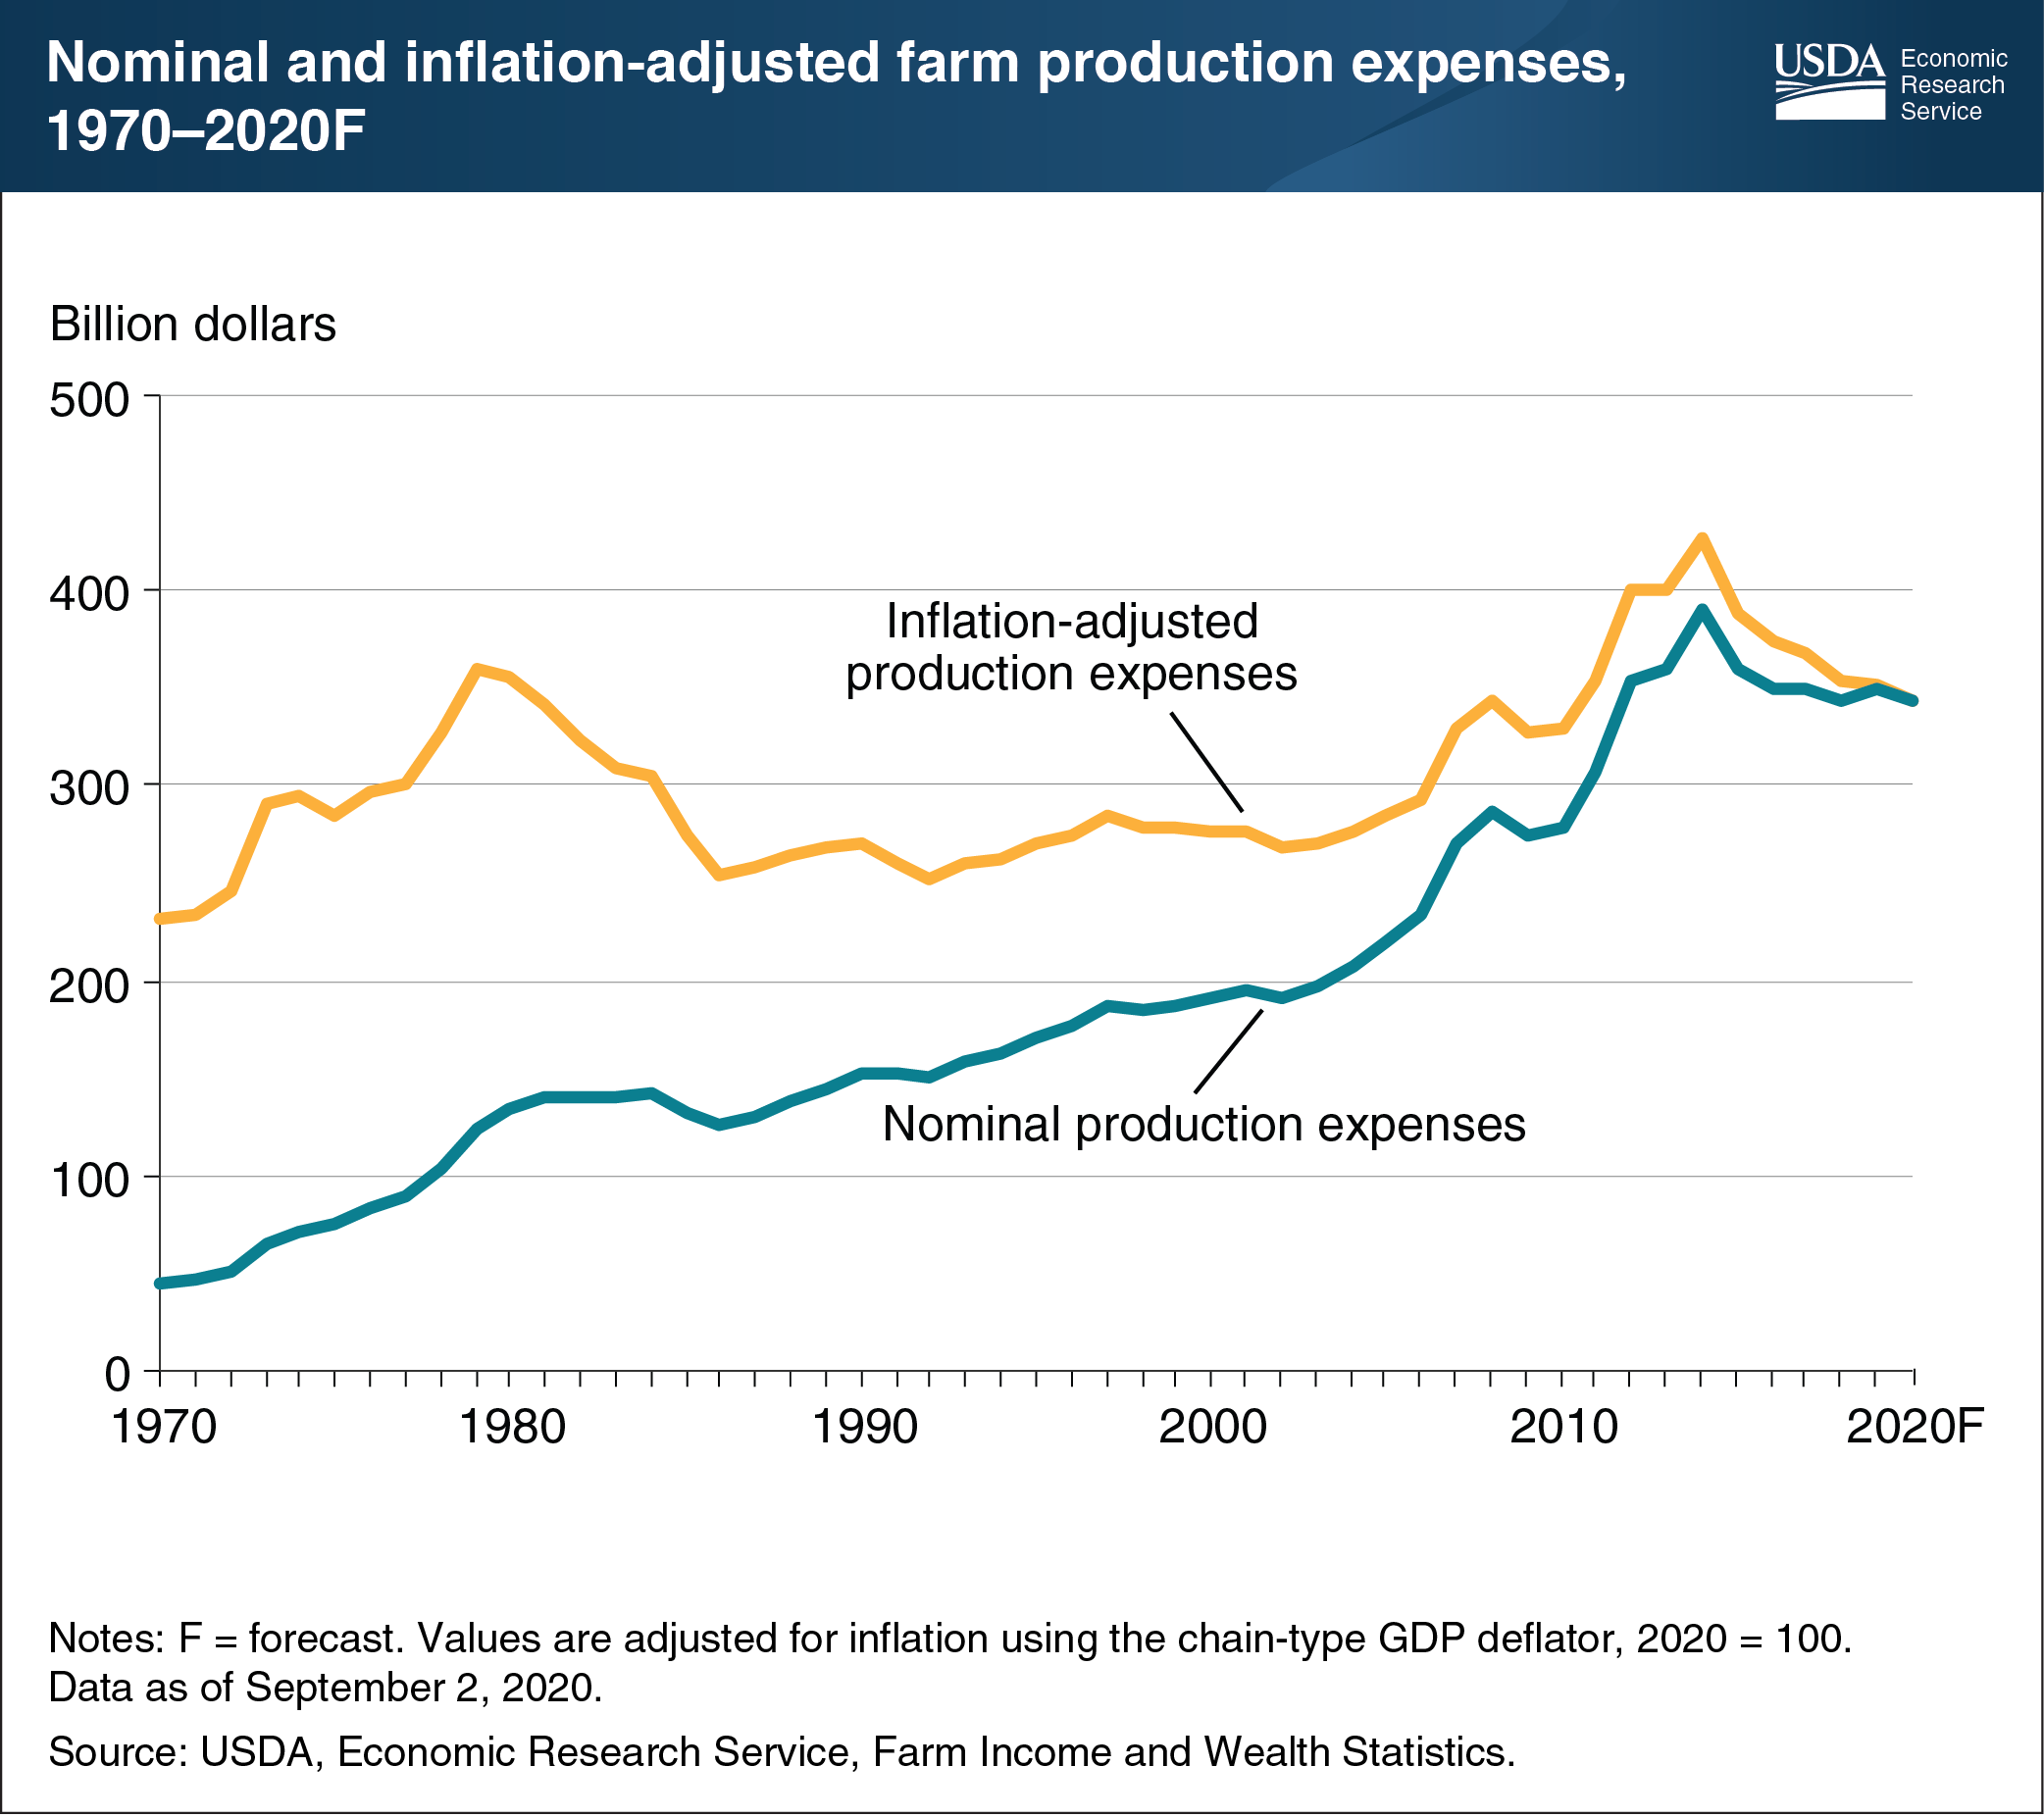
Farm sector production expenses (including expenses associated with operator dwellings) are forecast to decrease by $4.6 billion (1.3 percent) to $344.2 billion in 2020 in nominal terms, i.e. not adjusted for inflation. These expenses represent the costs of all inputs used to produce farm commodities and strongly affect farm profitability. Although overall production expenses are expected to decrease, changes in specific expenses vary. Specific expenses forecast to increase in 2020 account for approximately 69 percent of total expenses and are projected to collectively rise by $6.0 billion relative to 2019 before adjusting for inflation. These include the two largest expense categories—feed purchases (1.4 percent increase from 2019) and cash labor (3.1 percent). In contrast, expenses expected to decrease account for 31 percent of total expenses and are forecast to collectively decline by $10.6 billion from 2019 to 2020. Specifically, livestock and poultry purchases are anticipated to decrease by 7.5 percent, pesticides by 2.1 percent, and oil and fuel spending by 13.9 percent. In addition, interest expenses are forecast to be at their lowest level since 2014 (not adjusted for inflation), dropping by 27.1 percent ($5.6 billion) from 2019 as a result of historically low interest rates. After adjusting for inflation, total production expenses in 2020 are 19 percent below the record high of $427.1 billion in 2014, continuing a six-year streak of declining expenses. This chart appears in the ERS topic page for Farm Sector Income and Finances, updated September 2020.