

Counties with low educational attainment were concentrated in rural areas
- by Tracey Farrigan
- 7/13/2020
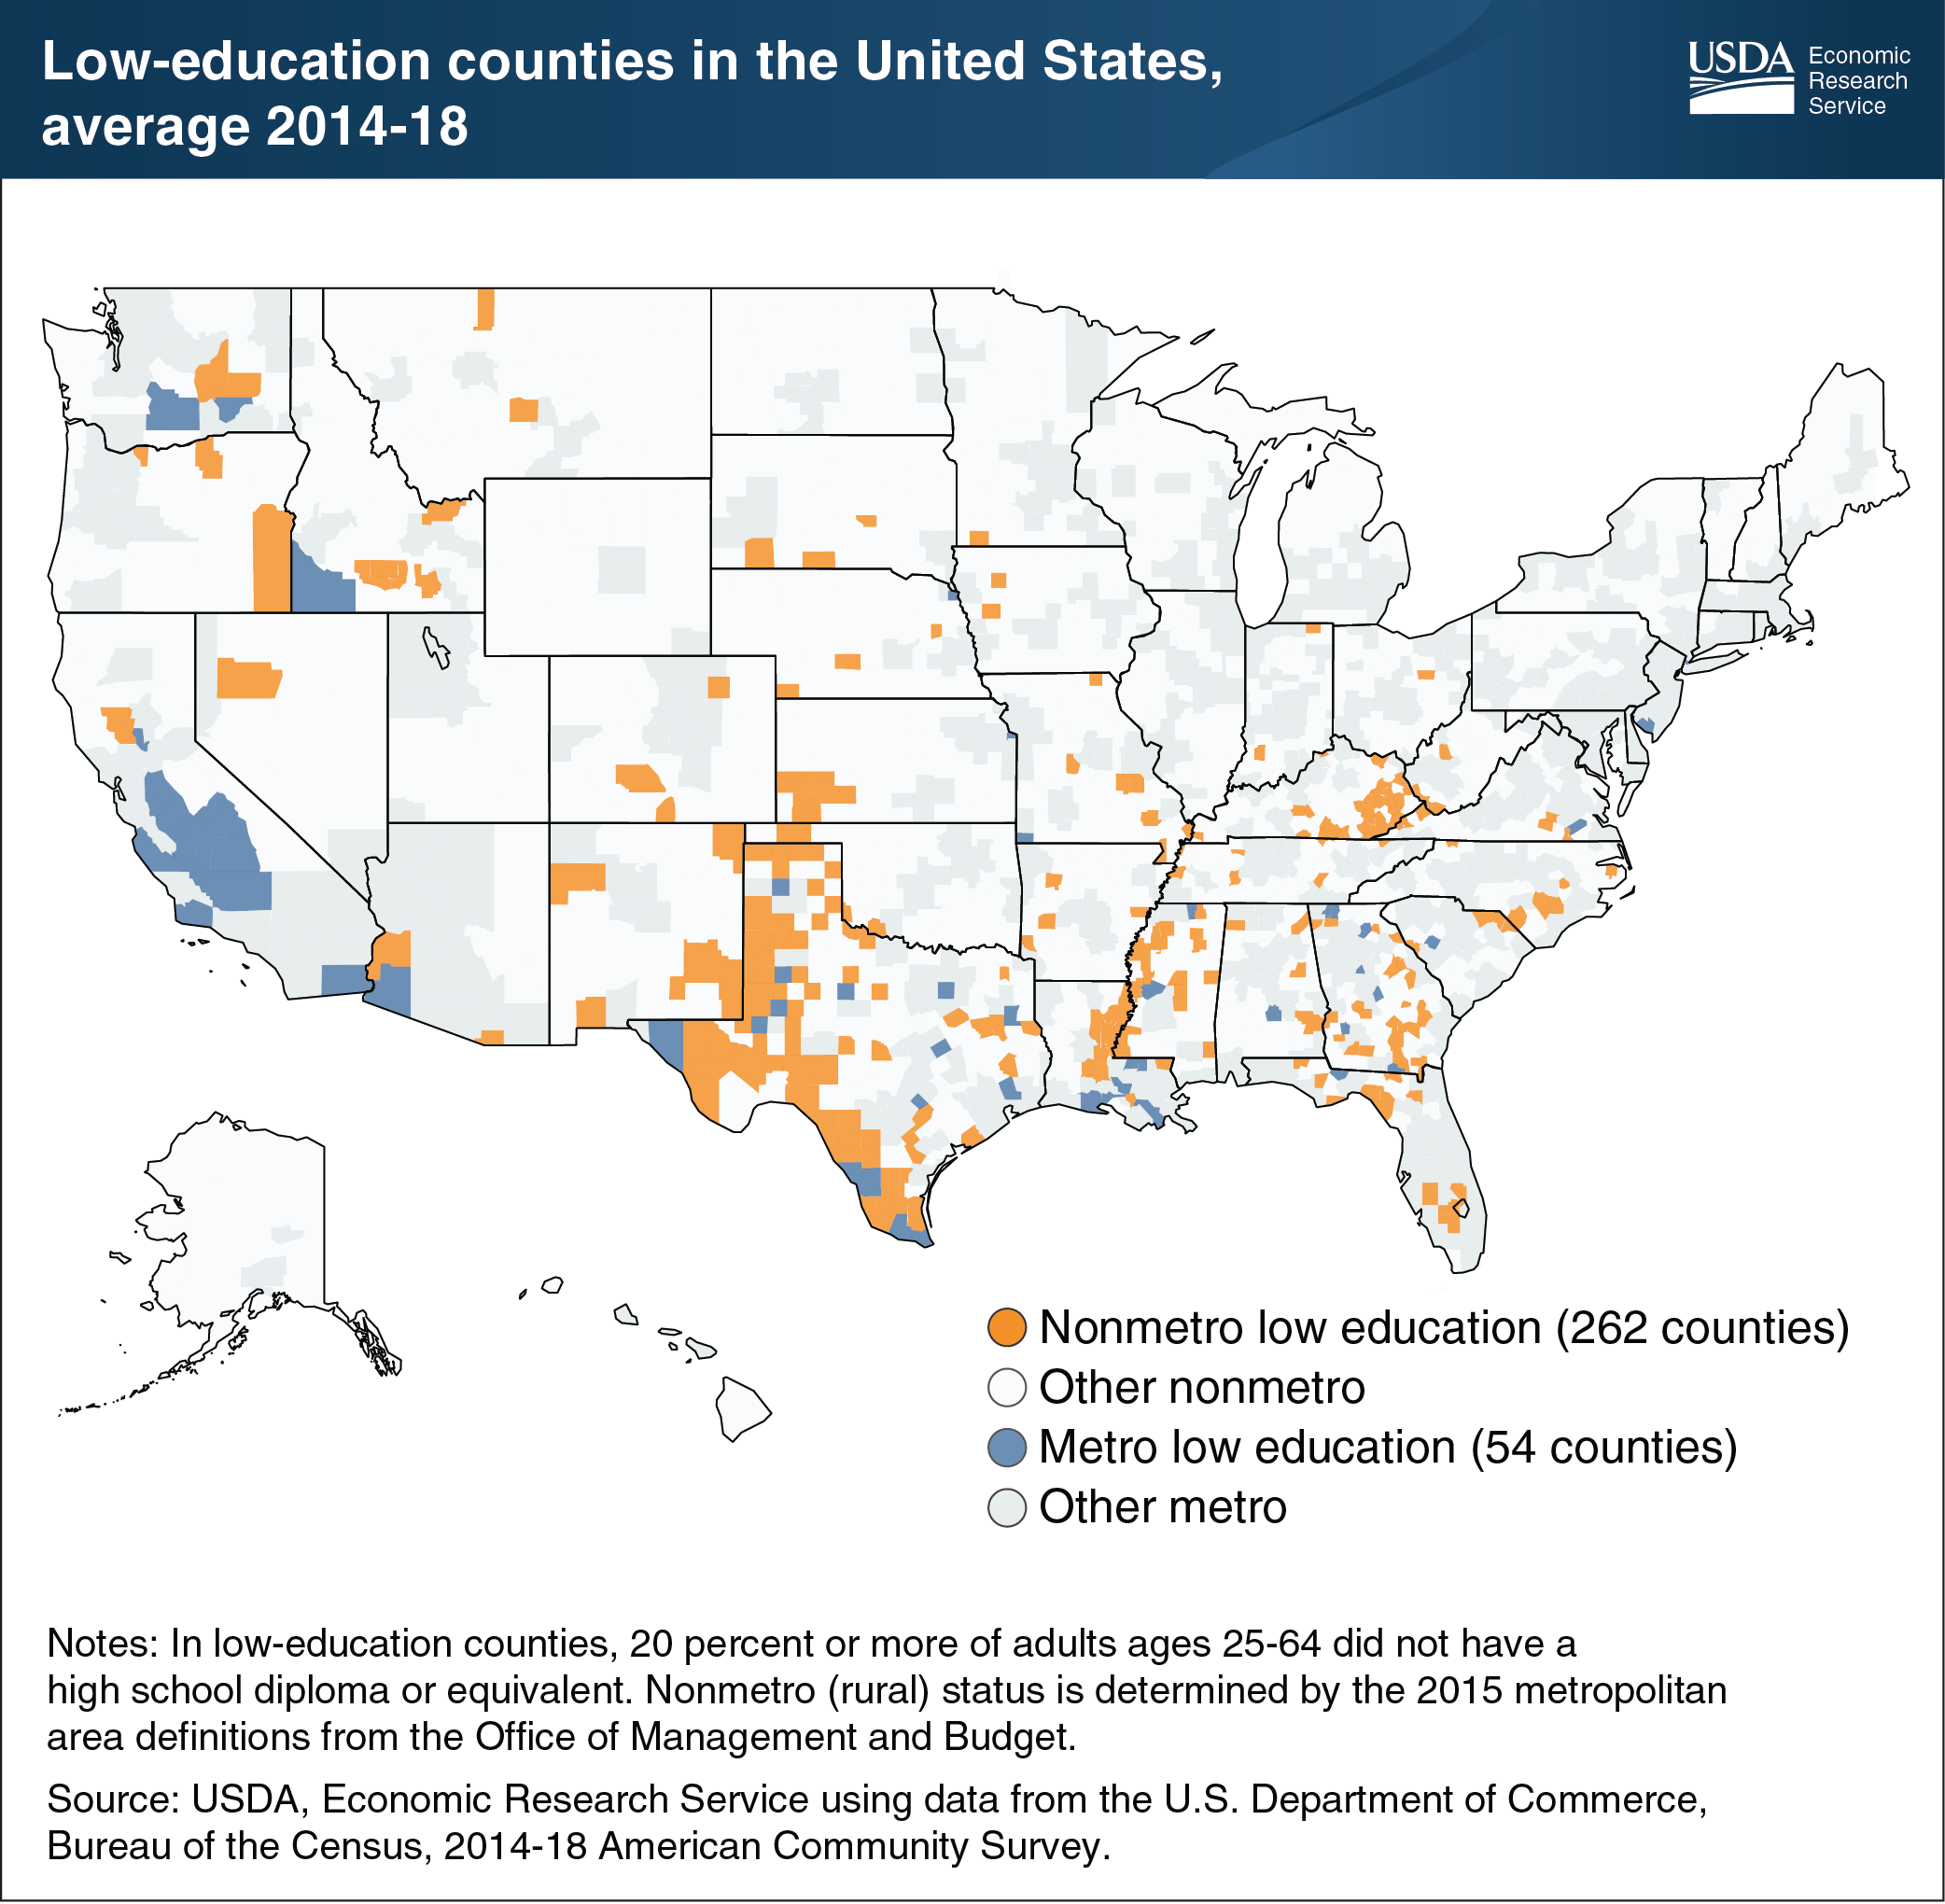
Between 2014 and 2018, the United States had 316 counties with low levels of educational attainment, meaning 20 percent or more of working-age adults (ages 25-64) living in the county lacked a high school diploma or equivalent. The majority of those counties—about 4 out of 5—were in rural (nonmetro) areas. Low-education rural counties were predominantly in the South (nearly 80 percent or 208 counties) and the economies of more than one-third (116 counties) relied on farming or manufacturing. Nearly half (156 counties) were high poverty counties, with a poverty rate of 20 percent or more, and most of those counties (113 counties) also had persistently high poverty over three or more decades. In addition, almost 60 percent of low-education rural counties were in areas where African Americans alone (70 counties) or Hispanics of any race (115 counties) accounted for 20 percent or more of the total population. In these counties, the low-education rates for African Americans or Hispanics were substantially higher than corresponding rates for white (non-Hispanic) individuals. This chart appears on the ERS topic page for Rural Education, updated May 2020.