
Highest U.S. poverty rates are in the South, with over 20 percent poor in its rural areas
- by Tracey Farrigan
- 3/13/2020
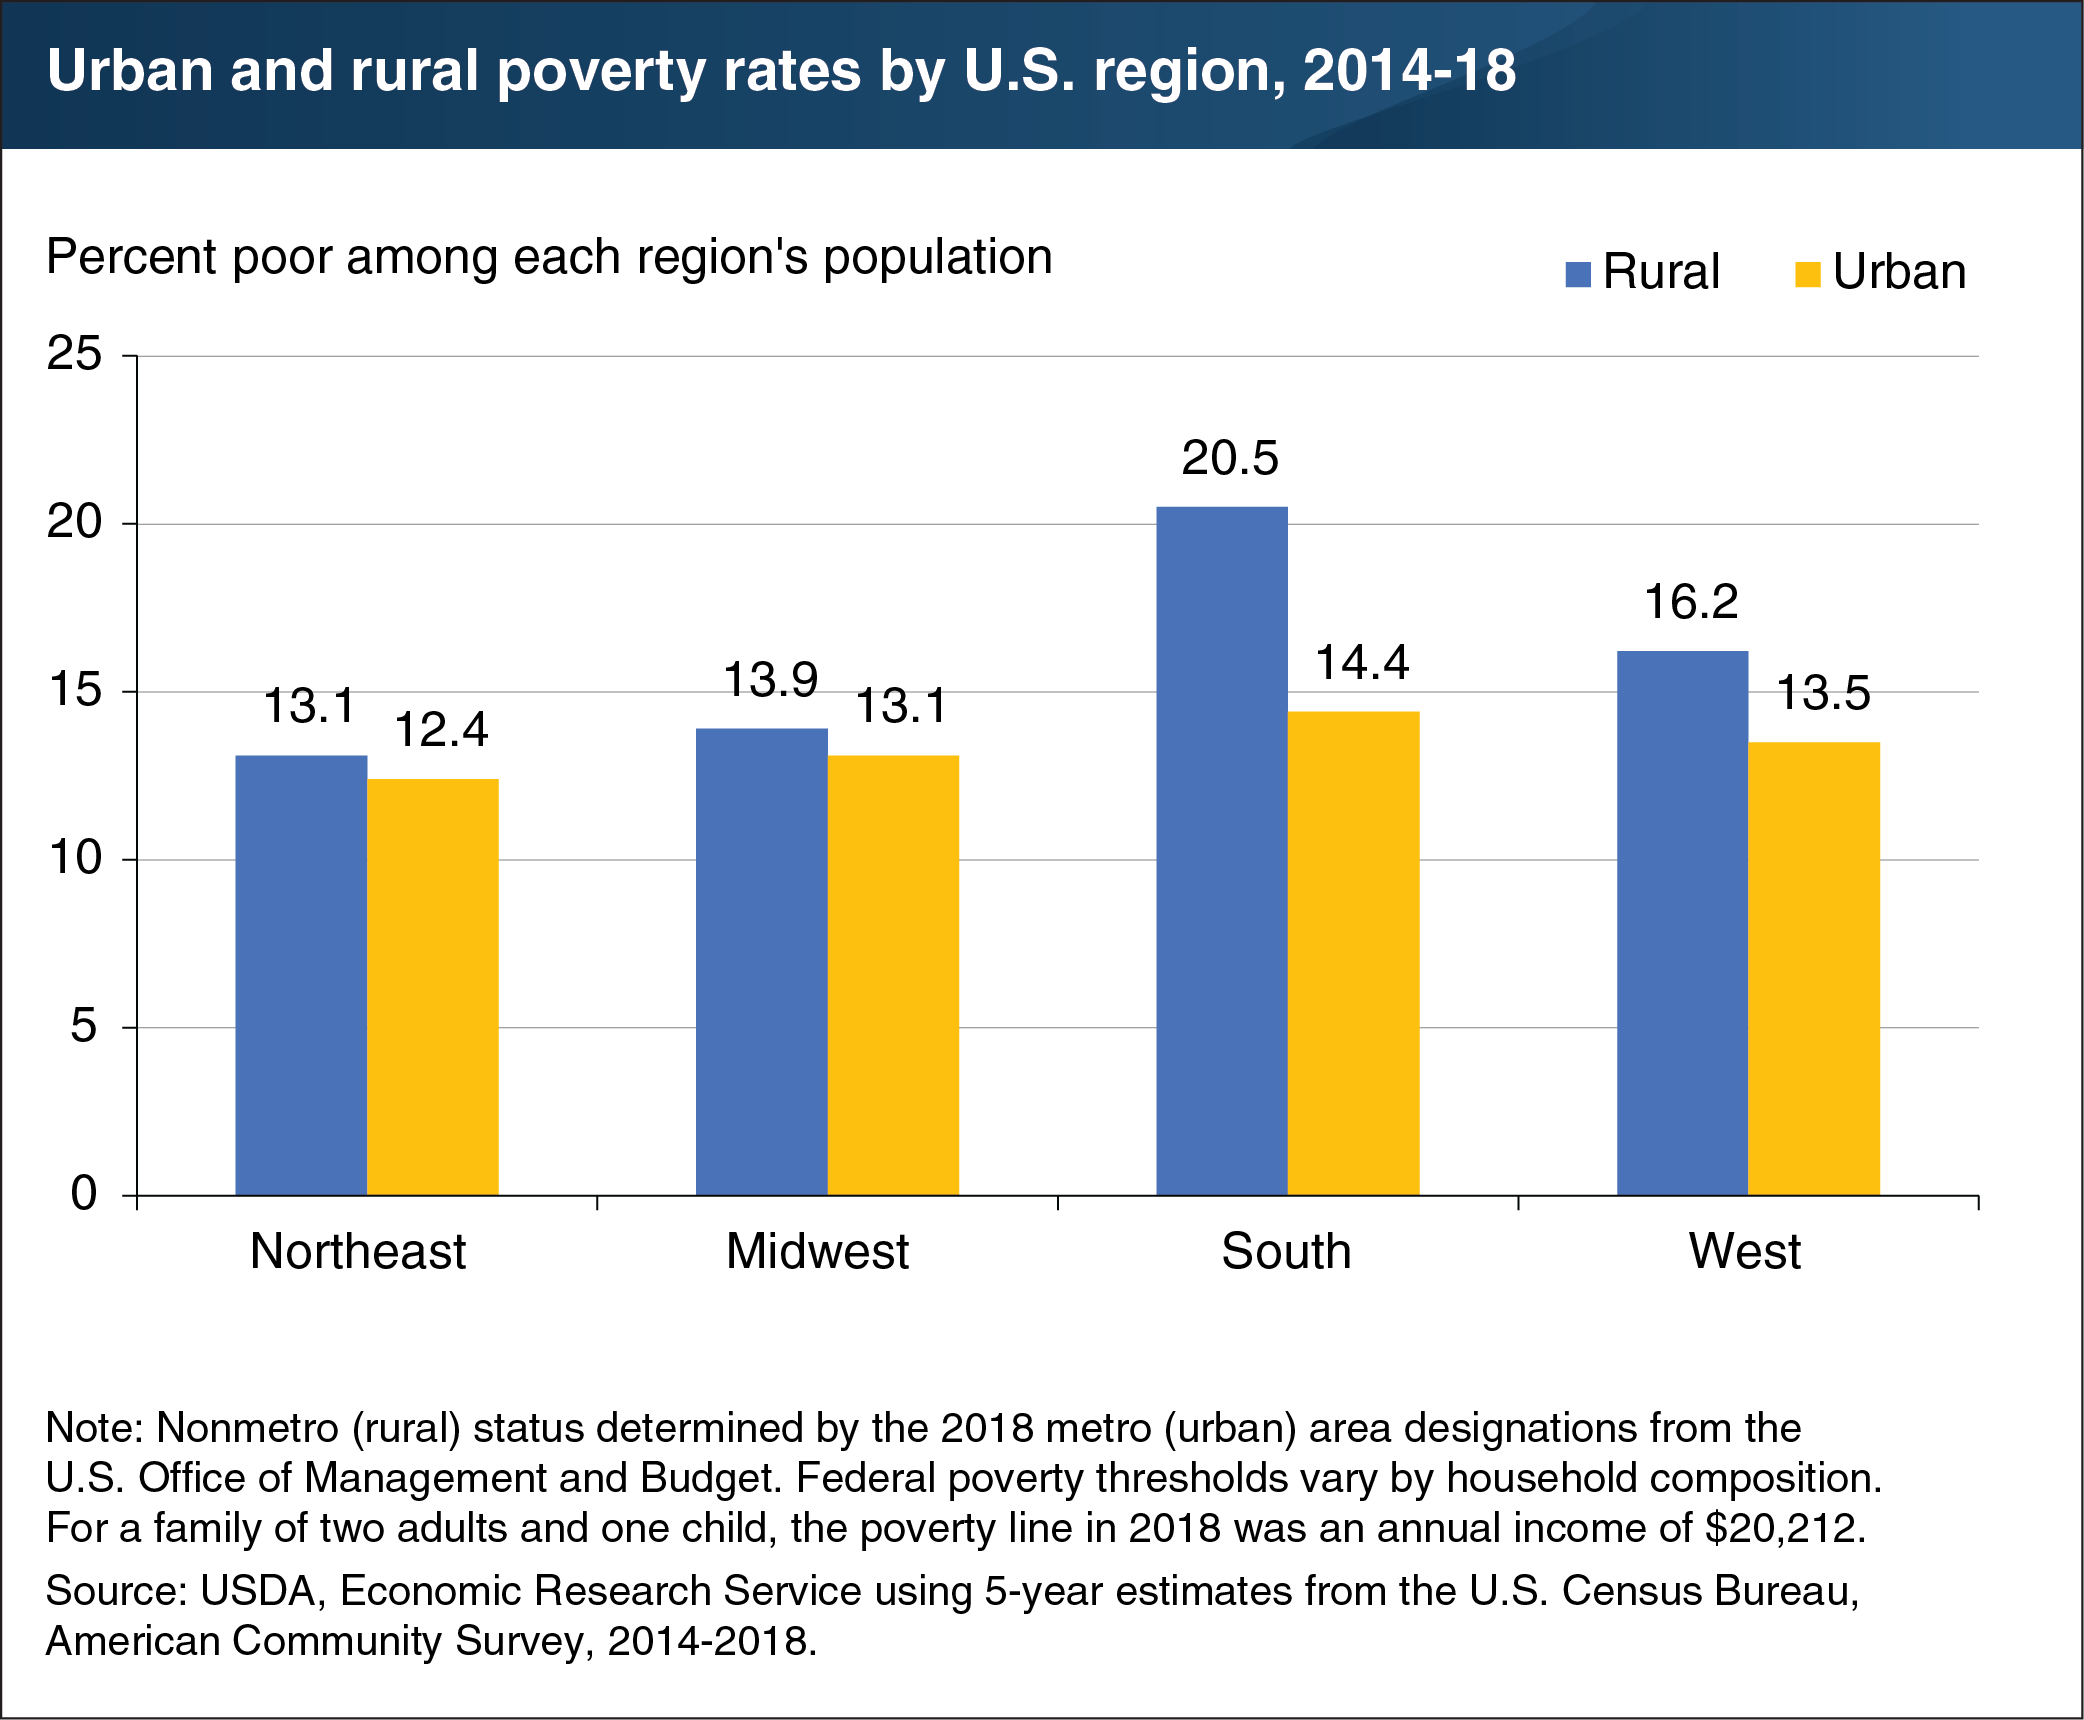
People living in poverty tend to be clustered in certain U.S. regions, counties, and neighborhoods, rather than being spread evenly across the Nation. Poverty rates in rural (nonmetro) areas have historically been higher than in urban (metro) areas, and the rural/urban poverty gap is greater in some regions of the country than others. At the regional level, poverty is disproportionately concentrated in the rural South. In 2014-18, the South had an average rural poverty rate of 20.5 percent—nearly 6 percentage points higher than the average rate in the region’s urban areas. An estimated 42.7 percent of the Nation’s rural population and 51.3 percent of the Nation’s rural poor lived in this region between 2014 and 2018. By comparison, 37.1 percent of the urban population and 39.4 percent of the urban poor lived in the South during that period. The poverty gap was smallest in the Midwest and the Northeast—with less than a percentage point difference between rural and urban poverty rates. This chart appears on the Economic Research Service topic page for Rural Poverty & Well-being, updated February 2020.
We’d welcome your feedback!
Would you be willing to answer a few quick questions about your experience?