
The share of large farms without sufficient income to make loan payments increased more than 4 percentage points between 2012 and 2017
- by Nigel Key and Dennis Vilorio
- 10/23/2019
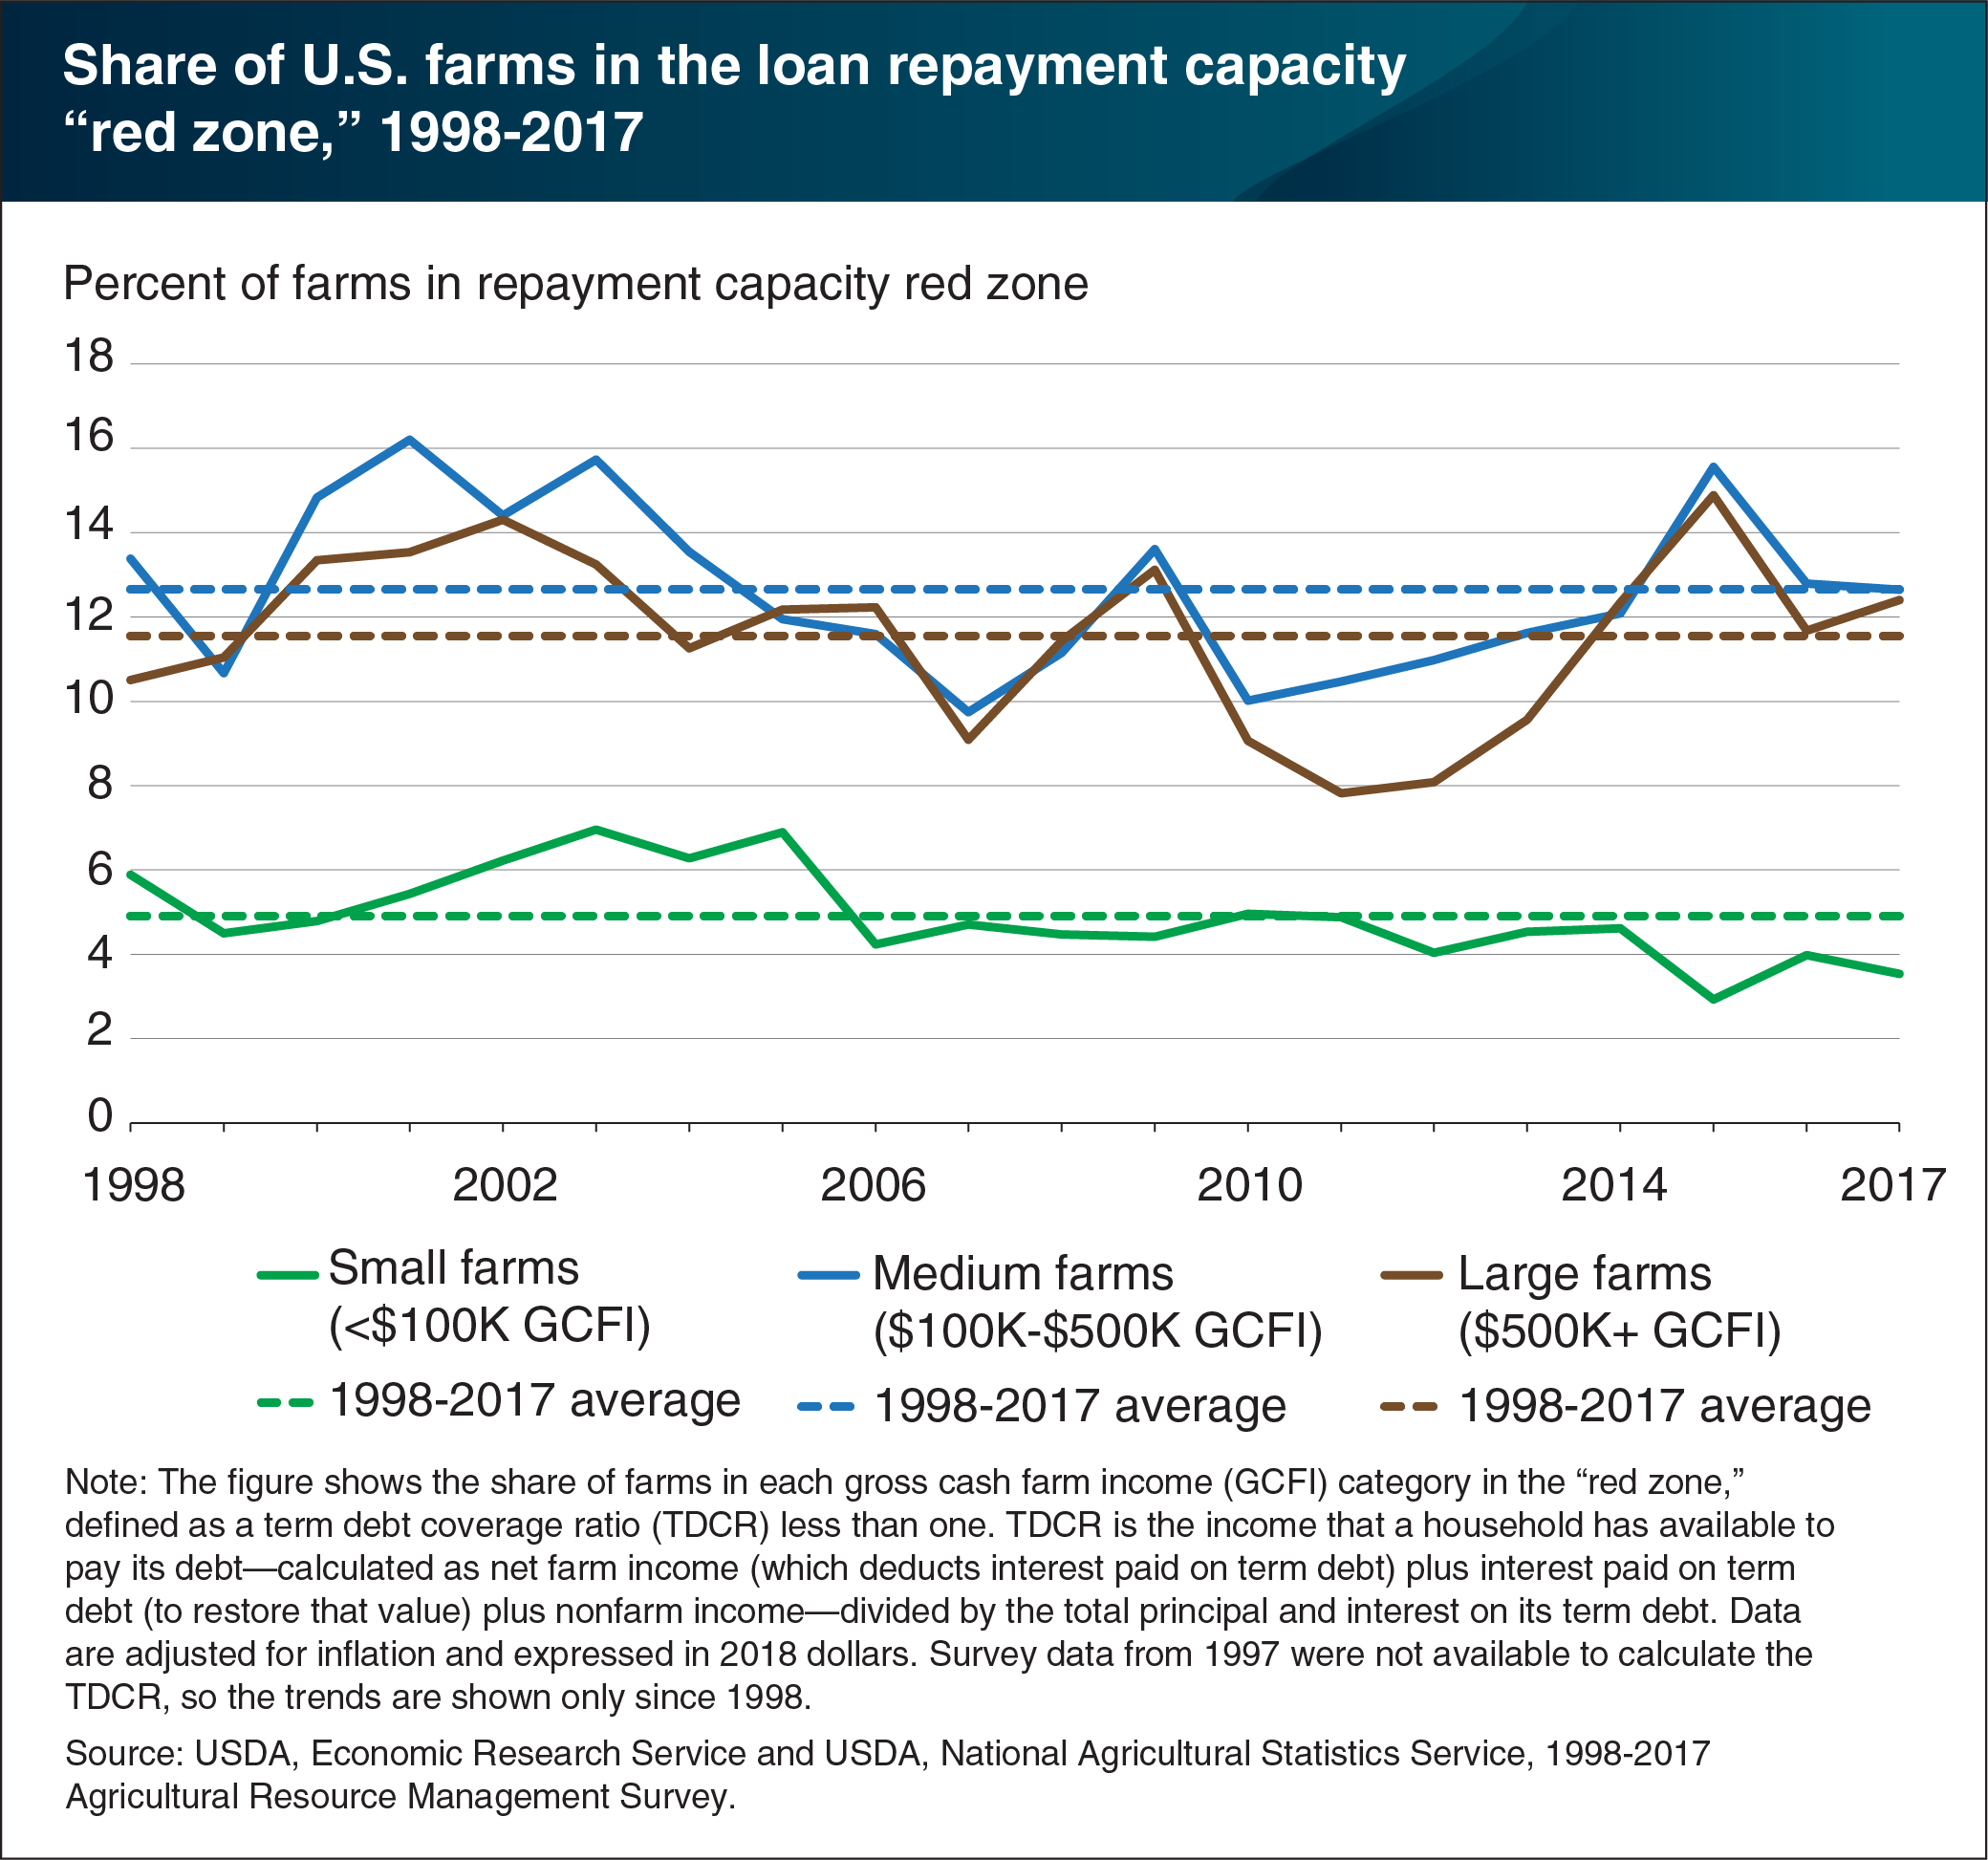
The income that a household has available to pay its debt, referred to as the term debt coverage ratio (TDCR), is often used to measure loan repayment capacity. A TDCR less than 1.0 indicates the farm household is in a repayment capacity “red zone” and does not have sufficient income to meet its loan payments. ERS researchers found that over the last 20 years, the shares of medium and large farms with a repayment capacity in the red zone have exceeded the share of small farms in that zone. On average, households that operate small farms earn most of their income off the farm and have relatively little farm debt. In the years following the 2012 peak in net cash farm income, the share of medium and large farms in the red zone increased. The increase was particularly steep for large farms—from 8.1 percent in 2012 to 12.4 percent in 2017. In contrast, small farms remained largely insulated from the downturn in the agricultural economy because they relied relatively more on off-farm income. This chart appears in the ERS report, Financial Conditions in the U.S. Agricultural Sector: Historical Comparisons, released October 2019. It also appears in the Amber Waves feature, “Larger Farms and Younger Farmers Are More Vulnerable to Financial Stress.”
We’d welcome your feedback!
Would you be willing to answer a few quick questions about your experience?