
America’s top fruit choices? Apples and oranges
- by Jeanine Bentley and Katherine Ralston
- 10/4/2019
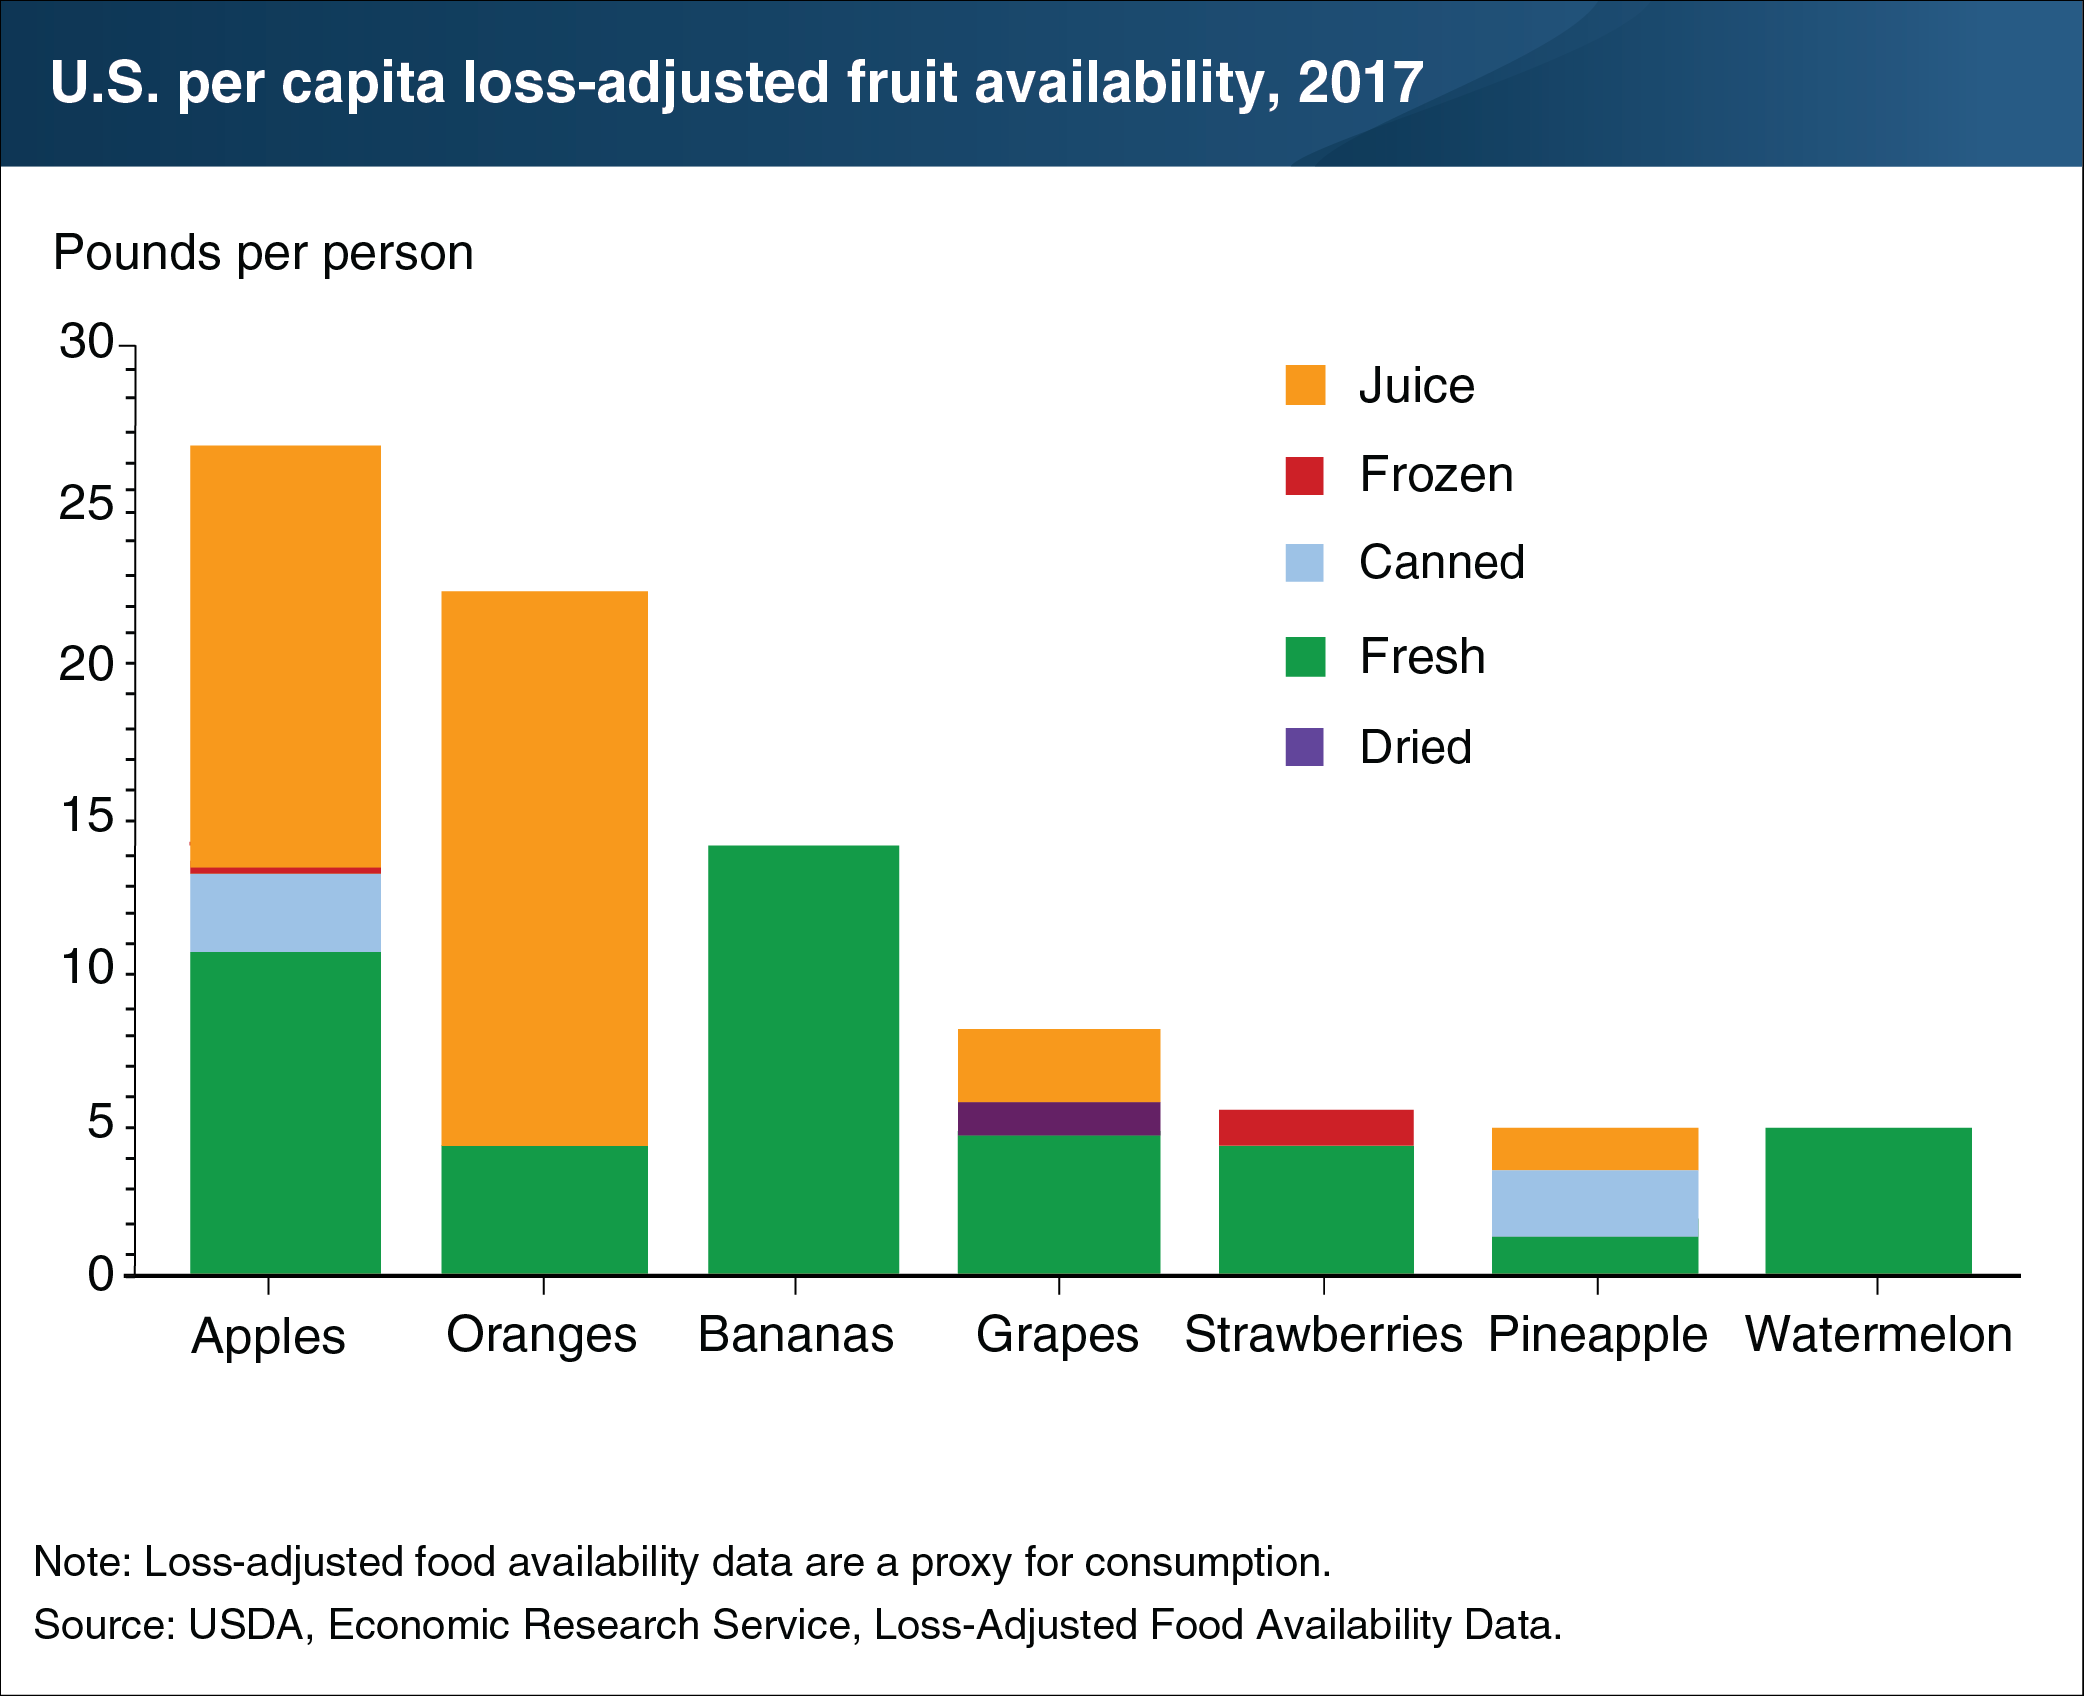
In 2017, 113.8 pounds of fresh and processed fruit per person were available for U.S. consumption after adjusting for losses, according to ERS’s loss-adjusted food availability data. This data series takes per capita supplies of food available for human consumption and more closely approximates actual consumption by adjusting for some of the spoilage, plate waste, and other losses in eating places, grocery stores, and the home. Loss-adjusted apple juice availability at 13.8 pounds (1.6 gallons) per person in 2017, combined with fresh apples (almost 10 pounds per person), and canned, dried, and frozen apples (3.4 pounds per person), puts apples in the top spot for total fruit consumption. While orange consumption came in second, loss-adjusted orange juice availability has steadily declined, reaching a low of 18.2 pounds (2.1 gallons) per person in 2017. Loss-adjusted availability of fresh bananas was 14.1 pounds per person in 2017, which is 4 pounds per person more than fresh apples. Loss-adjusted availability of grapes reached 7.6 pounds per person, and strawberries, pineapple, and watermelon rounded out the list of America’s top fruit choices. This chart appears in ERS’s Ag and Food Statistics: Charting the Essentials data product, updated September 2019.