
U.S. soybean exports in the 2018/19 crop year deviate from past seasonal patterns
- by Mark Ash, Mariana Matias and Utpal Vasavada
- 9/30/2019
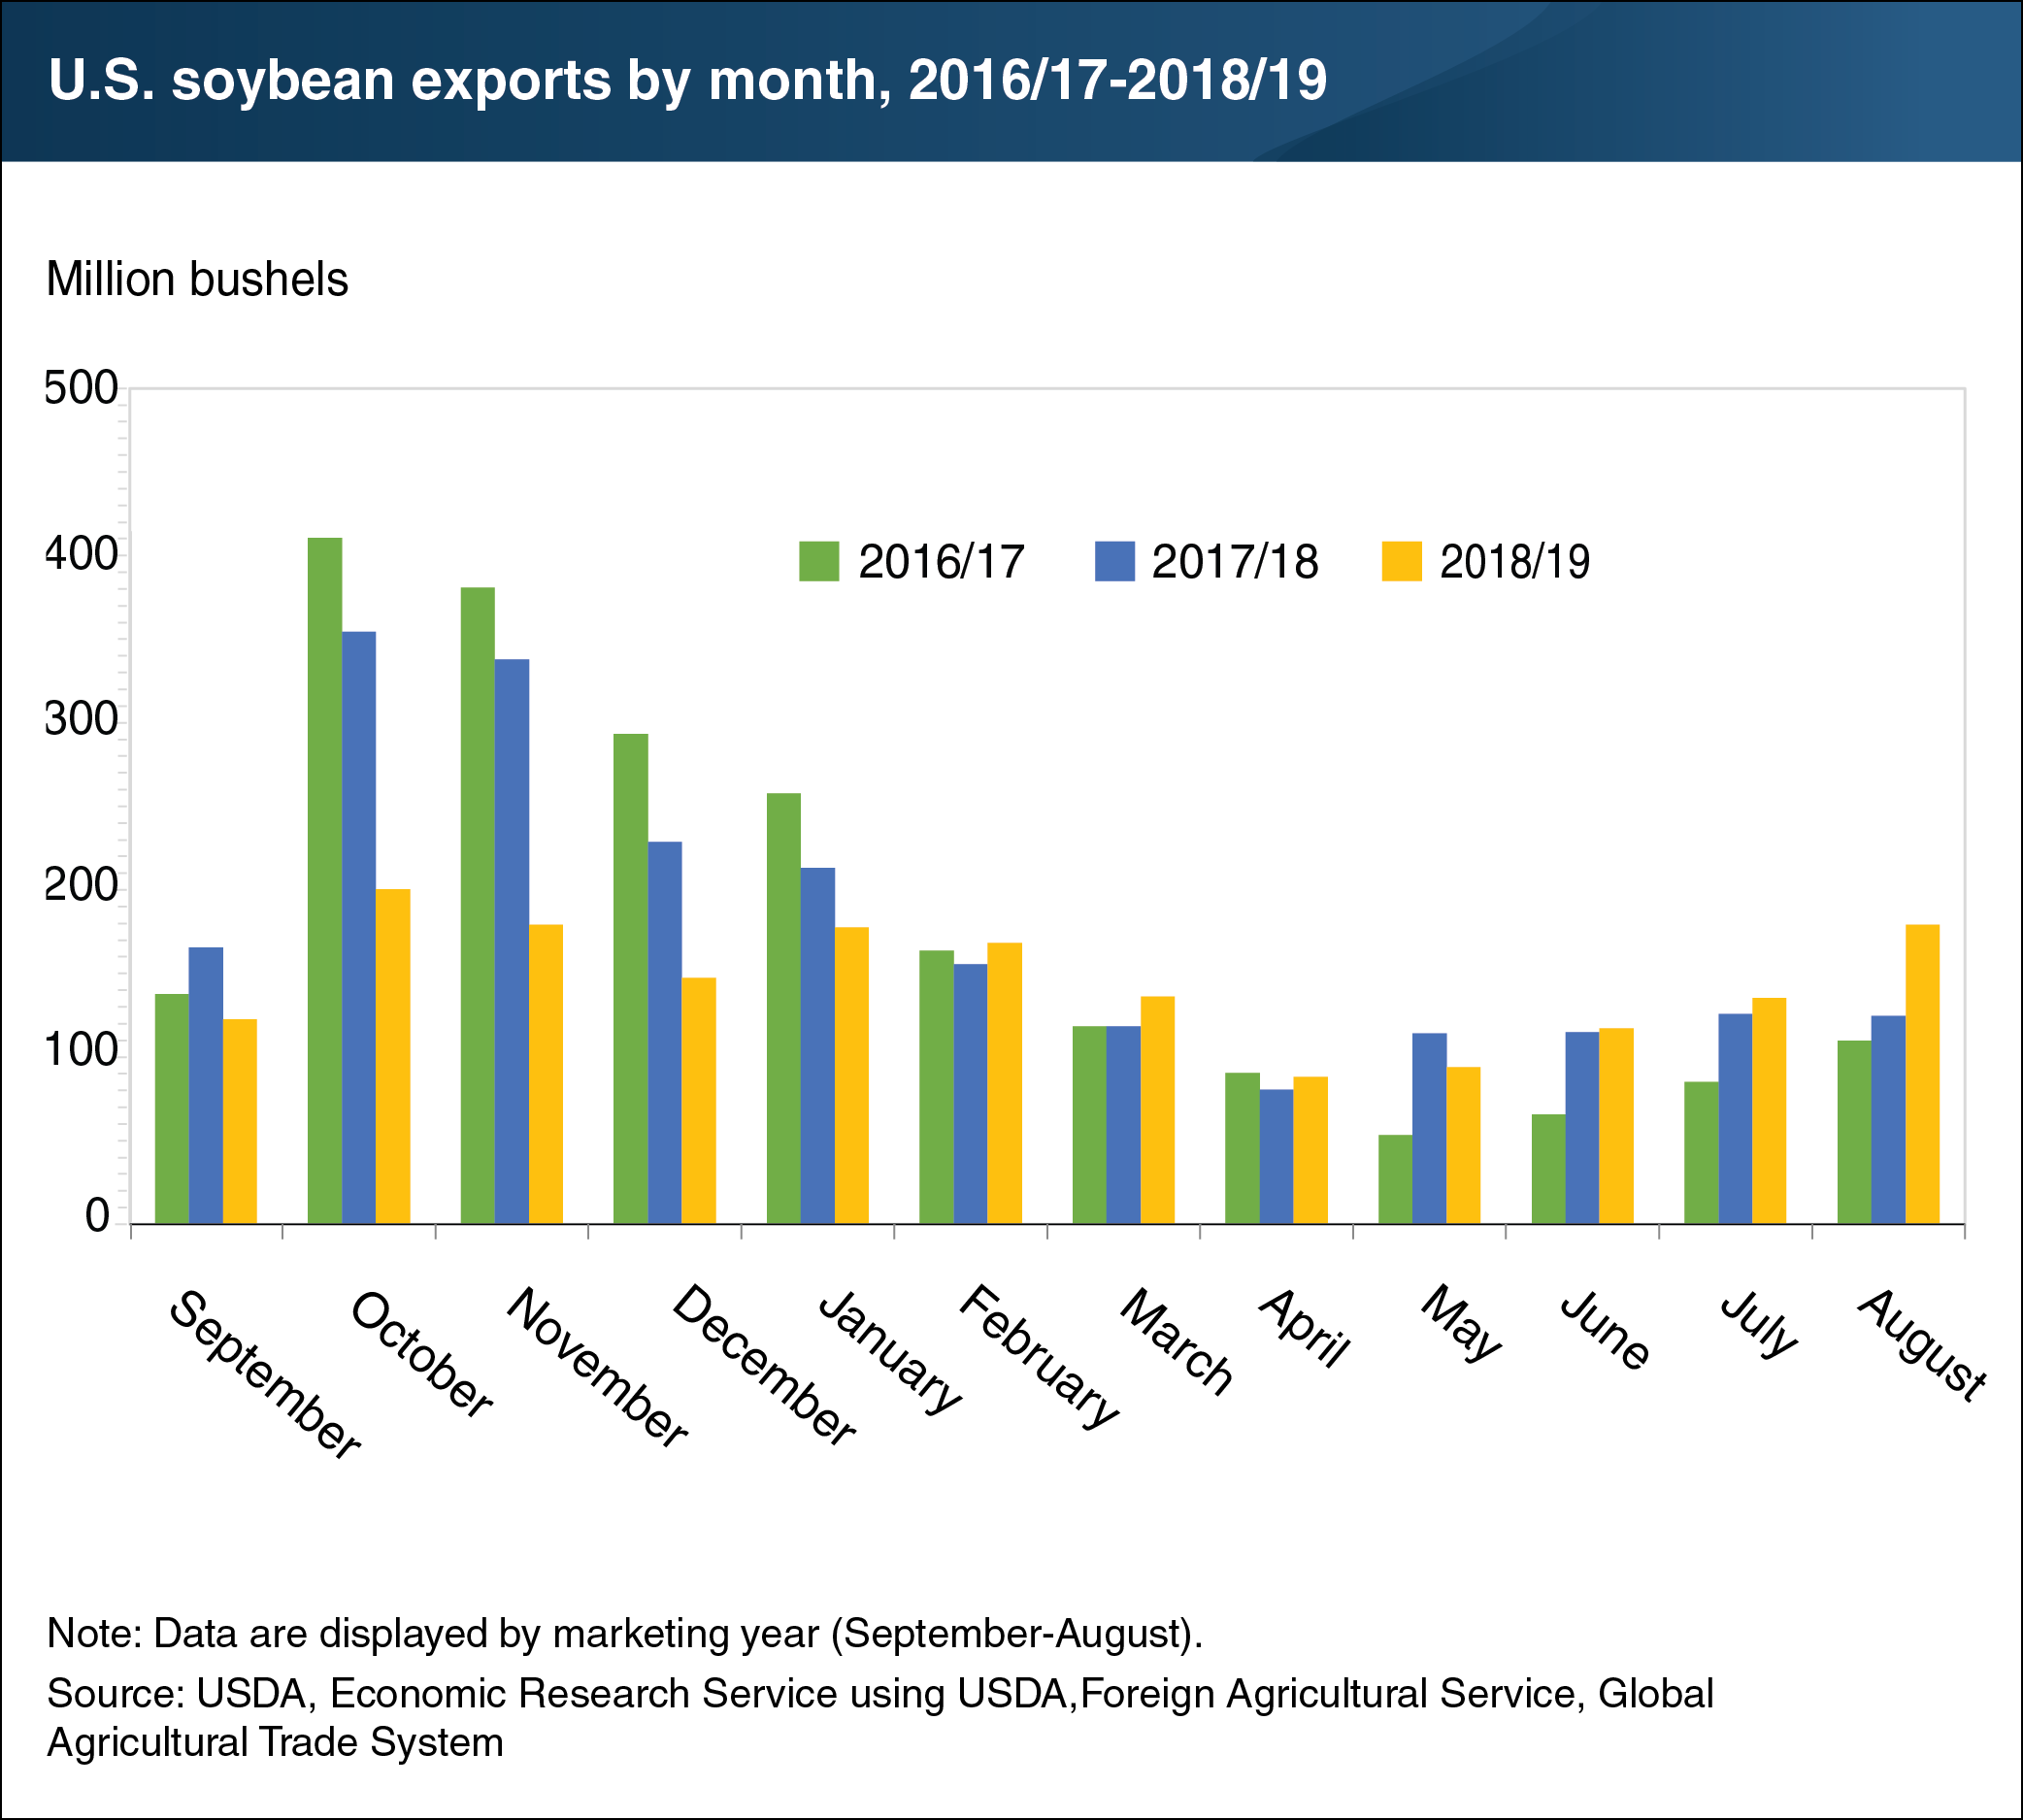
U.S. soybean exports concluded the 2018/19 crop year with a flourish. At 180 million bushels, August export inspections of soybeans totaled an all-time high for the month. The data rounds out the September-August crop marketing year with an atypical export pattern: August shipments were nearly as high as in October and November. In contrast, exports for 2016/17 and 2017/18—as well as in previous years—followed a seasonal pattern with exports peaking in the late-fall and winter before falling to lower levels in the spring and summer. The unseasonably strong revival in U.S. export demand this summer was stimulated by competitive prices and a slowing of shipments from Brazil. China accounted for a majority of the August gain in U.S. soybean shipments, which surged when sales that were booked early this year were actually shipped. The lower 2018/19 export totals in the first half of the crop year were also attributable to China, as exports to the country fell due to tariffs on U.S. soybeans entering the Chinese market. As a consequence, USDA raised its 2018/19 estimate of U.S. exports this month by 45 million bushels to 1.745 billion. This chart appears in the ERS Oil Crops Outlook report released in September 2019.