
ICYMI... The U.S. is not capturing the growth in global grain trade
- by Olga Liefert and Utpal Vasavada
- 8/13/2019
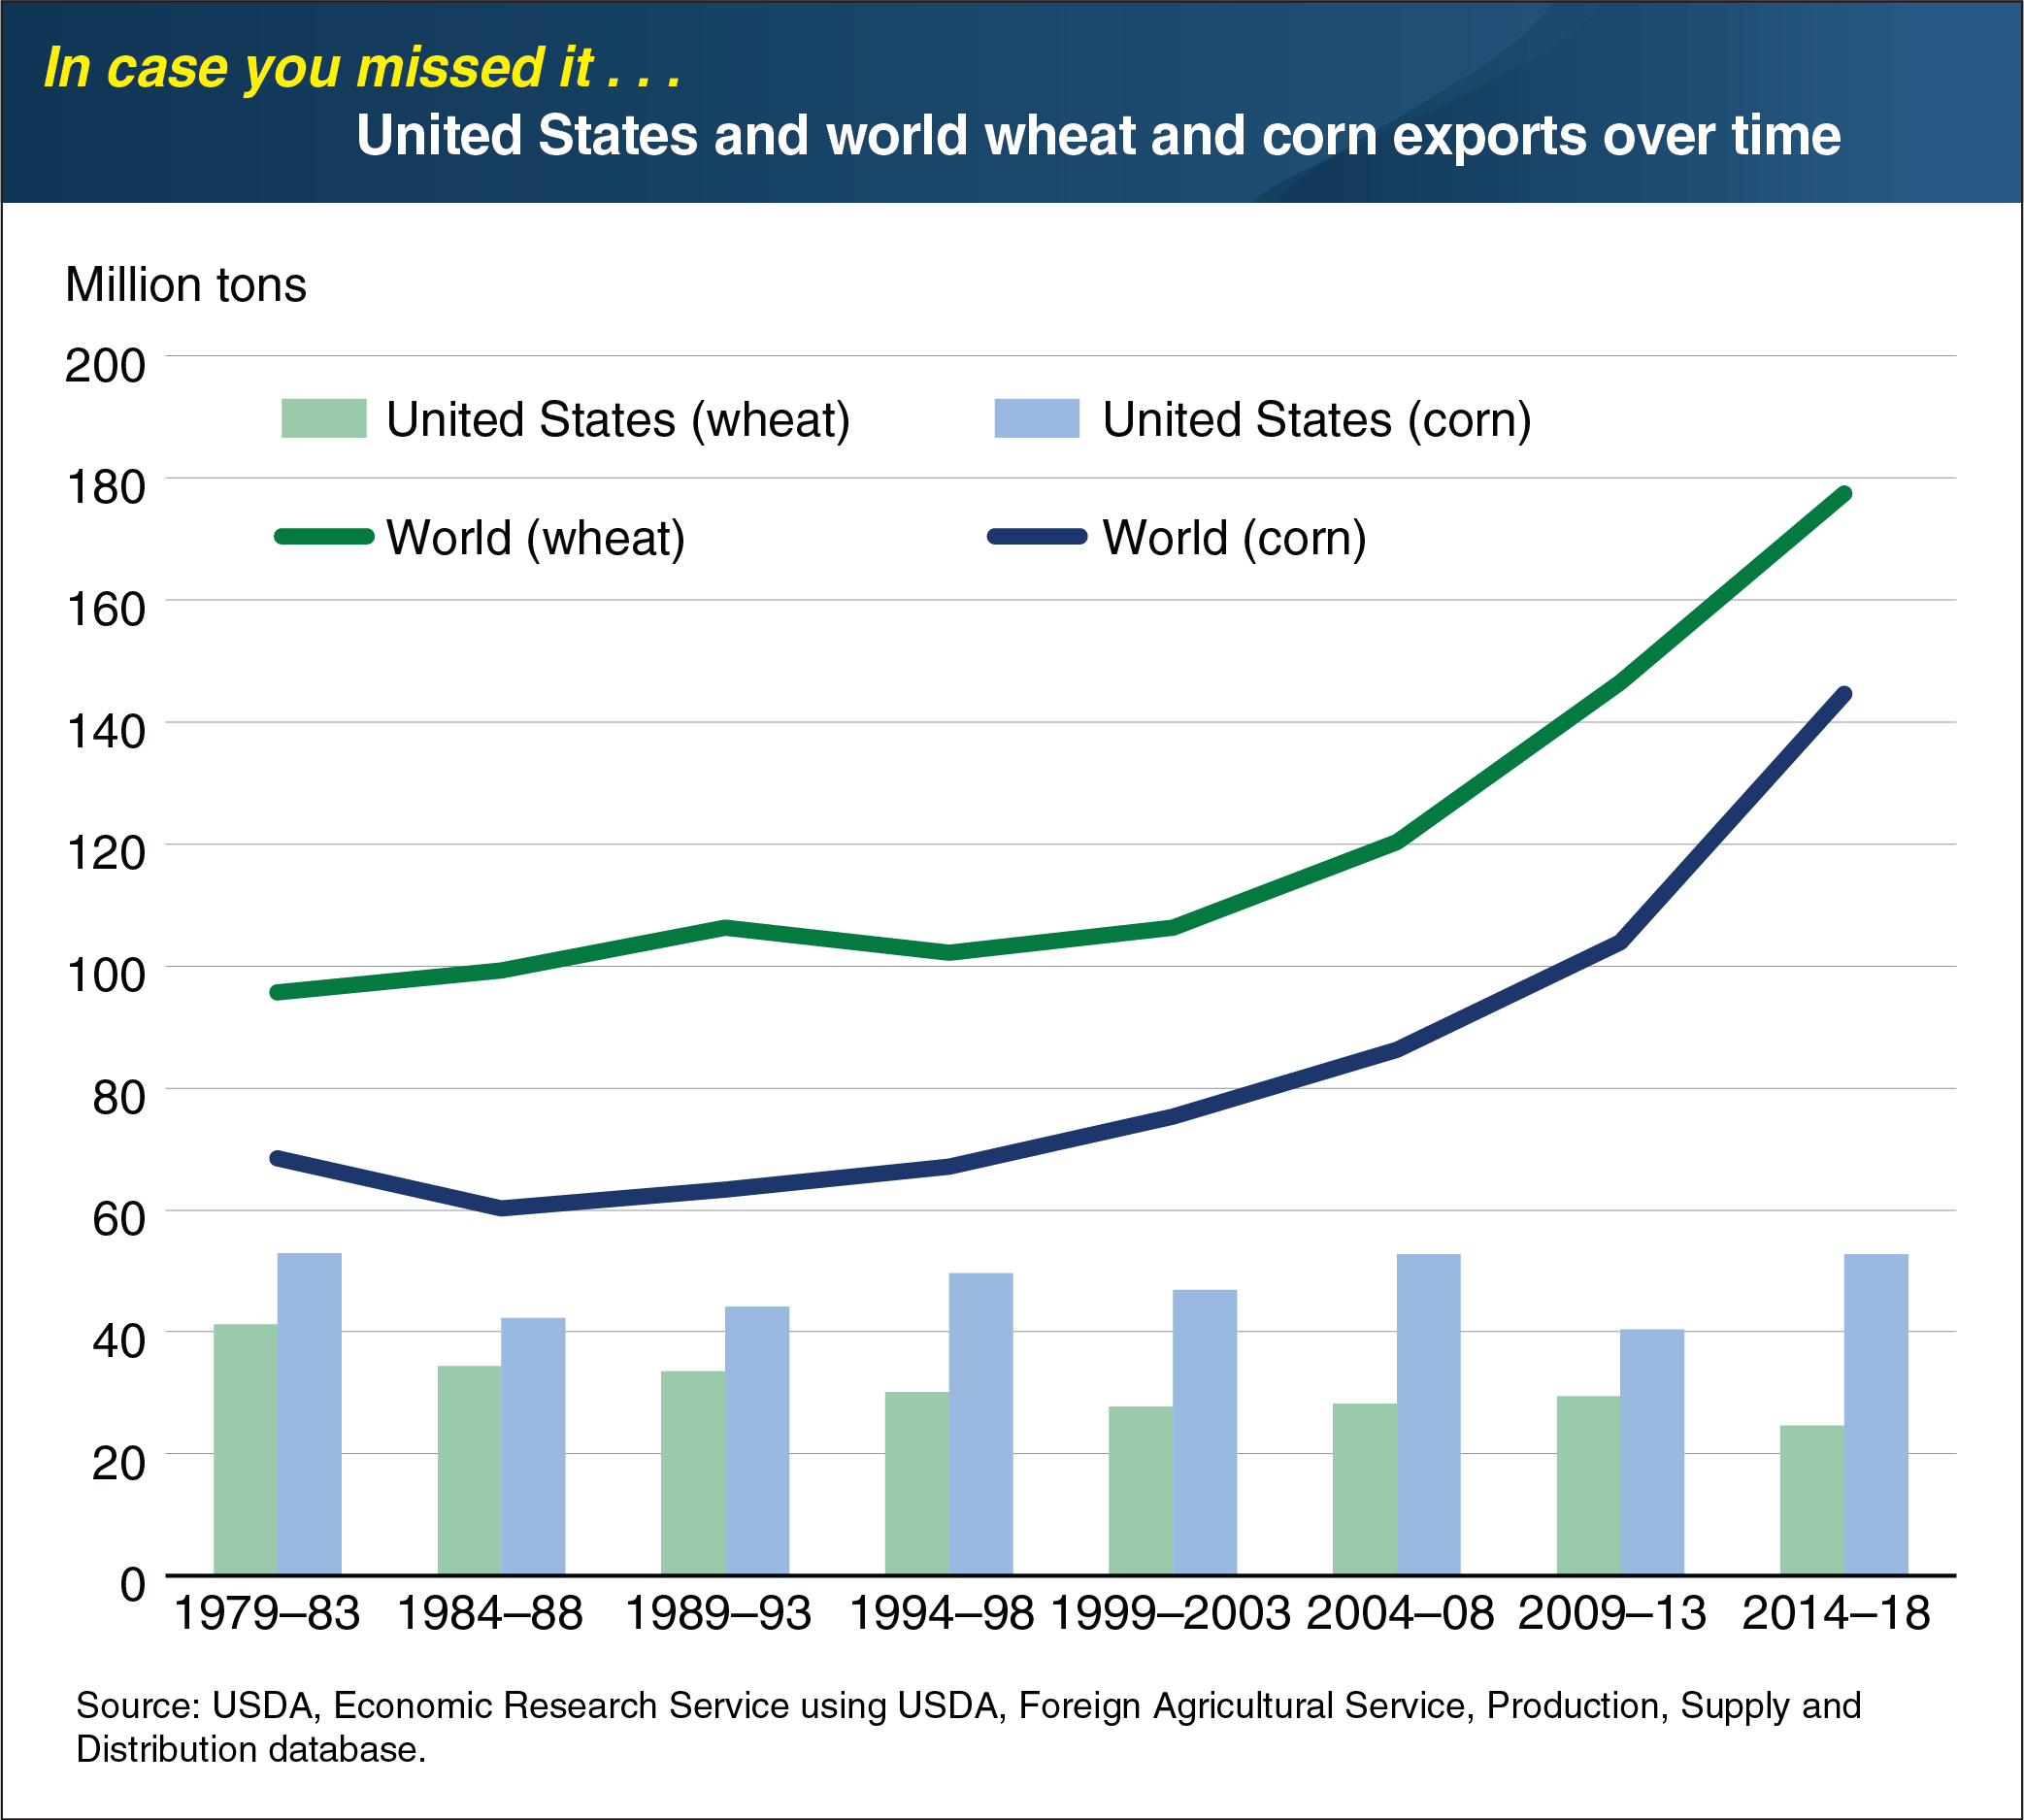
The United States maintained its status as the world’s grain superpower for most of the post-World War II period by being the leading corn and wheat producer and exporter. Before the beginning of this century, the United States annually exported about a third of globally traded wheat and around 70 percent of corn. The emergence of new low-cost producers and exporters in the global wheat and corn markets reduced the U.S. share of grain exports and transformed global grain trade. Competition from Russia, Ukraine, and Argentina has weighed down U.S wheat exports share, while Brazil, Argentina, and Ukraine are driving down the U.S. corn export share. In October 2018, world demand for wheat had been growing at a steady pace, driven mainly by population growth in low-income countries and a switch from rice to wheat consumption in countries that are traditionally heavy rice consumers. This chart appears in the October 2018 Amber Waves article, “Major Changes in Export Flows Over the Last Decade Show the U.S. Is Losing Market Share in Global Grain Trade.” This Chart of Note was originally published October 11, 2018.
We’d welcome your feedback!
Would you be willing to answer a few quick questions about your experience?