
China’s increased soybean imports from Brazil and Canada do not fully offset lost U.S. imports
- by Fred Gale, Constanza Valdes and Mark Ash
- 7/2/2019
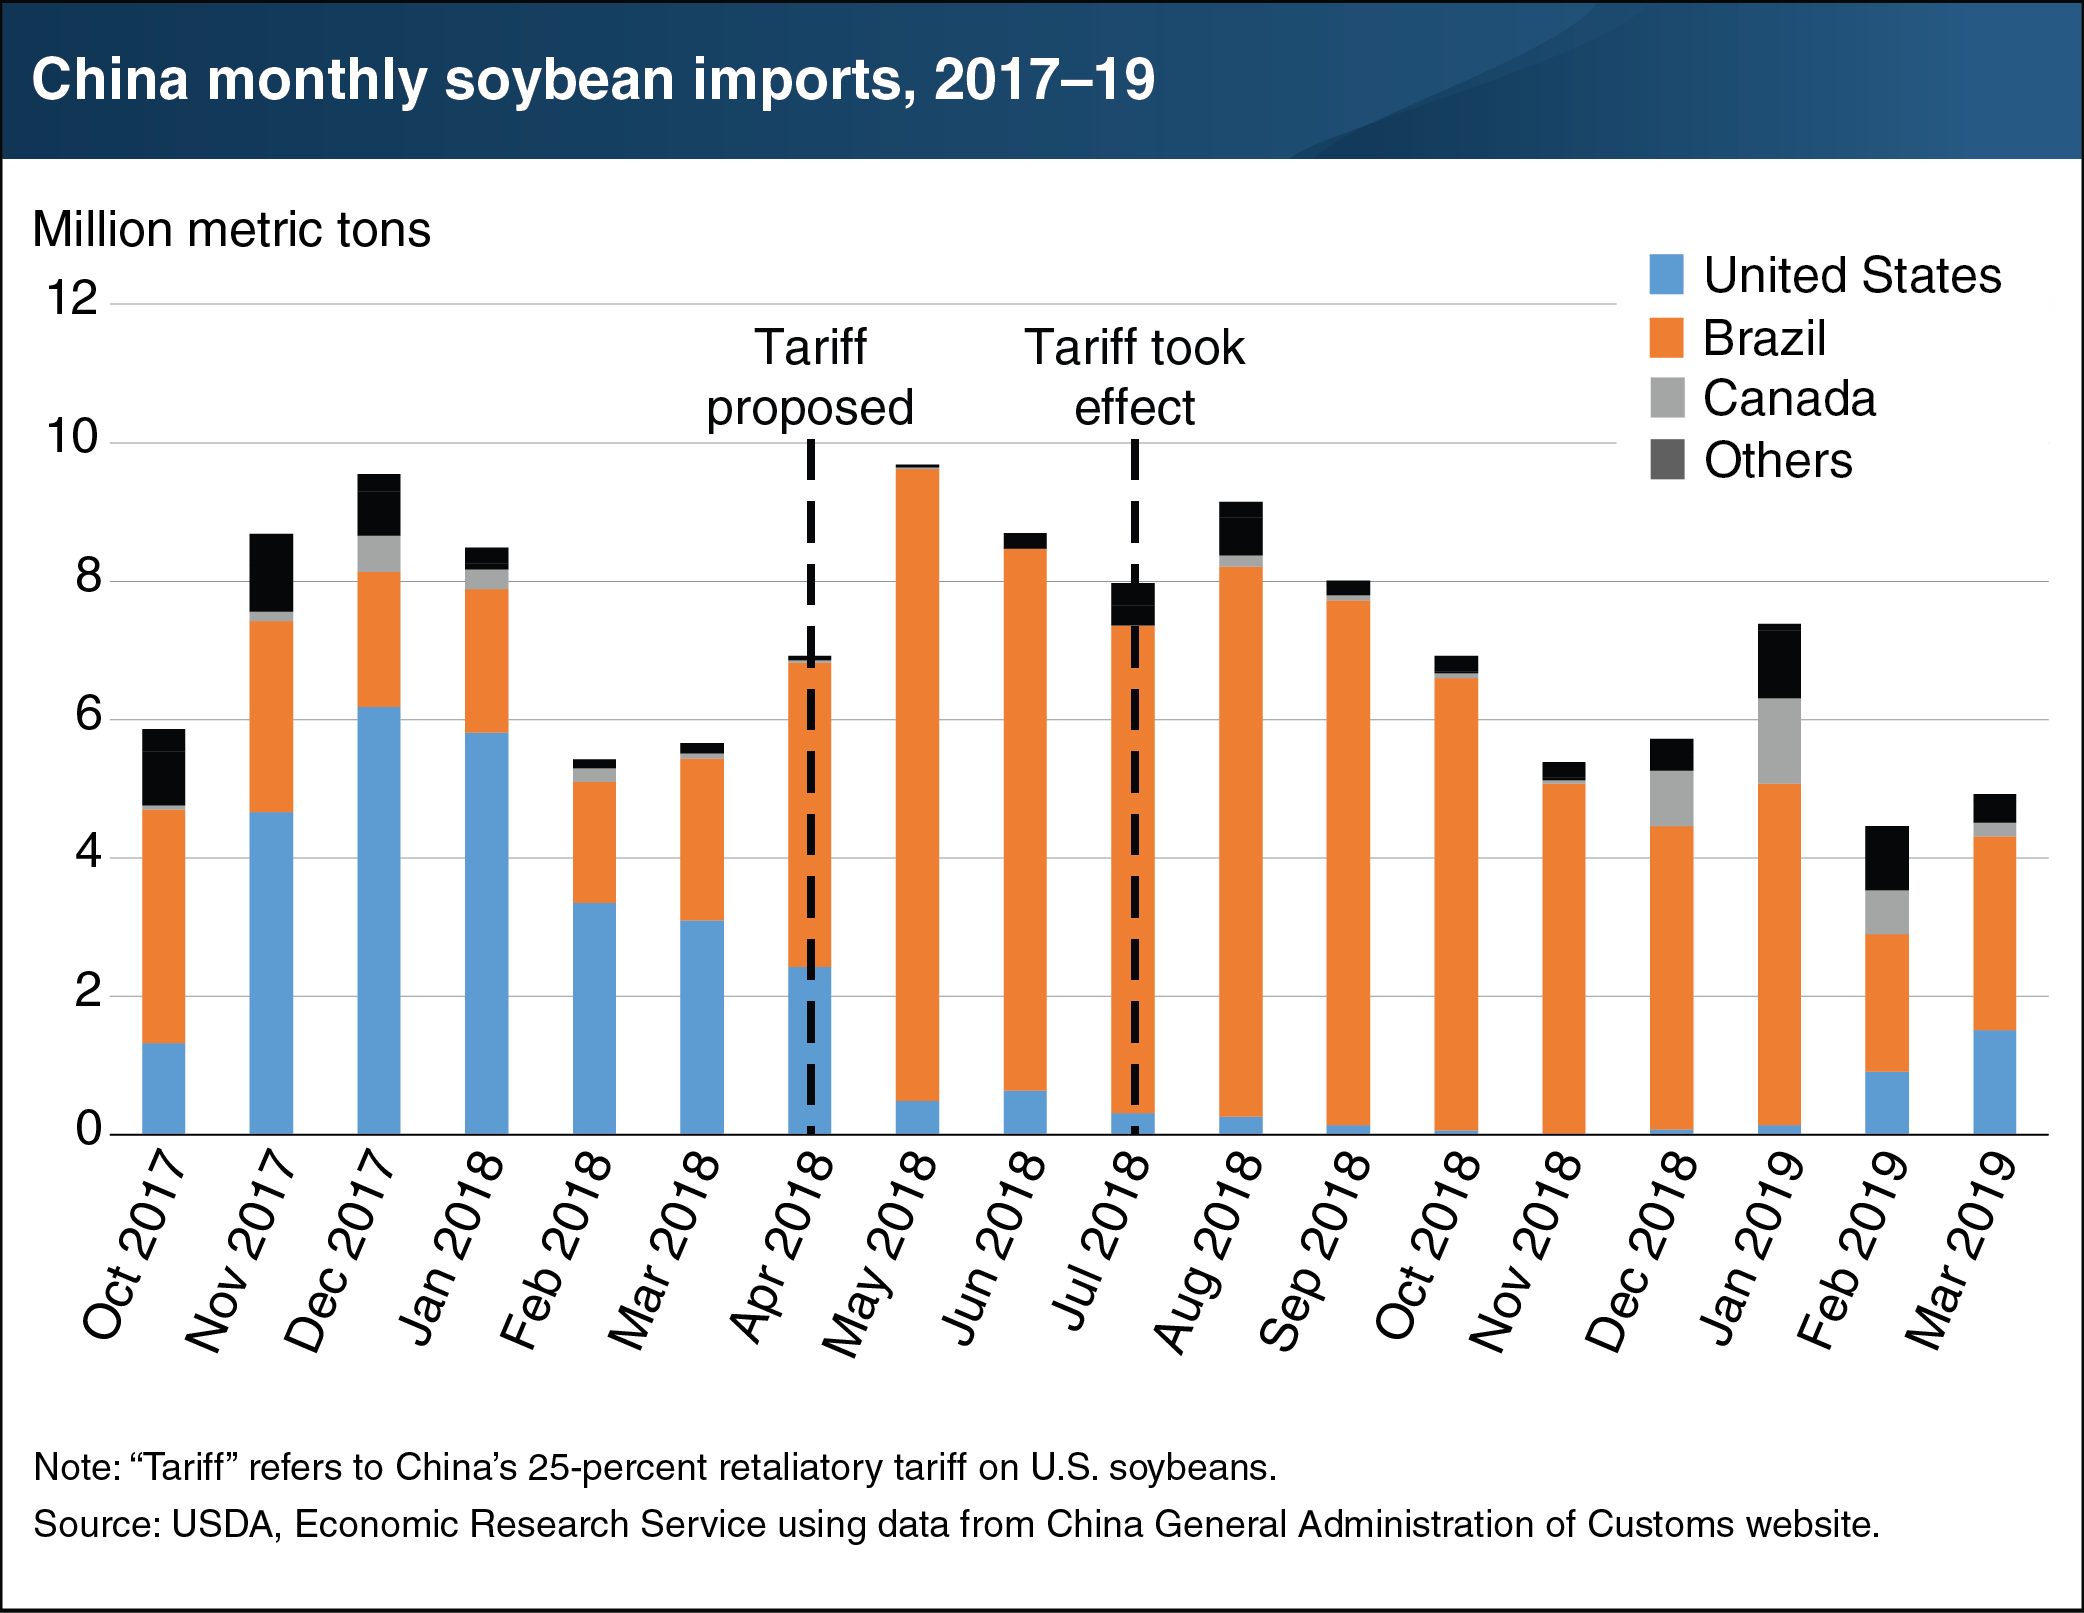
Soybeans are the largest and most concentrated segment of global agricultural trade. In March 2018, China proposed a 25 percent tariff on U.S. soybeans and implemented the tariffs in July 2018. In the first half of the Chinese marketing year for soybeans (October 2018–March 2019), Chinese imports of U.S. soybeans fell by nearly 22 million metric tons, down 89 percent relative to the same period in 2017/18. To offset the decline in U.S. soybean imports, China increased imports from Brazil and, to a lesser extent, Canada. China’s 11.5-million metric ton increase in imports of soybeans from Brazil was large enough to offset roughly half of the lost imports from the United States. Additionally, China increased its imports from Canada by 1.7 million metric tons. In total, however, increased shipments from Brazil and Canada did not offset the decline in imports of U.S. soybeans. China’s soybean imports were nearly 9 million metric tons (20 percent) lower in October 2018 to March 2019 than the same period in 2017/18. This chart appears in the ERS report, Interdependence of China, United States, and Brazil in Soybean Trade, released in June 2019.
We’d welcome your feedback!
Would you be willing to answer a few quick questions about your experience?