
Value of U.S. cropland appreciated faster than pastureland after Great Recession
- by Nigel Key
- 5/23/2019
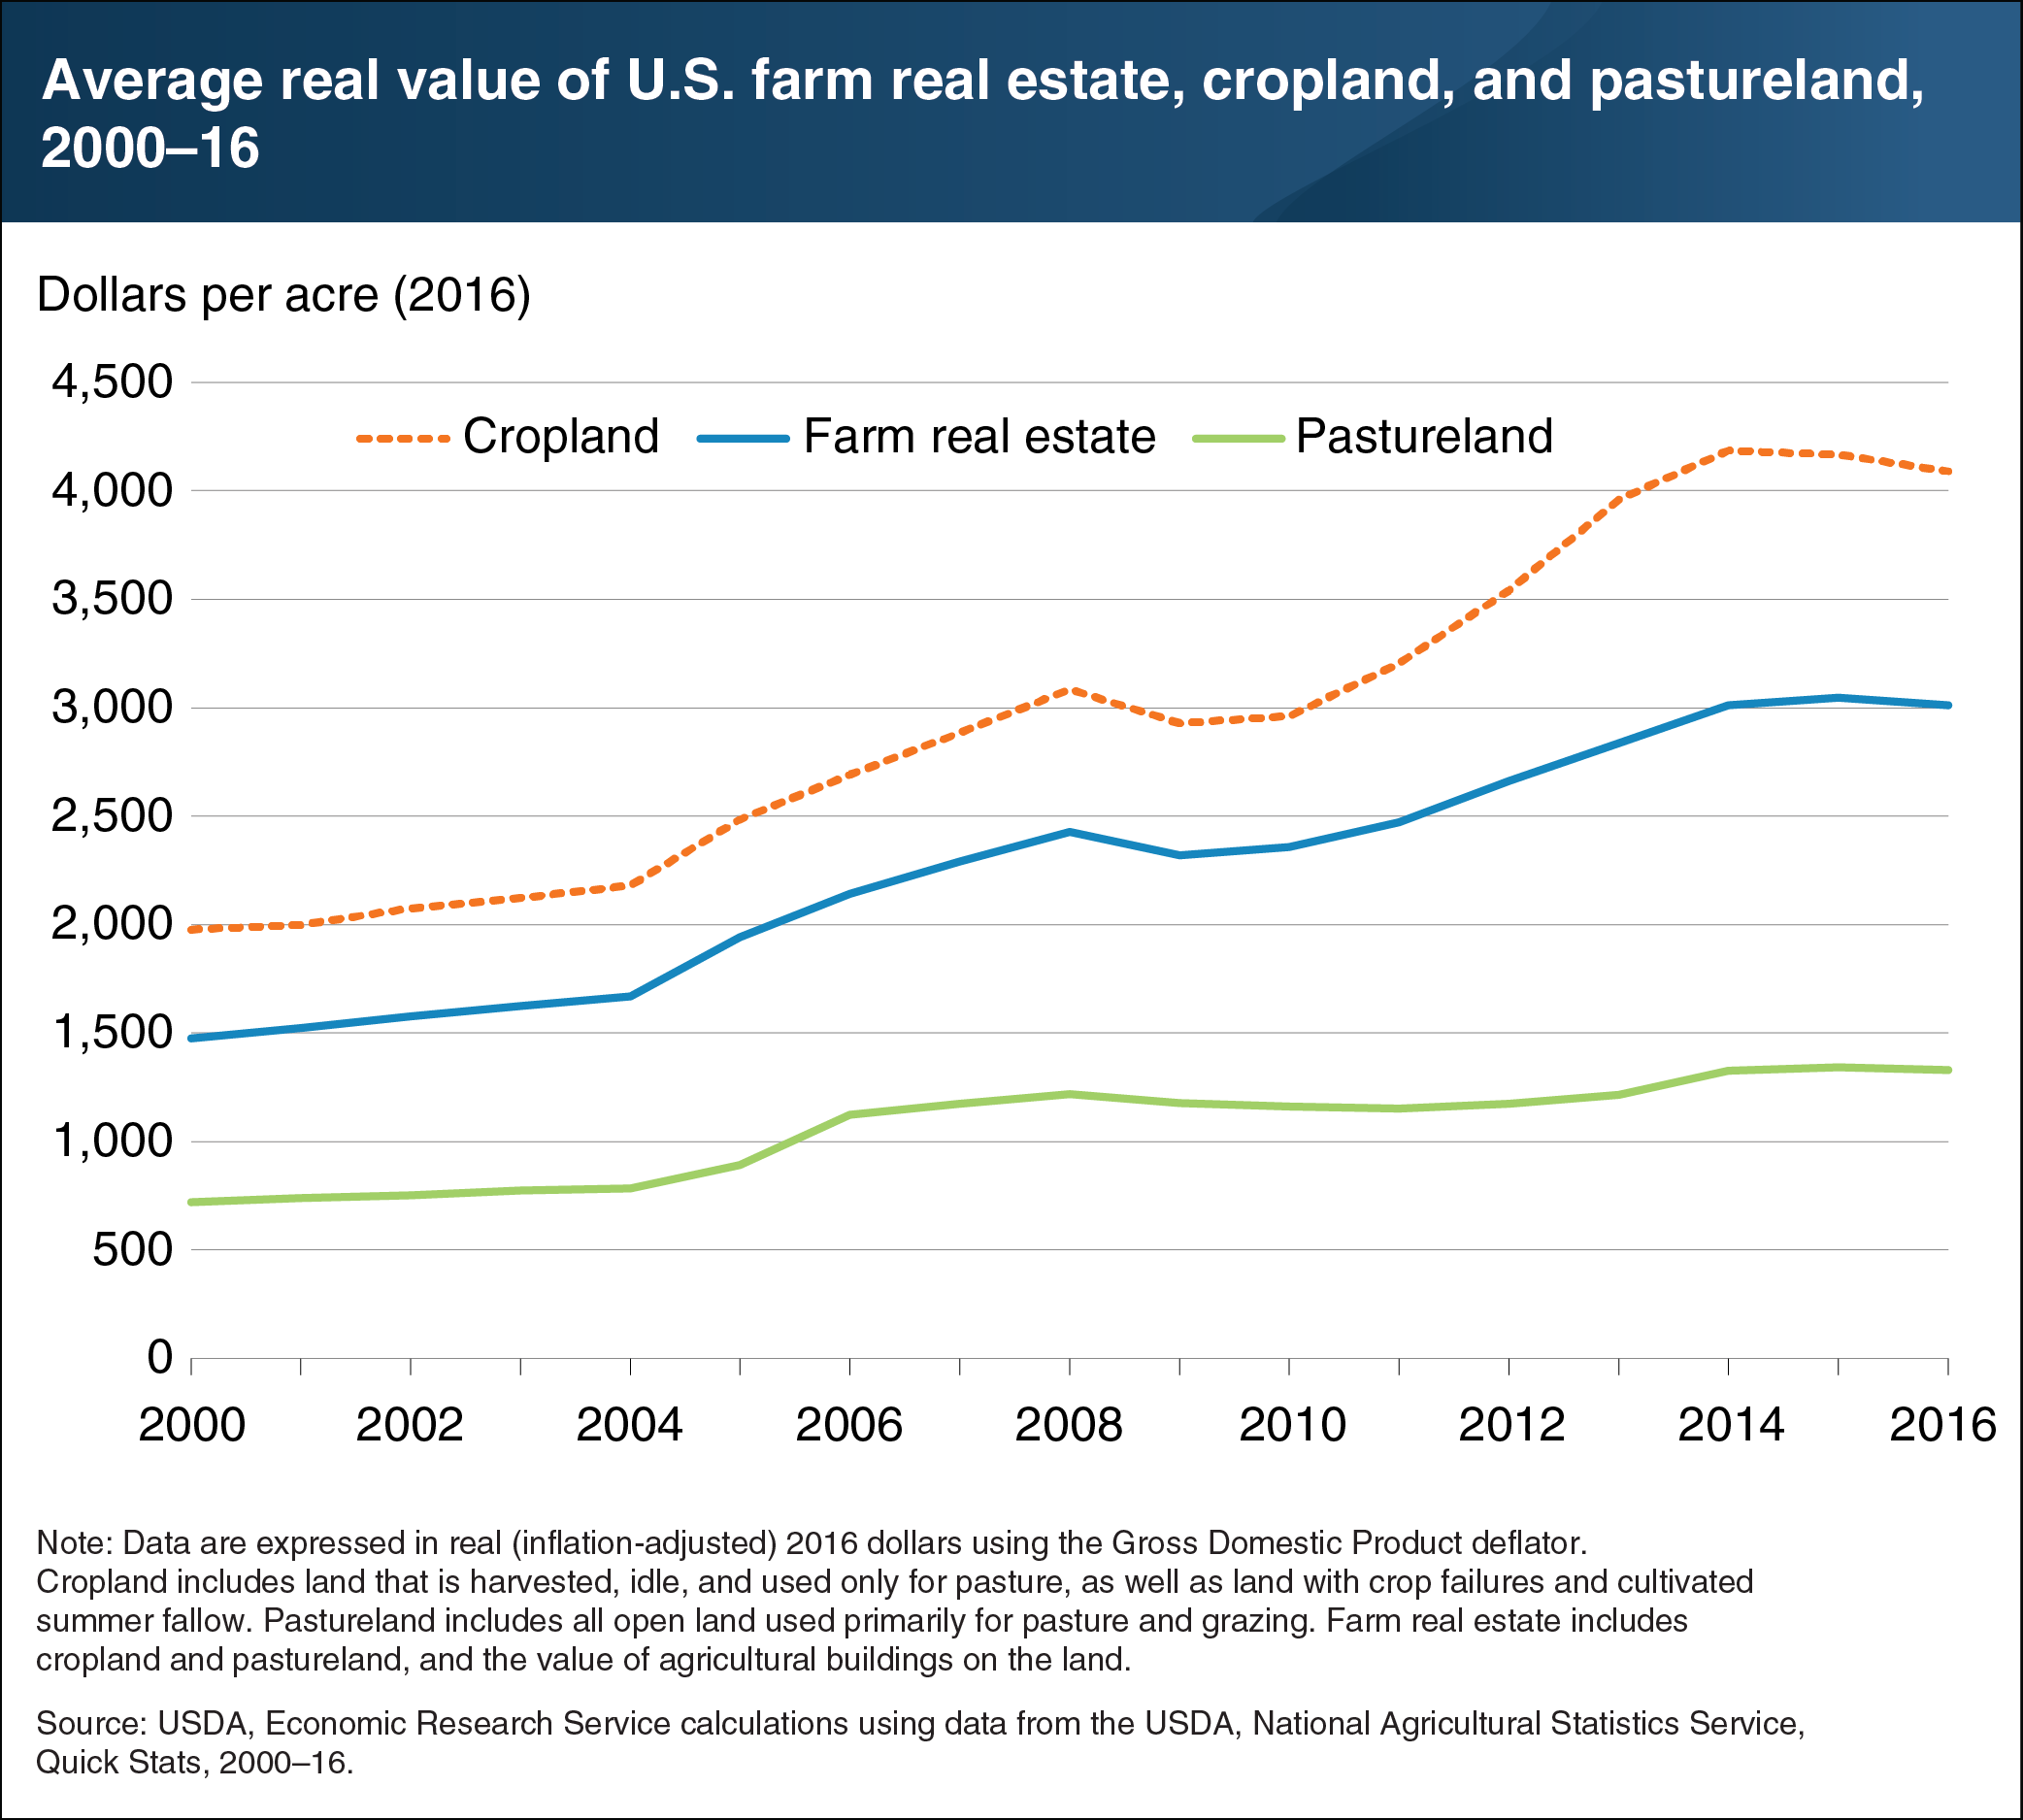
Farm real estate (including farmland and the structures on the land) accounts for over 80 percent of farm-sector assets and represents a significant investment for many farms. Beginning in the mid-2000s, higher farm incomes and lower interest rates contributed to rapid appreciation. Nationally, average per-acre farm real estate values more than doubled when adjusted for inflation, from $1,483 in 2000 to $3,010 in 2016. Two major uses of farmland are cropland and pastureland. From 2003 to 2014, U.S. cropland values doubled, appreciating faster than pastureland and reflecting a rise in grain and oilseed commodity prices. However, the value of cropland and farm real estate dipped slightly in 2008–09, reflecting the effect of the Great Recession and the downturn in the U.S. housing market. In contrast, average U.S. pastureland values remained relatively flat. This chart appears in the February 2018 ERS report, Farmland Values, Land Ownership, and Returns to Farmland, 2000–2016.