

Food insecurity varies by adult employment status
- by Michael D. Smith and Alisha Coleman-Jensen
- 3/1/2019
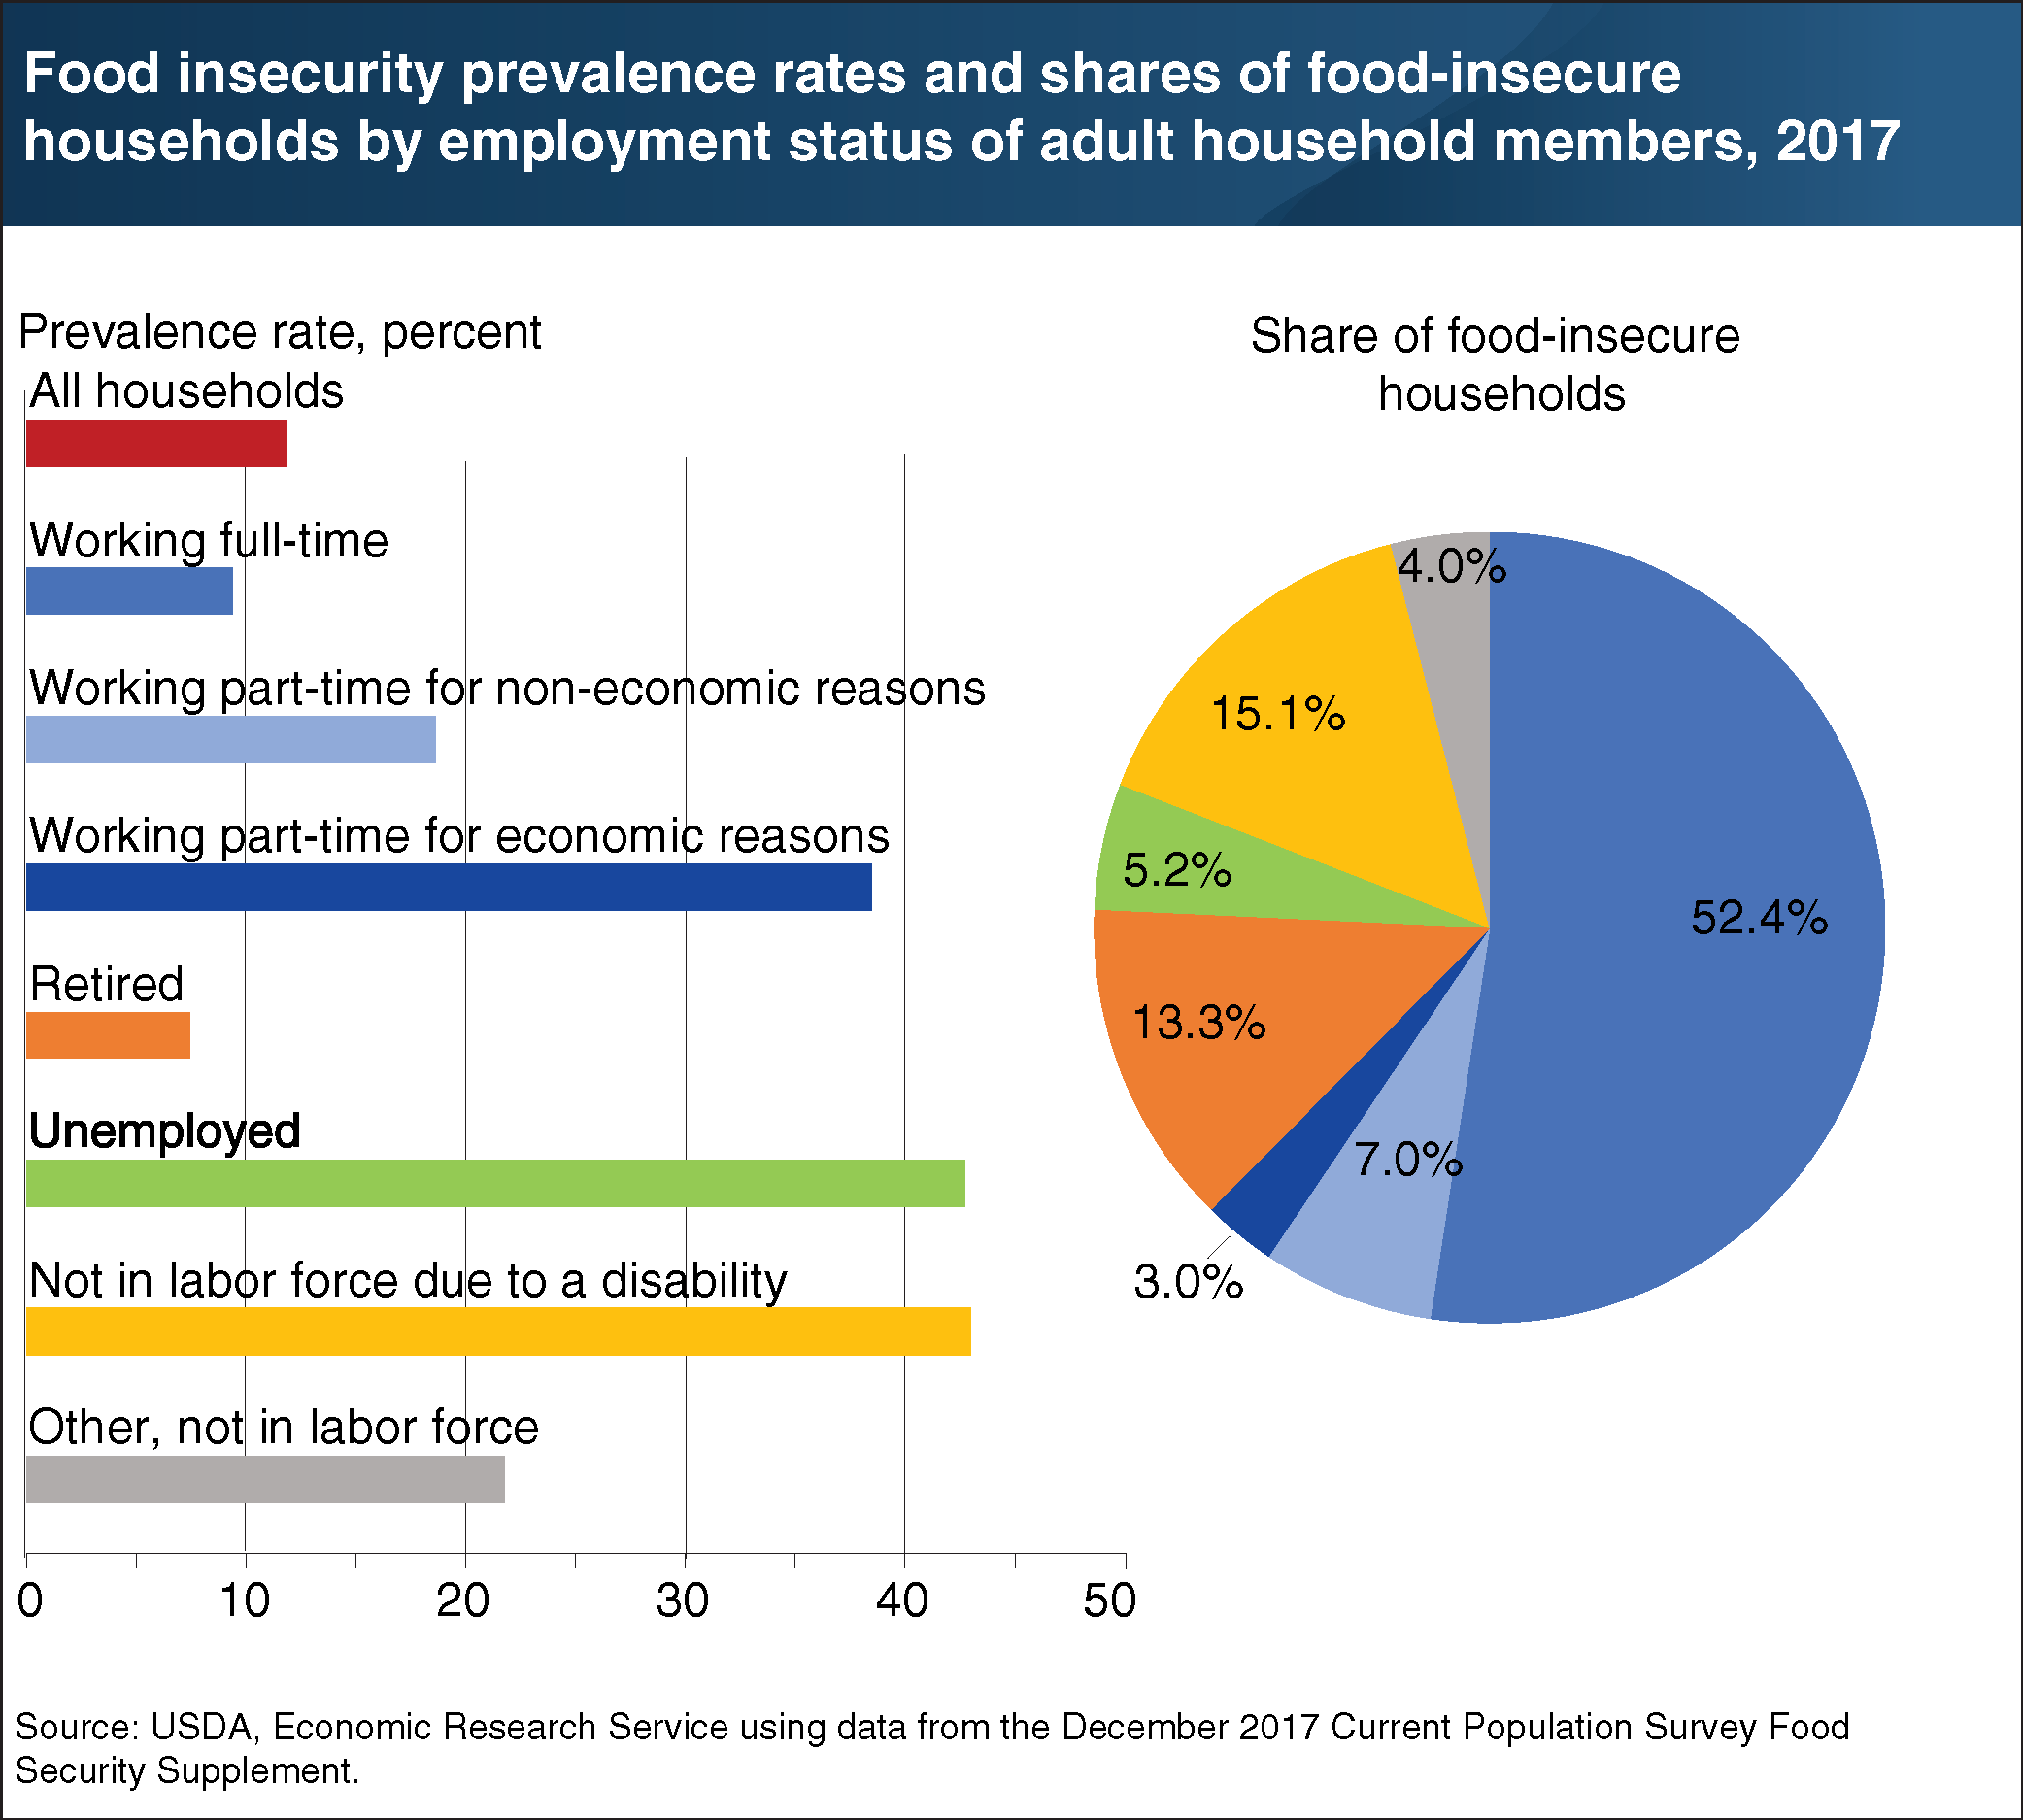
The prevalence of food insecurity—having difficulty providing enough food for all household members at some time during the year—varies across U.S. households by employment status of adult members. While some types of households may be more likely to be food insecure, those households may be less numerous and therefore make up a small share of all food-insecure households. For example, food insecurity rates in 2017 were highest for households with no one employed or retired and someone unemployed looking for work (42.7 percent) or with someone out of the labor force because of a disability (43.0 percent), but those households accounted for 5.2 and 15.1 percent, respectively, of all food-insecure households. In contrast, the food insecurity rate among households with an adult working full time was a relatively low 9.4 percent, but those households made up slightly over half of all food-insecure households, demonstrating that full-time employment does not fully protect households from food insecurity. Wages and benefits—not just number of hours worked—along with non-food obligations for the family’s earnings, can have significant effects on a household’s food-insecurity risk. A version of this chart appears in the ERS data visualization “Food insecurity and very low food security by education, employment, disability status, and SNAP participation.”