
2018 Farm Act maintains conservation spending
- by Roger Claassen
- 2/12/2019
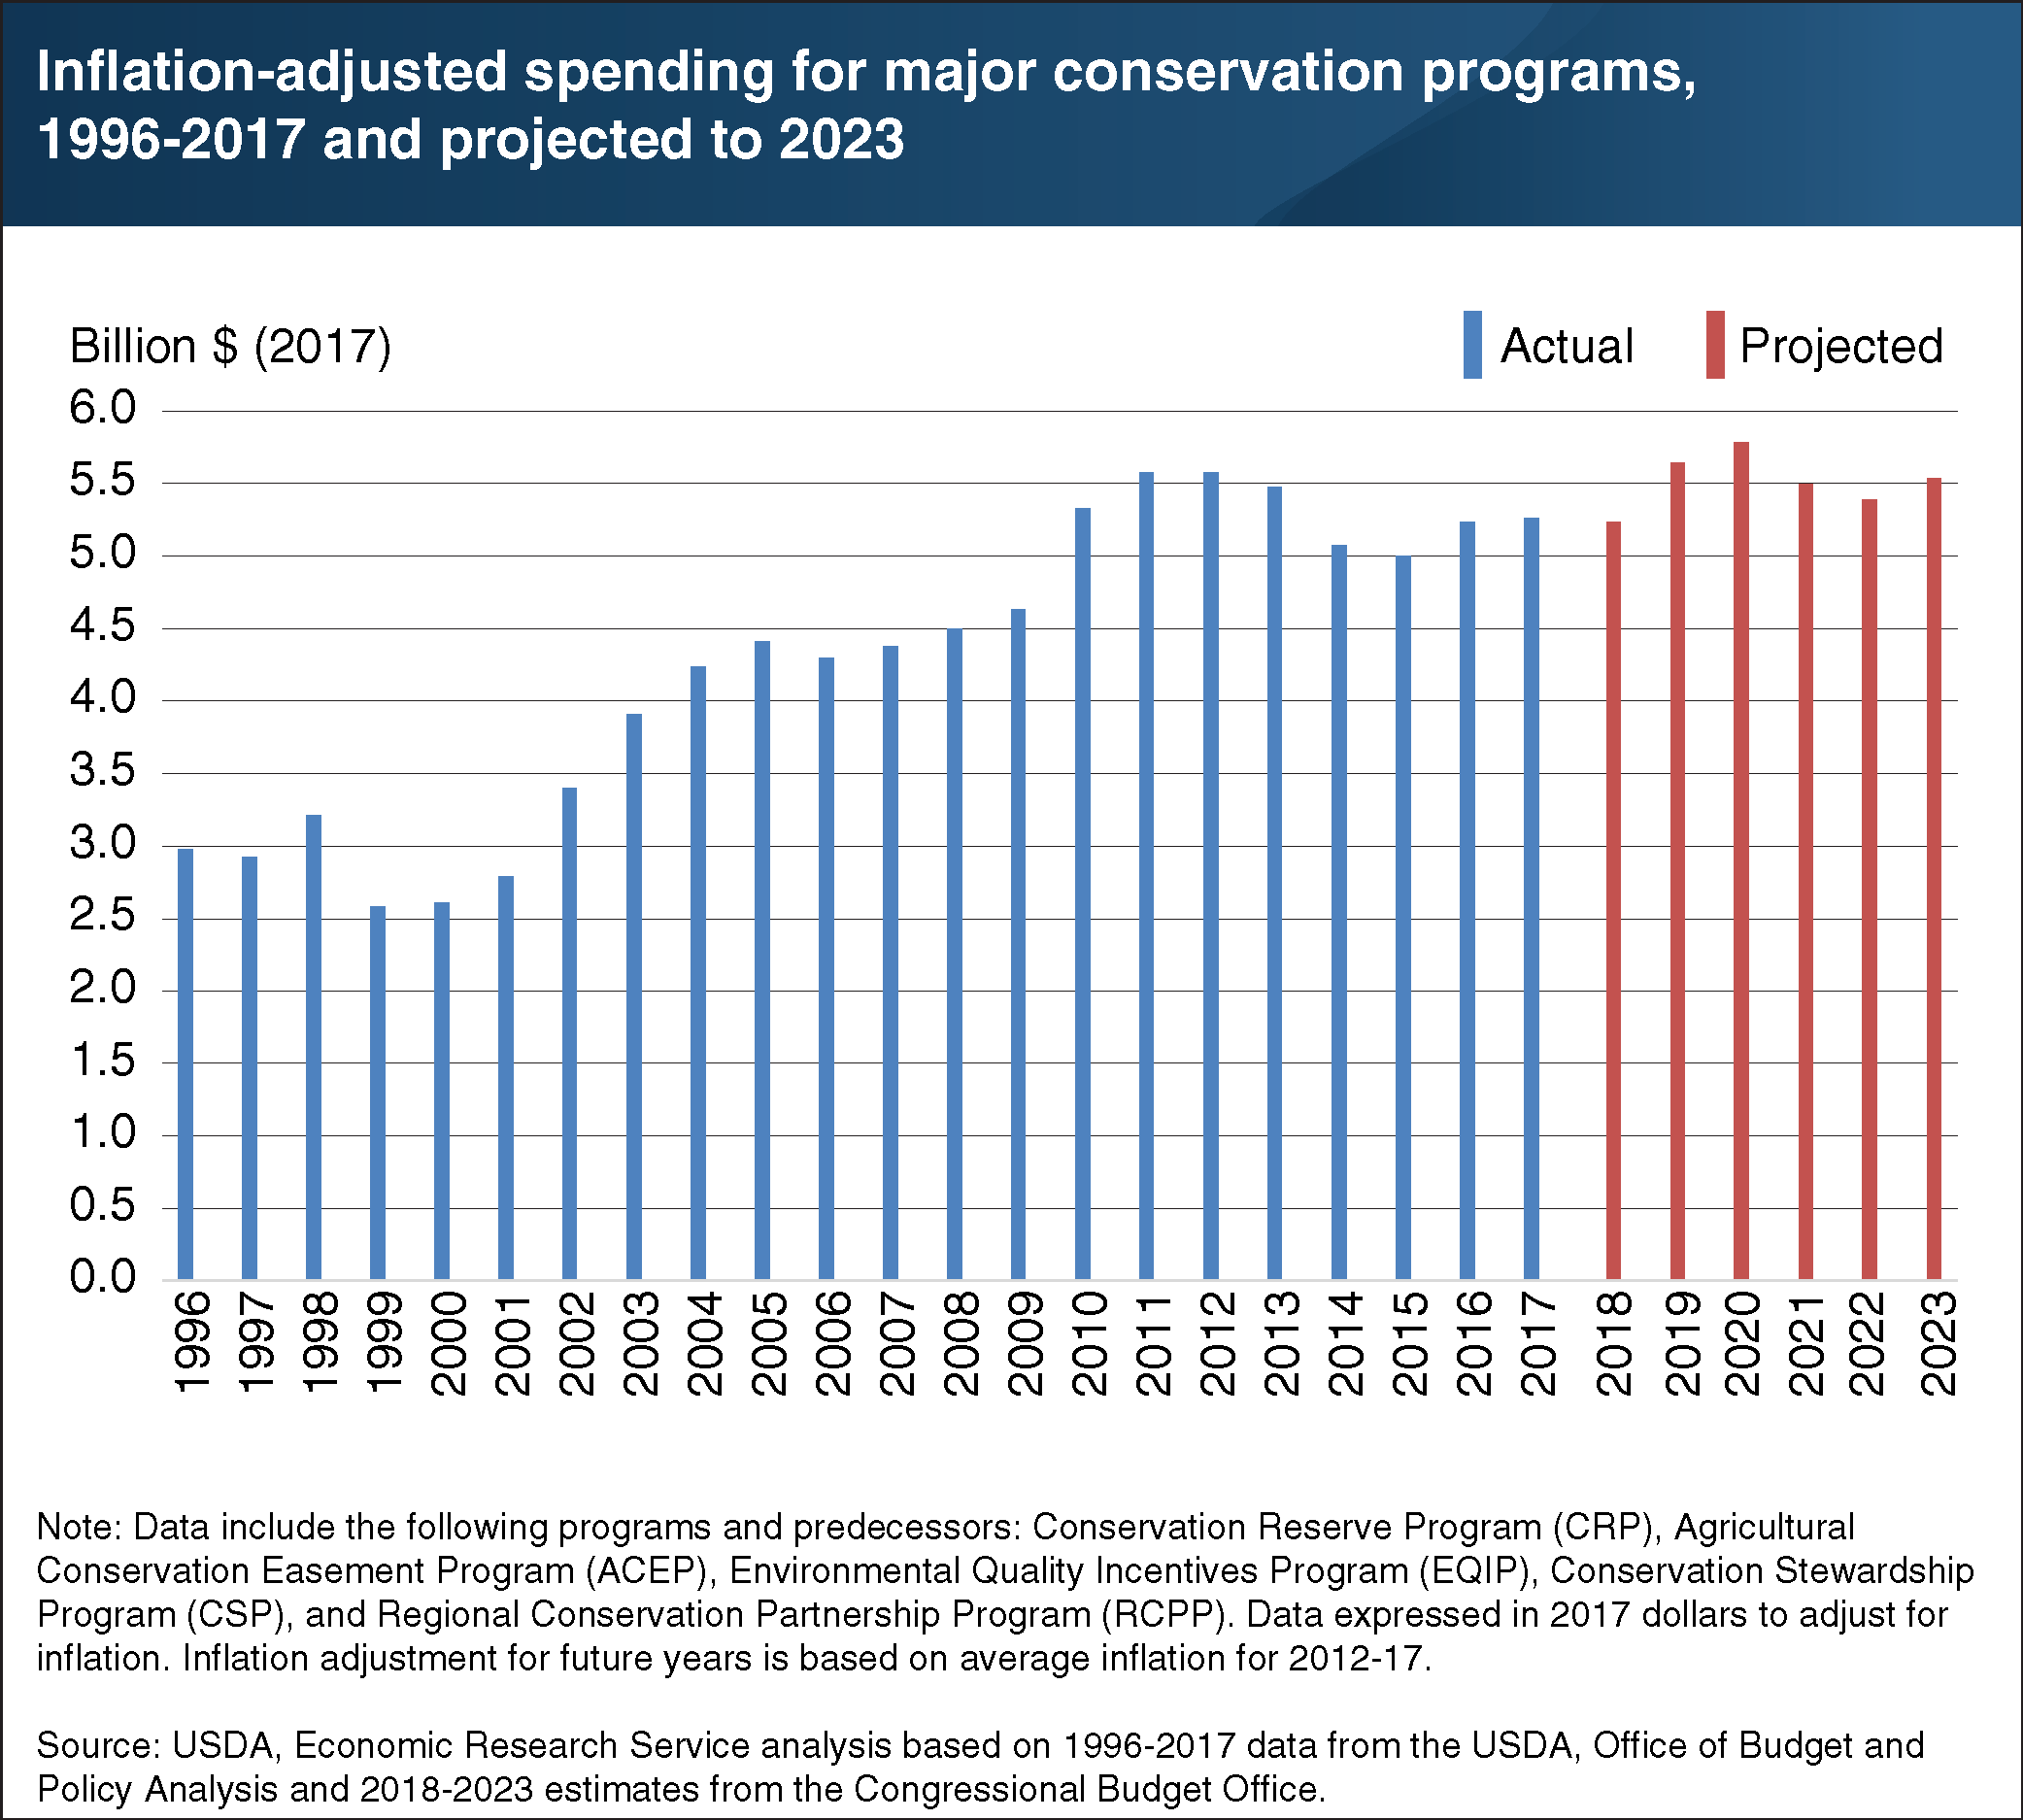
Voluntary conservation incentive programs are the backbone of U.S. agricultural conservation policy. For fiscal years 2019 to 2023, the Congressional Budget Office (CBO) projects mandatory spending on conservation programs under the 2018 Farm Act would be $555 million higher than baseline (projected) spending if the previous 2014 Farm Act had remained in force. That represents an increase of about 2 percent. Nearly all of this spending will flow through five programs: the Conservation Reserve Program, Conservation Stewardship Program, Environmental Quality Incentives Program, Agricultural Conservation Easement Program, and Regional Conservation Partnership Program. For these programs and their predecessors, inflation-adjusted spending increased under both the 2002 and 2008 Farm Acts (2002-2013) but was lower under the 2014 Farm Act (2014-2018). CBO projections suggest that the 2018 Farm Act will provide slightly higher funding, on average, than the 2014 Farm Act. Although program funding is mandatory and does not require appropriations, spending in future years is subject to congressional review and has sometimes been reduced from levels specified in the Farm Acts. This chart appears in the ERS topic page The Agriculture Improvement Act of 2018: Highlights and Implications, updated February 2019.